$CHESS investment Another currency that is technically suitable for spot investment is the chess currency, and you can buy and hold some.
CHESSUSDT trade ideas
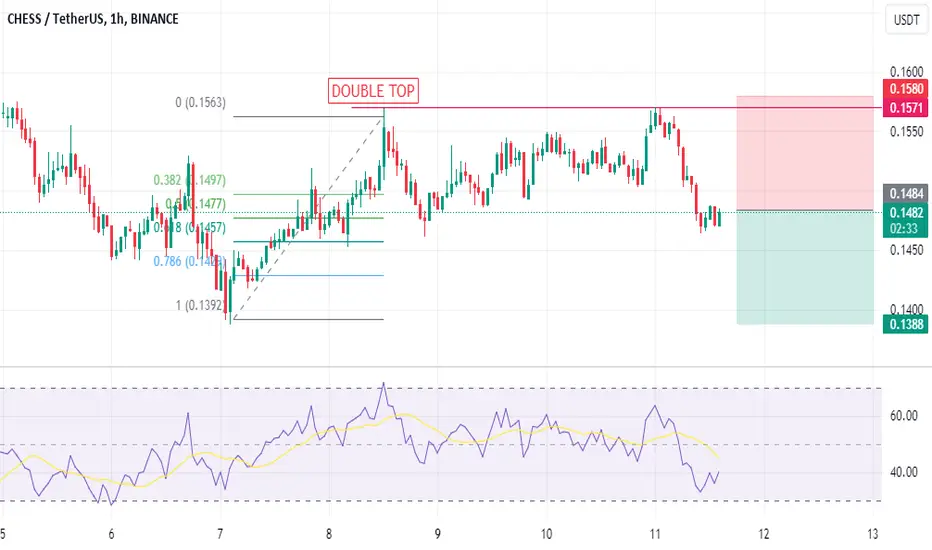
Chess / USDT: preparing for a breakout as it rebounds from key sCHESS/USDT: Preparing for a Breakout as It Rebounds from Key Support
CHESS/USDT is showing bullish signs 📈 as it rebounds from a significant support zone and approaches a key resistance level 📊. The pair has been steadily climbing, setting the stage for a potential breakout 💥 above resistance. A confirmed move could spark strong bullish momentum 🚀. Stay alert 👀 and wait for solid confirmation before making any moves.
Key insights:
1. Support bounce: CHESS/USDT has successfully rebounded from a critical support level, signaling strong buyer interest and increasing the likelihood of a bullish move.
2. Approaching resistance: The price is nearing a resistance zone that has capped previous upward movements. A break above this level could trigger a sustained uptrend.
3. Bullish indicators: Momentum indicators like RSI and MACD are turning upwards ⚡, supporting the case for further bullish momentum.
Steps to confirm the breakout:
Monitor for a clear 4H or daily candle closing above the resistance zone 📍.
Look for a spike in trading volume during the breakout to validate buyer strength 🔥.
A successful retest of the resistance level as new support adds credibility to the breakout ✅.
Beware of fakeouts, such as wicks or sharp reversals below the resistance ⚠️.
Risk management strategies:
Use stop-loss orders to minimize potential losses 🔒.
Adjust position sizes to align with your overall risk tolerance and trading strategy 🎯.
This analysis is for educational purposes only and does not constitute financial advice. Always conduct your own research (DYOR) 🔍 before making investment decisions.
Do you play CHESS?Very strong confirmation for bulls here. TA and PA is bullish. Playing spot here.
NOT A FINANCIAL ADVICE
MANAGE YOUR RISK AND ALWAYS USE STOPLOSS

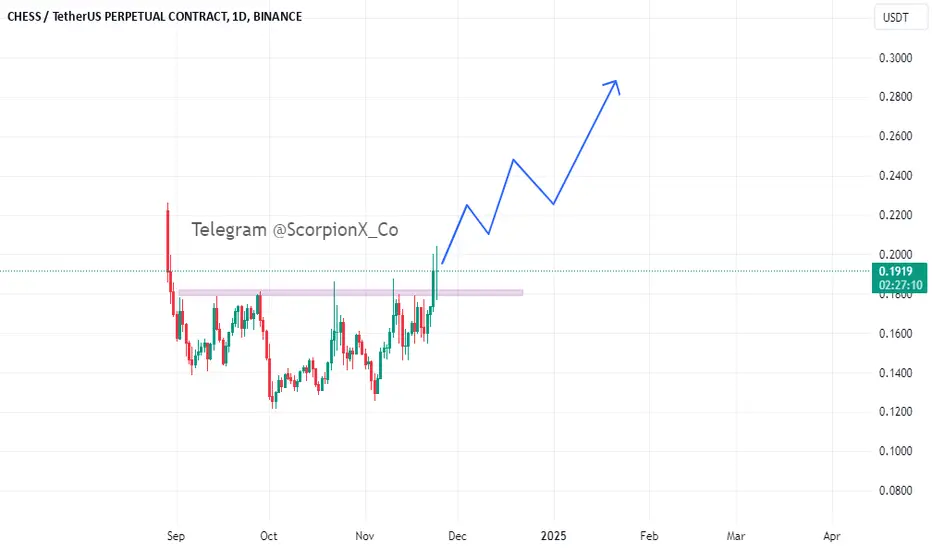
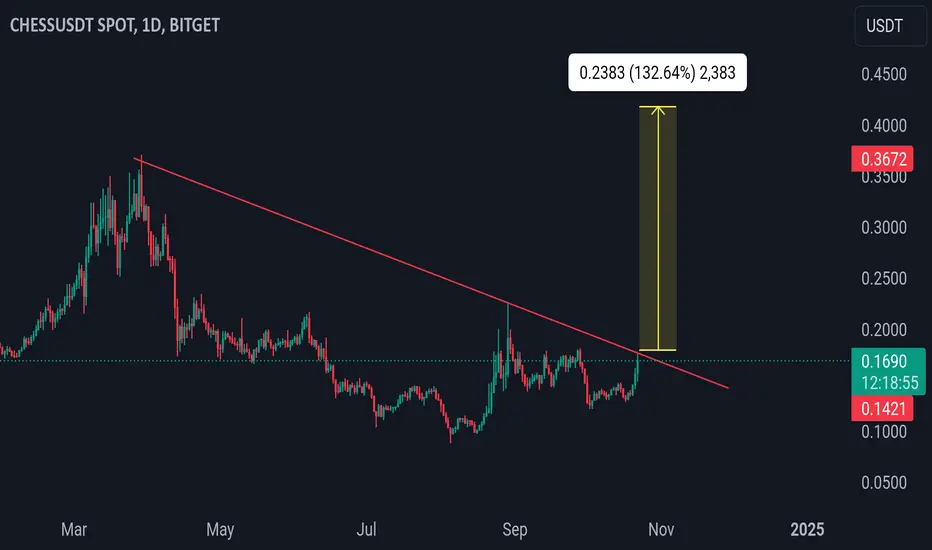
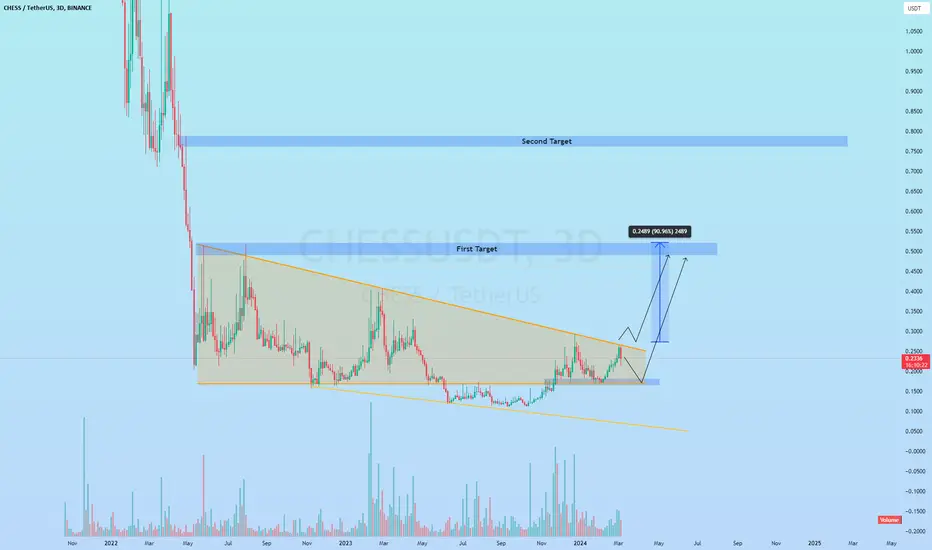
CHESS - the boxThe price has been in accumulation for a long time; after the breakout, you can expect the marked goals to be achieved
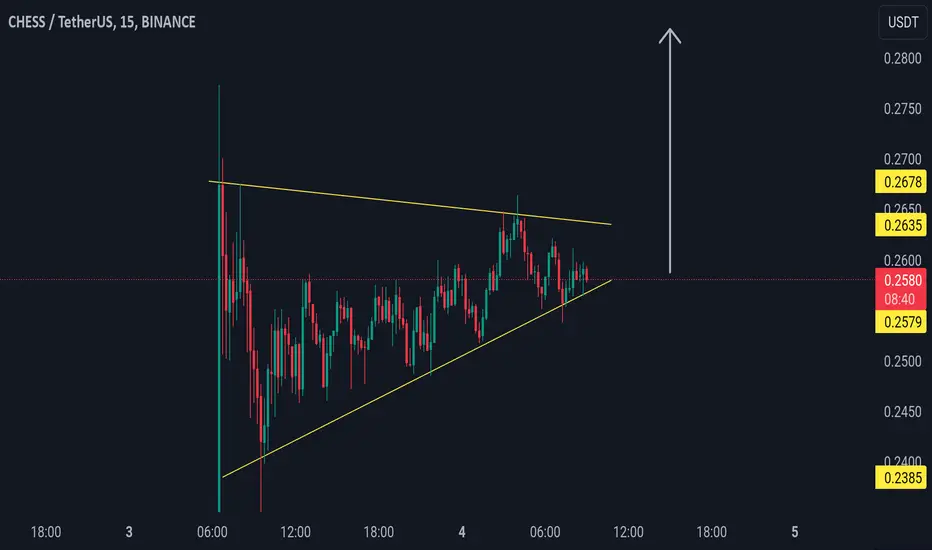
CHESS/USDT on the verge of a big breakout!🚀 CHESS/USDT on the verge of a big breakout! 🚀
The CHESS/USDT pair is showing signs of a potential breakout, and the momentum is building up. 📈 The price is testing key resistance levels, and if it successfully breaks through, we could see a solid bullish rally. 🔥
💡 What to watch for:
- A confirmed breakout above the resistance could trigger a sharp upward move. 🚀
- Increased trading volume may signal stronger buying interest. 📊
👀 Keep an eye on it: This setup could present exciting opportunities. However, always do your own research and manage your risk. 🧐
⚠️ Disclaimer: This is not financial advice. DYOR (Do Your Own Research).
Buying CHESS hereCHESS is showing some strenght, i am expecting small dip on a new 3D candle and then move up... targets 20-50% short term. GL
NOT A FINANCIAL ADVICE + MANAGE YOUR RISK AND USE STOPLOSS

CHESSUSDTWe can attempt to buy CHESSUSDT from specified level as it break LH , also bullish divergence occur indicate that it moves upward.
SL , TP mention in chart.

CHESSUSDTWe can attempt to short CHESSUSDT from specified level as it break HL , also there is bearish divergence occur indicate that it moves downward.
SL , TP mention in chart.
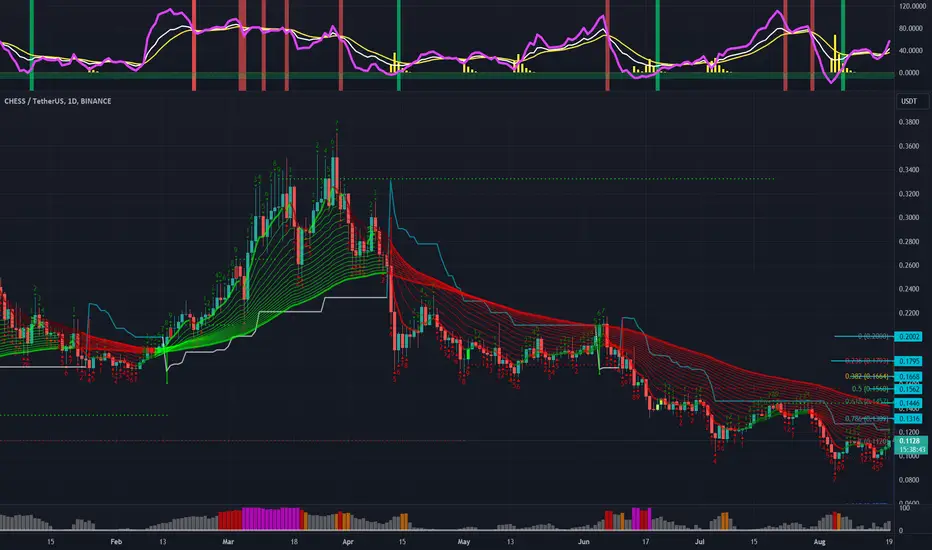
CHESSUSDT(Tranchess) Updated till 29-08-24CHESSUSDT(Tranchess) Daily timeframe range. it had a pretty nice retrace from its old low. now PA trying to claim above 0.1765 level, if it can that will give PA another chance to push toward 0.2251. but if 0.1765 fails than will get back to 0.1390.

Chess / Usdt BINANCE:CHESSUSDT
Certainly! Here’s an explanation of the price levels and resistance/support zones for Chess:
**Current Situation:** The price of Chess is at $0.2122, which is currently at a resistance zone. Resistance zones are levels where the price often struggles to rise above because selling pressure increases.
**If Price Breaks Resistance:** If the price manages to break above the current resistance at $0.2122, the next significant resistance level to watch is $0.2501. This is where the price might face another obstacle, as sellers might start to come in, potentially preventing the price from rising further.
**Support Levels:** If the price does not hold at $0.2122 and begins to fall, the next support level is $0.1691. Support levels are points where buying pressure could increase, potentially halting or slowing down the decline. If the price falls below $0.1691, it could continue to drop towards lower support levels at $0.142 and $0.1123. These are additional levels where the price might find some buying interest and stabilize.
**Summary:** To sum up, if Chess breaks through $0.2122, it might reach up to $0.2501. However, if it falls below $0.2122, it could drop to $0.1691, with further declines possible towards $0.142 and $0.1123. Monitoring these levels can help traders make informed decisions about buying or selling.
Disclaimer : I am Not Financial Adviser . If You Loss Money Its Your own Headache or Problem . Do Not Invest If You Think You always Gonna Make Money . (DYOR) Always Do You Own Research...

CHESSUSDTWe can attempt to buy CHESSUSDT from specified level if it break LH , also bullish divergence occur indicate that it moves upward.
SL , TP mention in chart

CHESS hit the bottomTranchess is moving in the right direction this morning (on smaller time frames)
Targets on chart
More signals bellow
#CHESS/USDT#CHESS
We have a bearish channel pattern on a 1-hour frame, the price moves within it and adheres to its limits well
We have a green support area at 0.1773 after the price touched it and bounced from it
We have a tendency to stabilize above moving average 100
We have an uptrend on the RSI indicator that supports the price higher
Entry price is 0.1830
The first goal is 0.1949
The second goal is 0.2000
The third goal is 0.2070

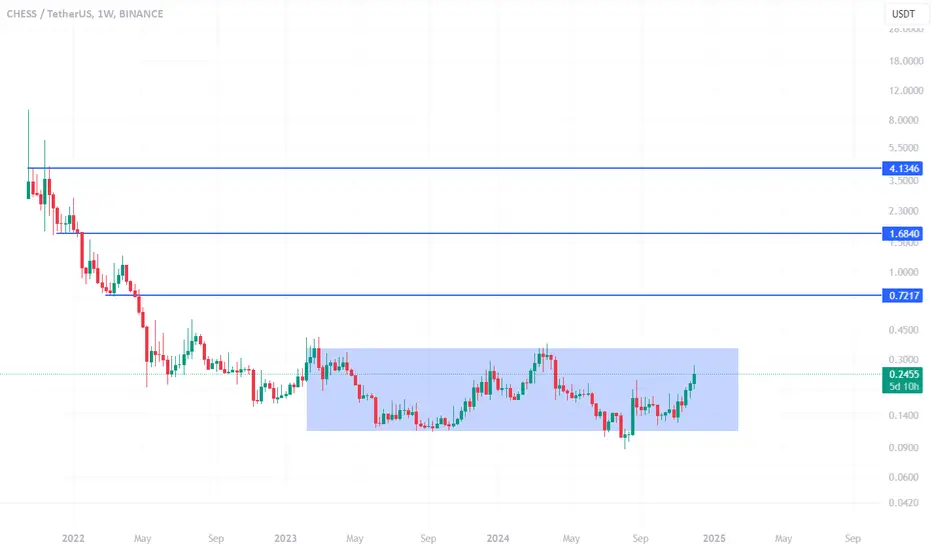
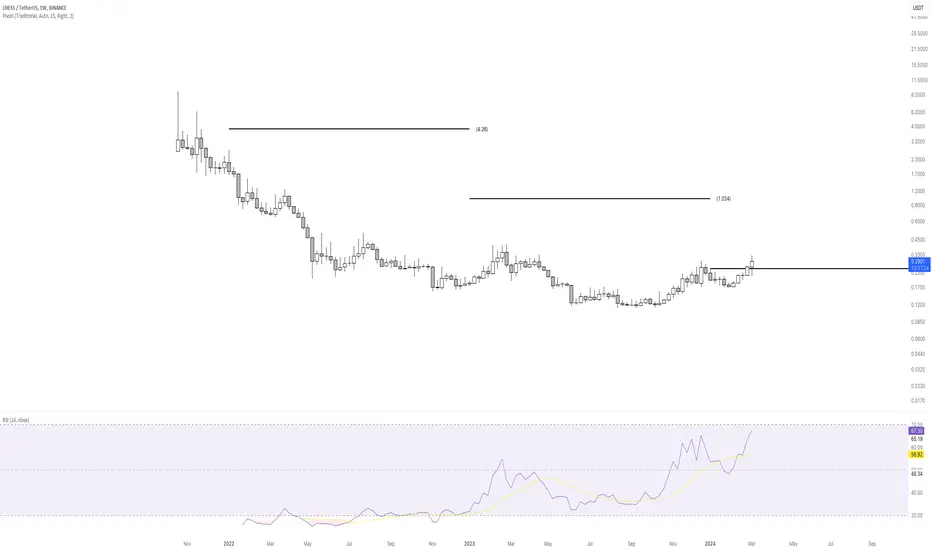
CHESS to print a 2000% move?On the above weekly chart price action has corrected 96% since late 2021. A number of reasons now exist to consider a long position, including:
1) Price action and RSI resistance breakouts.
2) Support and resistance. Price action prints multiple weekly candles on past resistance. Oh yes.
3) Regular bullish divergence. Multiple oscillators print positive divergence with price action as measured over a one month period. This includes money flow.
4) The falling wedge forecasts a 2600% move from the breakout point as measured from the lowest and highest touch-points (blue circles).
Is it possible price action corrects further? Sure.
Is it probable? No.
Ww
Type: Trade
Risk: <=6%
Timeframe for long: Yesterday
Return: 20-25x
#CHESS/USDT#CHESS
We have had a symmetrical bearish channel since July 2022
It was broken by moving average 100 upwards
We are heading to touch the downward trend of the channel as a first goal
Current price 0.1853
Second goal 0.3228
Third goal 0.5094
Which represents 280% of the current price

CHESS has a good potential To pumpTarget are there ... if it breaks the trend line it can pump like a moon or something.
but the support line it will be huge profitable if hit it
CHESS aims for higherCHESS has broken its downward trend line, and has completed 123 structure. This trade setup has very good upward potential and excellent risk reward.
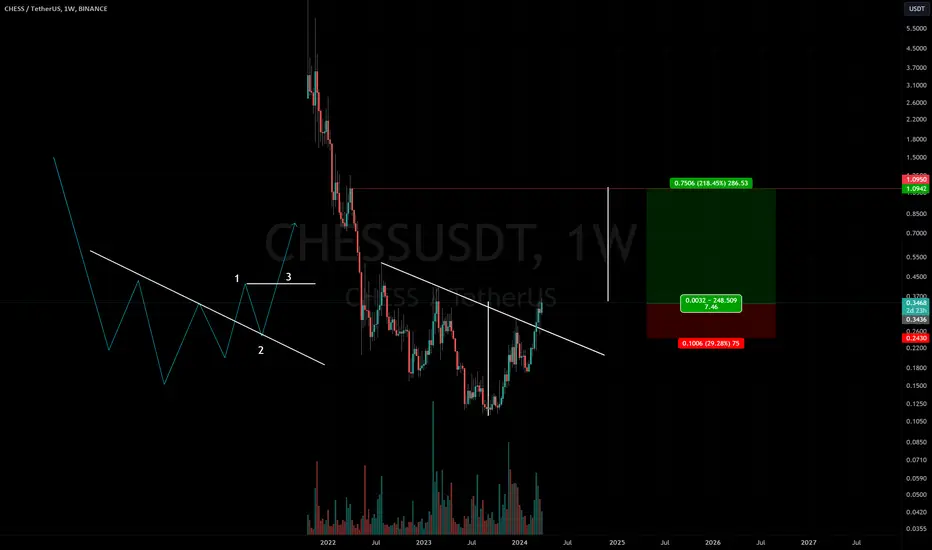
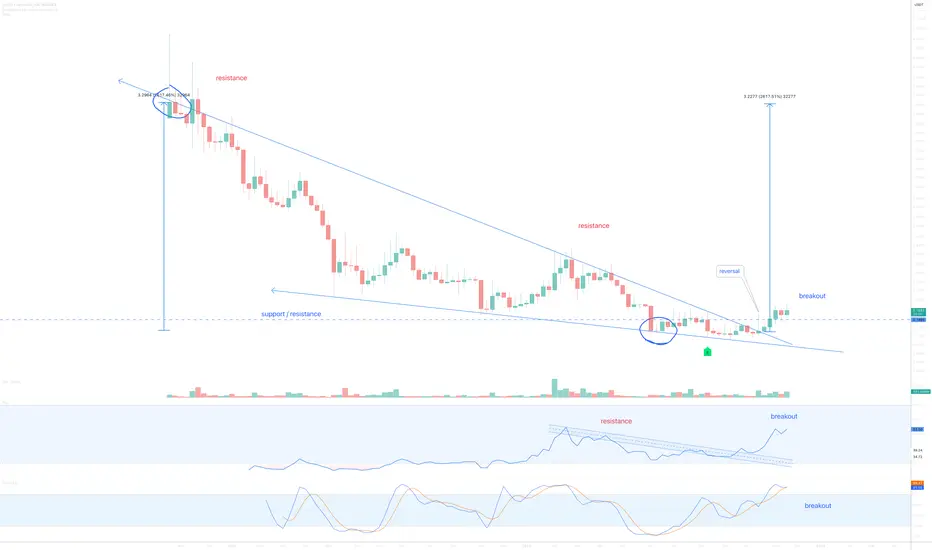
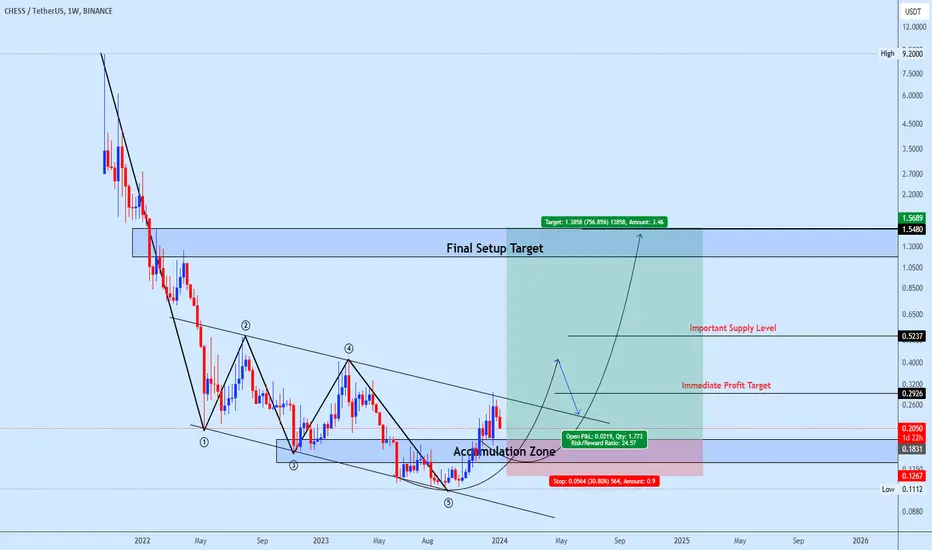
Chessusdt Trading opportunityCHESSUSDT appears to be trading within a descending channel formation, it seems to have completed a five descending legs. This observation gives us a strong bullish bias for the coin, as we are now anticipating a breakout to the upside in the near term.
To capitalize on this potential upward movement, we have identified a possible accumulation zone. This zone is selected based on historical support levels and the lower boundary of the descending channel, which traders may consider as an entry point for long positions. To manage the inherent risks of trading, we suggest placing a stop loss just below the most recent swing low within the channel.
Furthermore, we have outlined specific profit target levels on the chart. These targets are based on key resistance levels that could be encountered as the price ascends post-breakout.
Your engagement with our content is highly valued, so please remember to support our work by liking this post.
Thank you for your input and interaction.
#chess' pump must be insaneVery well accumulated during liquidation phase... So pump will be hard!
NOT FINANCIAL ADVICE.
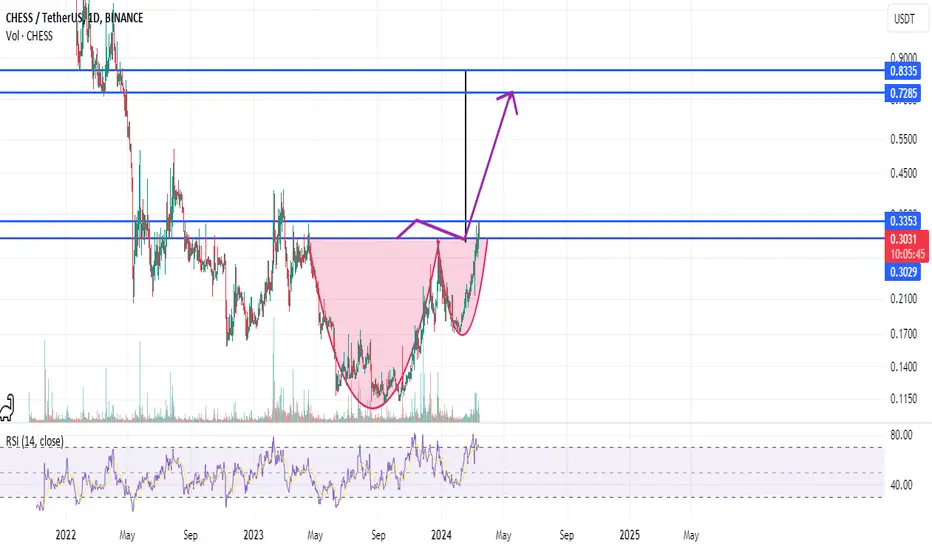
chess undervalued token on binance market cap 45m on binance which is undervalued . I expect that chess will break 0.33 cent resistance. cup and handle target is 0,83 cent easy 2,5x nfa
CHESSUSDT Resistance Breakout!CHESSUSDT Technical analysis update
The CHESS price has broken its resistance trend line after 675 days of consolidation. We can expect a gradual upmove in CHESS in the coming days.
Buy zone : Below $0.33
Stop loss : $0.245
Regards
Hexa

♟️ CHESS - I want to play a game Tranchess is an asset tracking protocol that offers investors different risk and return profiles. Essentially, it uses a series of sub-funds, called tranches, to offer different return matrices from a single parent fund.
I think we will see $1 soon.
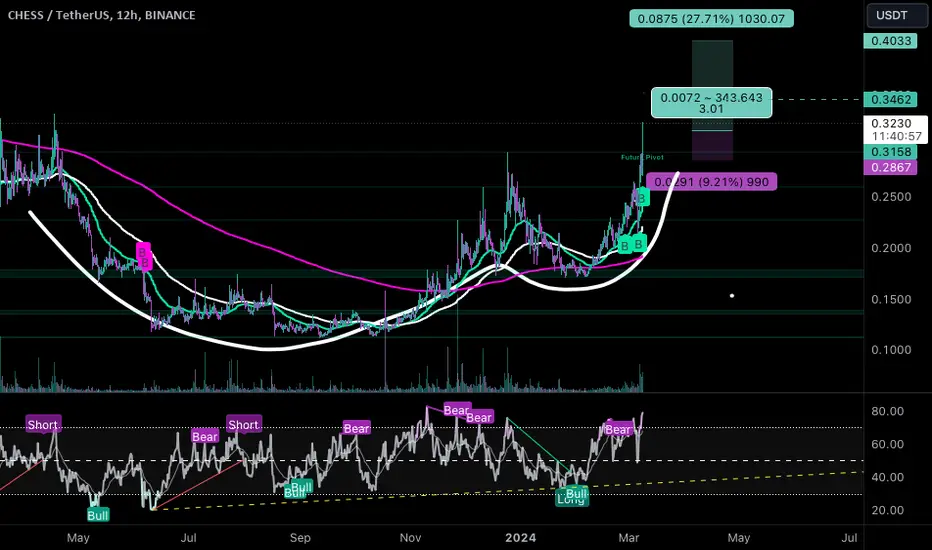
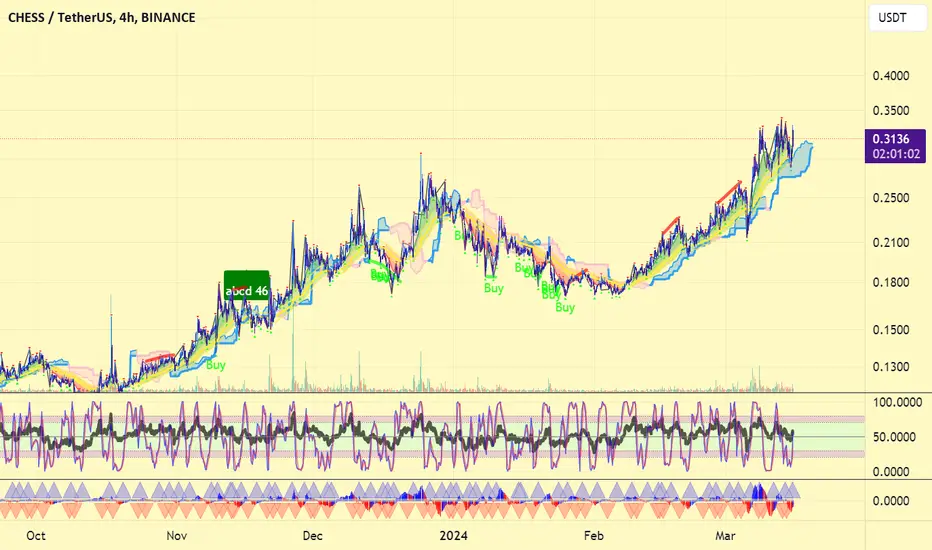
#CHESS/USDT - Long - Potential 27.71%Strategy: Long
Exchange: BINANCE
Account: Spot
Entry mode: Market order in range
Invest: Risk 1%
Exit:
• ⎿ Target 2 : 0.4033 26.82%
• ⎿ Target 1 : 0.3462 8.87%
Entry: 0.3180 ⌁ 0.3180
• ⎿ Current market price: 0.318
Stop: 0.2867 (-9.84%)
Technical indicators:
Cup and handle break (common this cycle), RSI momentum and resistance break.
• ⎿ 24h Volume: 9919246.98593
• ⎿ Satoshis: 0.318
• ⎿ Analysis: TradingView