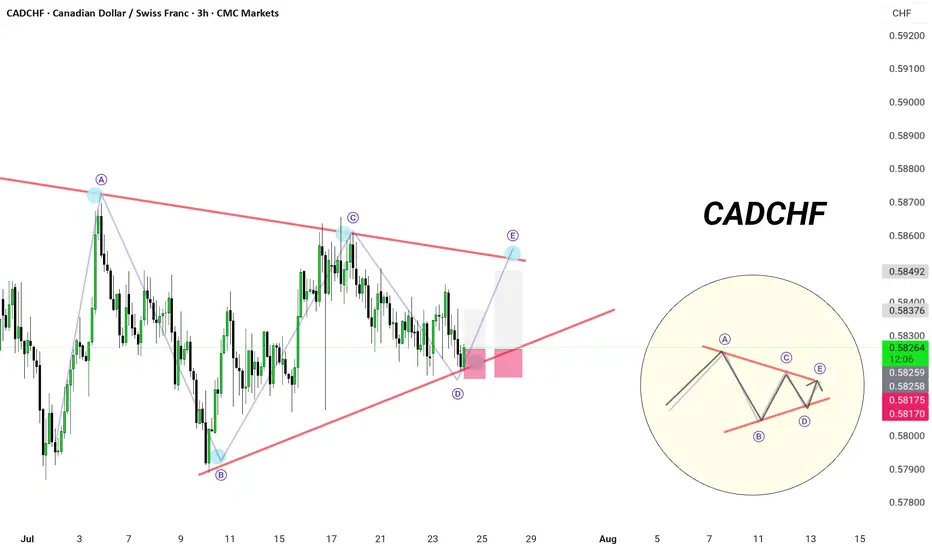
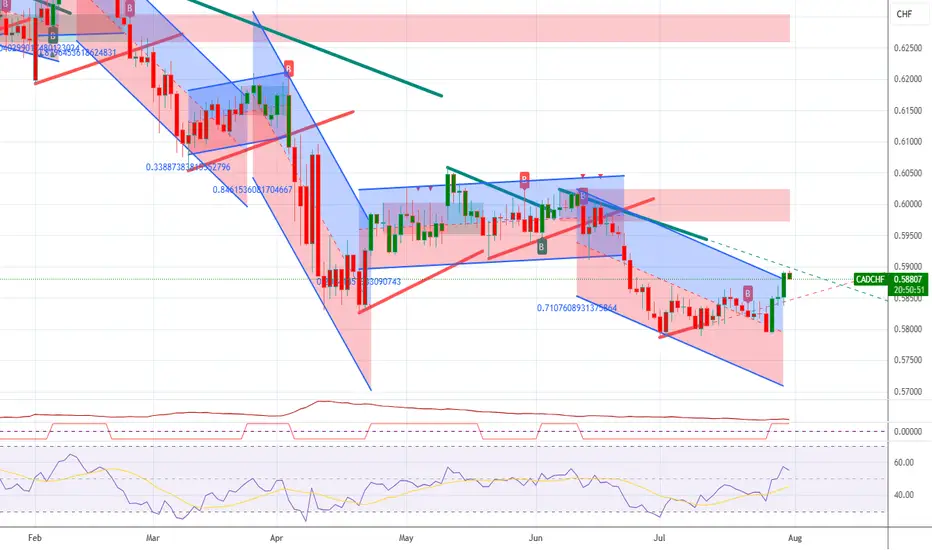
CADCHF | 3H Chart |
🎯 Triangle Tightens — Precision Required
In true Monaco fashion — elegance meets precision.
🟪 Pattern: Contracting Triangle (ABCDE)
⚙️ Price perfectly respecting dynamic structure
📍Currently printing leg D → E with bullish momentum from the base trendline
🎯 Anticipated move towards 0.5849 resistance zone
🧠 Playbook Setup:
📈 Long from 0.5817–0.5820
🎯 Target: 0.5837–0.5849
🛑 Invalidation: Close below 0.5817
🚧 Wave E = decision point
Breakout or reversal? Play the retest like a gentleman.
📊 Bias: Short-term bullish to complete the structure — then react, not predict.
CHFCAD trade ideas

CADCHF Bearish IdeaPrice has recently tapped a supply zone on the 1-hour timeframe and is now forming a Distribution Schematic Phase 2. Based on current market structure and order flow, we expect a continuation to the downside.

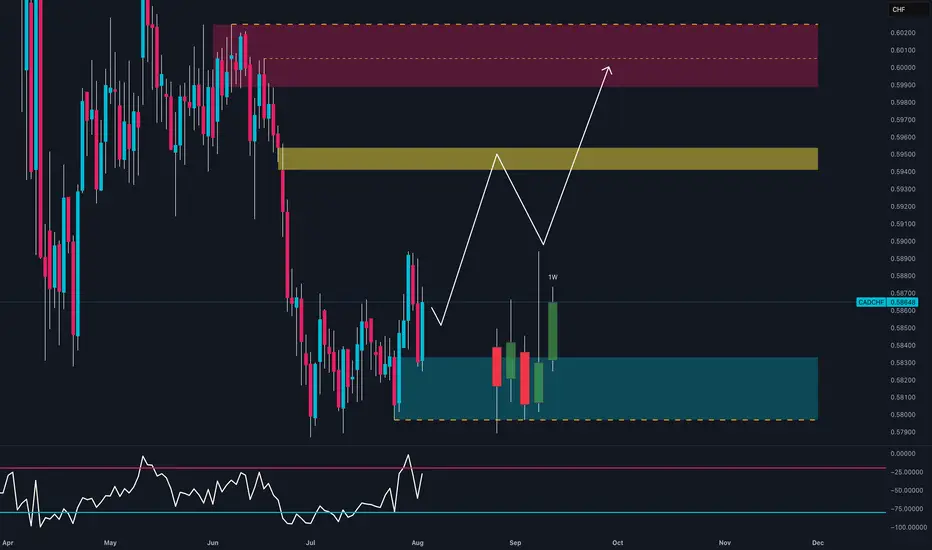
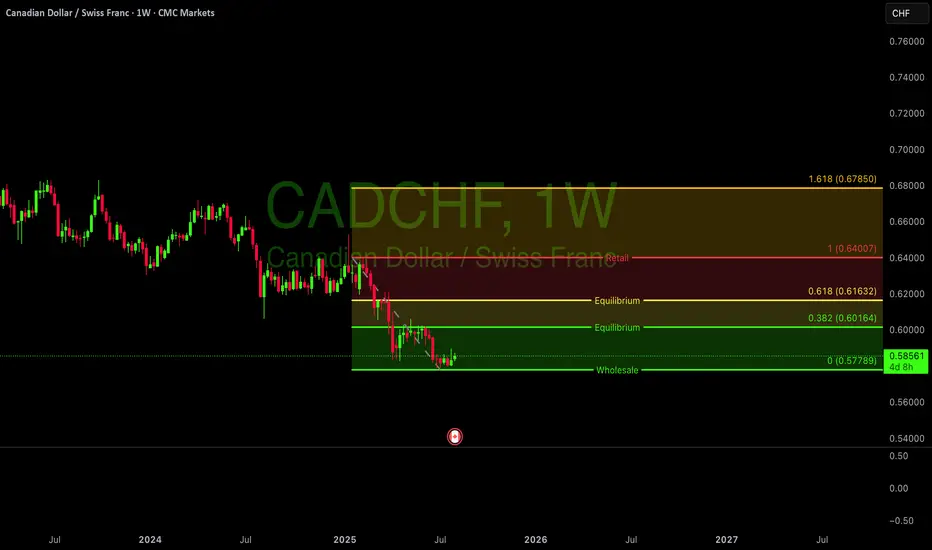
Everyone’s Short on CAD… But This Is Why I’m Going Long📊 CAD/CHF – August 4th, 2025 | Tactical Long Bias
🔹 Technical Outlook
The daily chart shows:
Strong bullish reaction within a weekly demand zone (0.5800–0.5830), confirmed by multiple lower wicks → growing buying pressure.
Weekly RSI bouncing out of oversold → potential mid-term reversal signal.
Structure may be shifting with a first target at 0.5950 (intermediate zone) and second target at 0.6000–0.6030 (major supply).
Recent bullish engulfing broke out of inside candle sequence → active technical trigger.
🧠 Commitment of Traders (COT) – July 29
Non-Commercials:
CAD: Aggressive increase in shorts (+3,888) and reduction in longs (-2,222) → heavily bearish speculative positioning.
CHF: Increase in longs (+936) and decrease in shorts (-1,095) → net bullish sentiment on CHF.
📌 However, CAD’s overstretched short positioning may lead to technical short-covering, especially if CHF starts to lose momentum.
📈 Seasonality – August
CHF: Range-bound or weak in August across all timeframes (20y, 15y, 10y).
CAD: Mild seasonal strength in August, especially on the 2y and 5y outlook.
➡️ Seasonal bias supports a tactical long on CAD/CHF during the first half of August.
✅ Trading Outlook
📌 Tactical Bias: LONG
🎯 First Target: 0.5950 → mid-level reaction zone.
🛑 Invalidation: below 0.5800 (demand breakdown).
🧠 Confluences: demand zone + RSI reversal + extreme COT positioning + seasonal support.
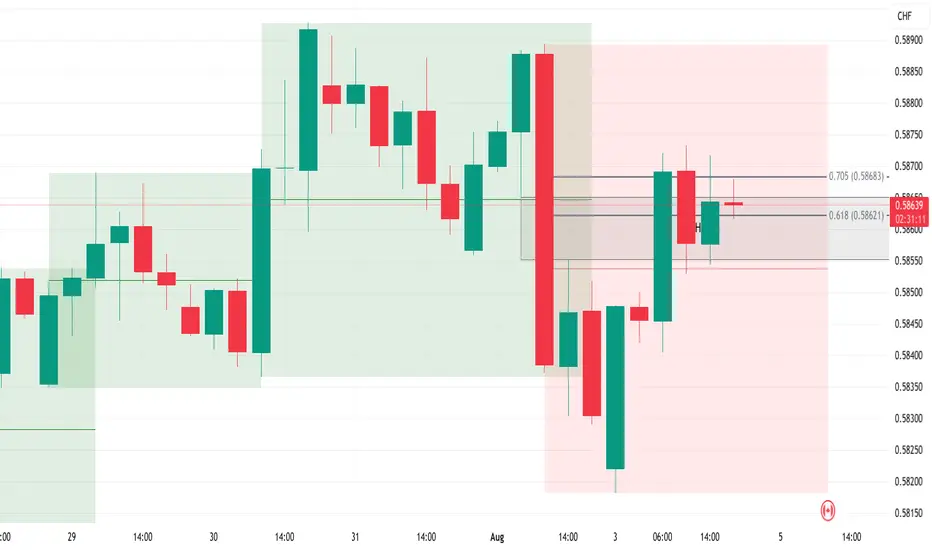
SELL trade using FVG and FIB levelSELL Opportunity on , price is currently within the 4hFVG and has r reacted to the .705 fib level , looking for lower time frame confirmation to go short
Bullish Trade Idea for ^CADCHFBullish Case
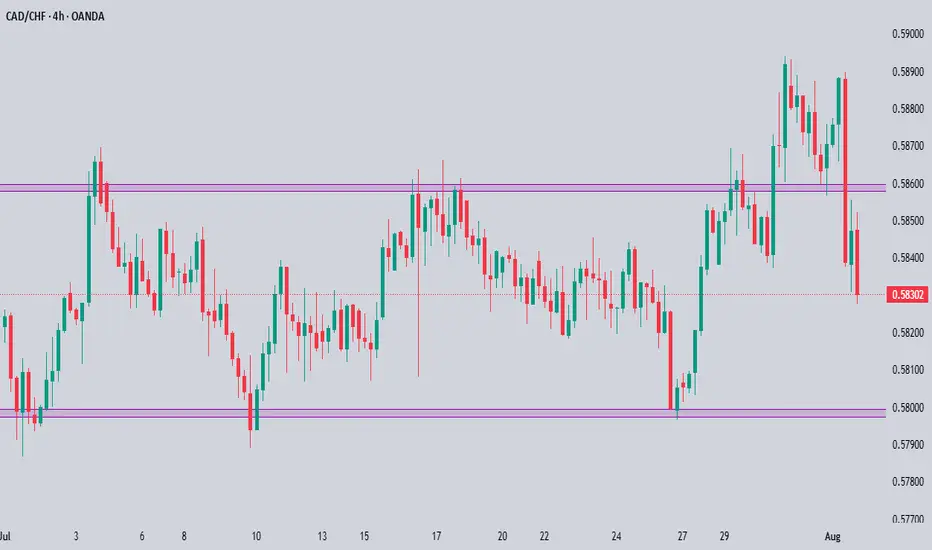
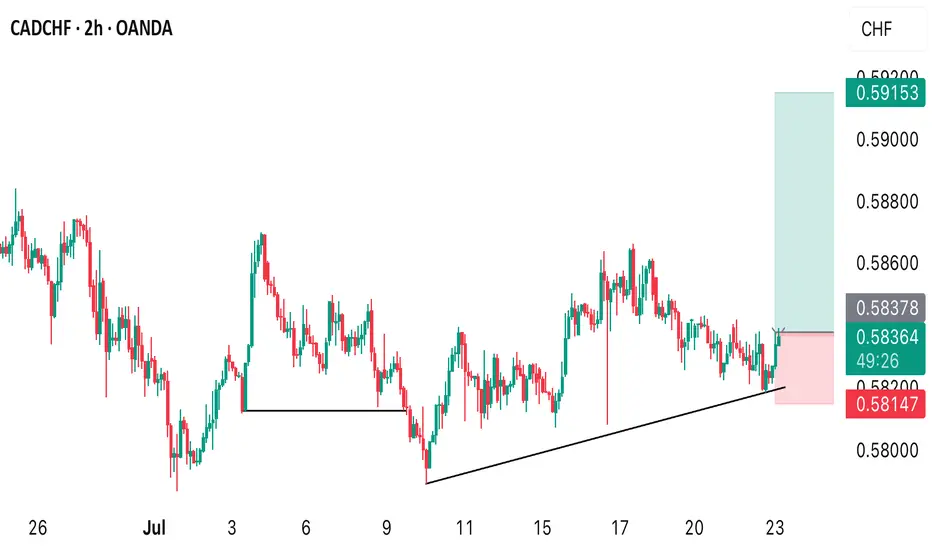
Consolidation at Key Support: Price has been consolidating between 0.579-0.583 for several weeks, showing resilience at this level. This suggests a potential exhaustion of the downtrend.
Higher Lows Formation: Looking at the recent 4-hour chart, we can see a series of higher lows forming since July 30th, indicating increasing buying pressure.
Potential Double Bottom: The price action in late July shows a potential double bottom formation around 0.579-0.580, which is a classic reversal pattern.
Momentum Shift: Recent price action shows increased volatility with bullish candles gaining more ground than bearish ones, suggesting a potential shift in momentum.
Trade Setup
Entry Strategy:
Primary Entry: Buy at current market price (0.585-0.586)
Alternative Entry: Wait for a pullback to 0.582-0.583 support zone and enter on signs of bullish rejection (hammer, engulfing)
Stop Loss:
Place stop loss below the recent low at 0.578 (approximately 0.577 for buffer)
This represents a risk of about 80-90 pips
Take Profit Targets:
First Target: 0.595 (Key resistance level) - 100 pips profit
Second Target: 0.608-0.614 (Strong demand zone identified earlier) - 230-290 pips profit
Final Target: 0.628-0.635 (Supply zone) - 430-500 pips profit
Risk-to-Reward Ratio:
First target: 1:1.25
Second target: 1:2.9
Final target: 1:5.4
Trade Management
Partial Profit Taking: Consider taking 50% off at first target, 30% at second target, and let 20% run for the final target.
Stop Loss Adjustment: Move stop loss to breakeven after price reaches halfway to first target (around 0.590).
Time Frame: This is a medium-term swing trade with an expected duration of 3-8 weeks.
Catalysts to Watch
Swiss National Bank Policy: Any dovish signals from the SNB could weaken CHF and accelerate the bullish move.
Canadian Economic Data: Strong Canadian economic data, particularly in energy and commodities sectors, could strengthen CAD.
Risk Sentiment: Improvement in global risk sentiment typically benefits CAD over the safe-haven CHF.
Warning Signs to Exit Early
Break Below Support: If price decisively breaks below 0.578 with increased momentum.
Failure to Make Higher Highs: If price action fails to continue the pattern of higher highs and higher lows on the 4-hour chart.
Rejection at 0.590: Strong rejection at the 0.590 level could indicate the bullish momentum is fading.
This bullish trade idea for ^CADCHF is based on technical evidence of a potential trend reversal after a prolonged downtrend. The favorable risk-to-reward ratio makes this an attractive opportunity, with multiple profit targets allowing for flexible trade management.
CAD/CHF REASONS FOR PASSINGThis was one of those “almost” trades — the kind that looks good at first glance and tempts most traders to jump in.
We had:
✅ A strong, clearly respected support zone
✅ A breakout and retest
✅ A solid bullish engulfing candle
But with the VMS strategy, that’s not enough.
We also require volume and momentum confirmation — and in this case, those critical signals were missing. No alignment, no trade.
Early in my journey, the almost trades were the ones that kept catching me. They look close enough to take — until you realize they don’t meet all your criteria. That’s where discipline makes the difference.
By requiring volume and momentum to confirm the setup, you're not just trading a pattern… you're trading with strength and intention.
This is the kind of pass that protects your edge.

CADCHF sell trade taken to continue the downtrendCADCHF has been in a nice downtrend for a while now.
Once I saw that price bounced off the 20 EMA, I entered into a sell trade.
I've marked my entry, SL and TP.
Let's see how this trade plays out.

CADCHF--SHORT--02_08_25--Short term SELL opportunity
--entry: from upper side of orange channel
--TP: bottom side of green channel

CADCHF Technical & Order Flow AnalysisOur analysis is based on a multi-timeframe top-down approach and fundamental analysis.
Based on our assessment, the price is expected to return to the monthly level.
DISCLAIMER: This analysis may change at any time without notice and is solely intended to assist traders in making independent investment decisions. Please note that this is a prediction, and I have no obligation to act on it, nor should you.
Please support our analysis with a boost or comment!
sell cadchfwe reach to a resistance and then break the last low and pullback to broken low and then we enter....

CADCHF 4HThis CADCHF 4H chart shows a clear market structure shift (MSS) from bearish to bullish, confirming a possible trend reversal. Price has broken structure to the upside and is now pulling back into a bullish order block zone.
What’s likely to happen:
- Price is expected to retest one of the order blocks (preferably the second/lower one) before continuing upward.
- The green zone marks the potential take profit or target area.
What to do next:
1. Wait for a bullish reaction from one of the order blocks — like a bullish engulfing candle or a strong rejection wick.
2. Once confirmed, enter a buy trade with SL below the order block and TP around the top of the green zone.
3. Manage your risk wisely — don’t rush the entry. Wait for confirmation.
This setup is clean and shows smart money interest. Let the market come to your zone. Patience = precision.

Cad/chf sellI can see a stall in the cad dollar at this zone and is looking set for a pullback , I will be selling at 58,500 and looking for profits down at 57.876 a 0.74% profit 📈


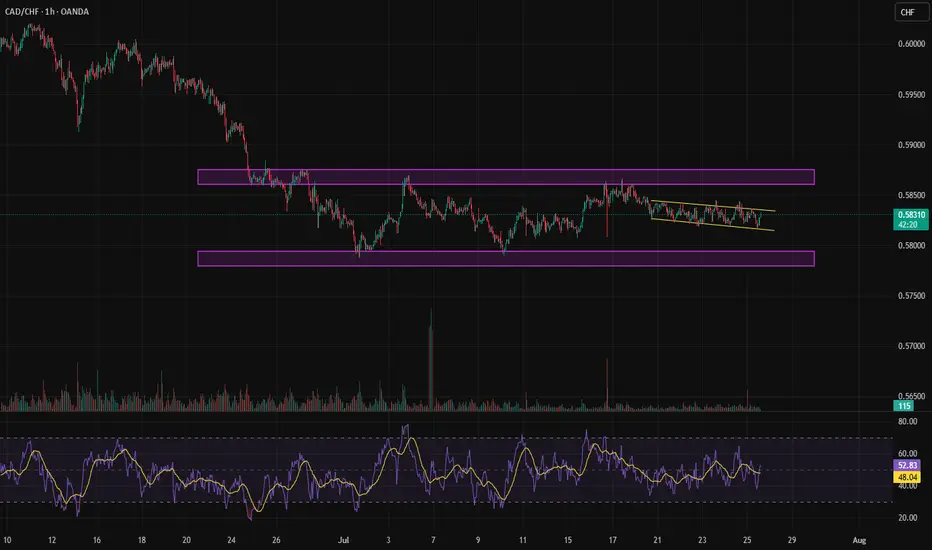
Close to breaking out of the range.After nearly 31 days, a consolidation has formed within the range, which could signal either a buy or sell opportunity.
CADCHF POSSIBLE BUY OPPORTUNITY FROM THE CURRENT PRICE!There’s a possible buy opportunity from the current price as we saw a rebound from the daily timeframe low of 0.57896 multiple times. I anticipate buyers to dominate the market
SELL CADCHF now for 4h time frame bearish trend continuationSELL CADCHF now for 4h time frame bearish trend continuation
SELL CADCHF now for a four hour time frame bearish trend continuation..........
STOP LOSS: 0.5845
This sell trade setup is based on hidden bearish divergence trend continuation trading pattern...
Always remember, the trend is your friend, so whenever you can get a signal that the trend will continue, then good for you to be part of it
TAKE PROFIT : take profit will be when the trend comes to an end, feel from to send me a direct DM if you have any question about take profit or anything.
Remember to risk only what you are comfortable with….....trading with the trend, patient and good risk management is the key to success here

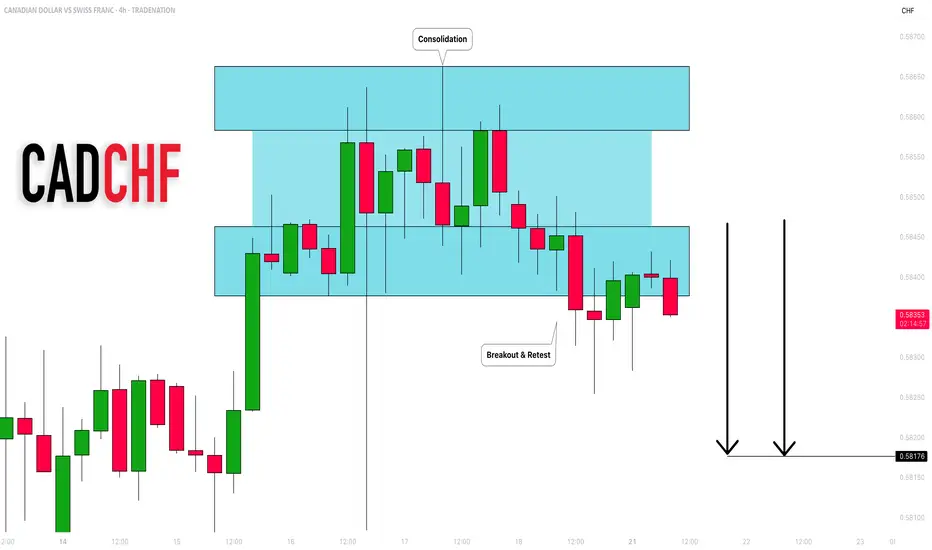
CADCHF: Bearish Outlook Explained 🇨🇦🇨🇭
CADCHF completed an intraday consolidation within a horizontal
parallel channel.
Its support was broken on Friday and we see a positive bearish
reaction to that after its retest.
With a high probability, the price will drop to 0.582 level soon.
❤️Please, support my work with like, thank you!❤️
I am part of Trade Nation's Influencer program and receive a monthly fee for using their TradingView charts in my analysis.
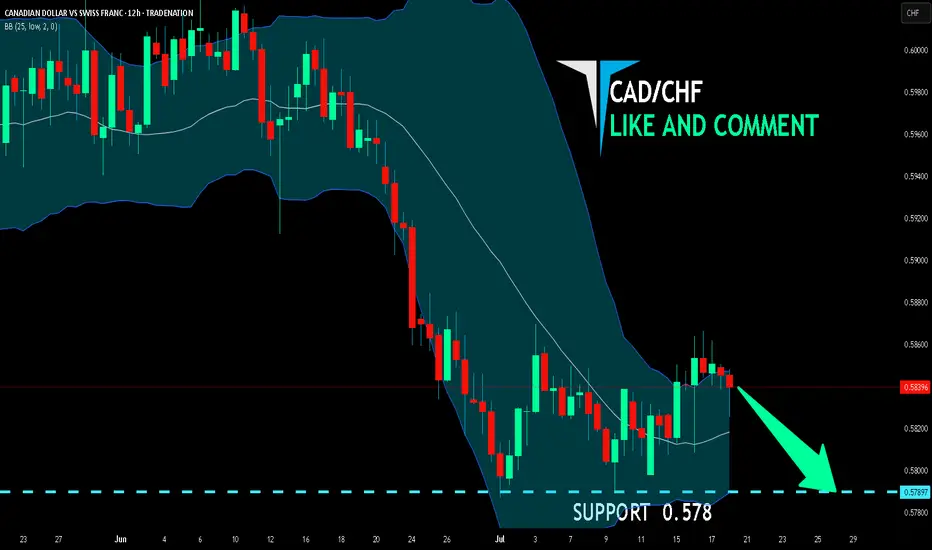
CAD/CHF SENDS CLEAR BEARISH SIGNALS|SHORT
Hello, Friends!
Previous week’s green candle means that for us the CAD/CHF pair is in the uptrend. And the current movement leg was also up but the resistance line will be hit soon and upper BB band proximity will signal an overbought condition so we will go for a counter-trend short trade with the target being at 0.578.
Disclosure: I am part of Trade Nation's Influencer program and receive a monthly fee for using their TradingView charts in my analysis.
✅LIKE AND COMMENT MY IDEAS✅
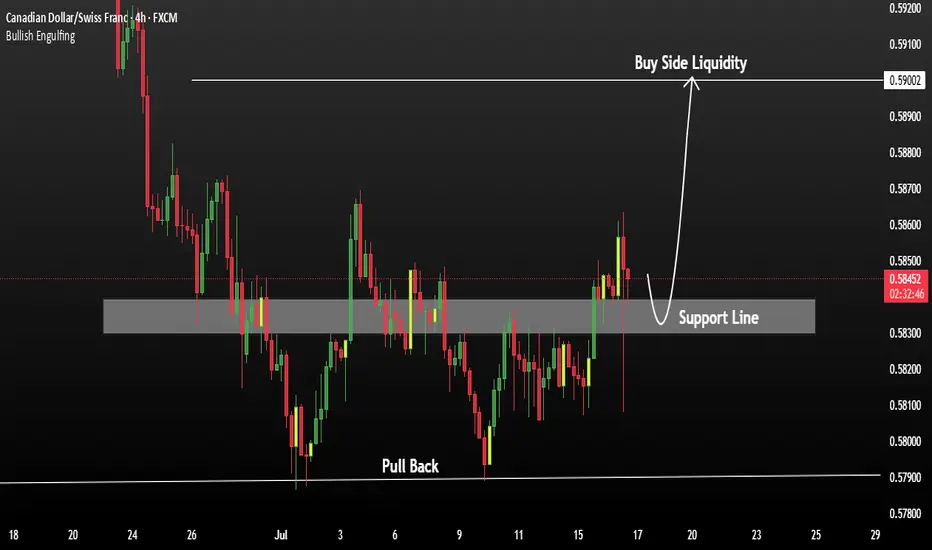
CADCHF Buying Opportunity after Strong Support CADCHF is currently respecting a strong support zone, indicating a potential bullish reversal pattern in development. The structure suggests that most of the downward pressure may be exhausted, and buyers could begin to take control.
Price action shows signs of completing a doubt/uncertainty pattern, reinforcing the base formed at support. A strong resistance level lies near 0.59002. If the 4H candle closes above this level, it may confirm a breakout and open the door for further bullish momentum.
You May find more details in the chart.
Trade wisely best of Luck Buddies.
PS: Support with like and comments for better analysis.
Price action Cadchf price fails to make lower low shows signs of change in character currently aiming for higher prices

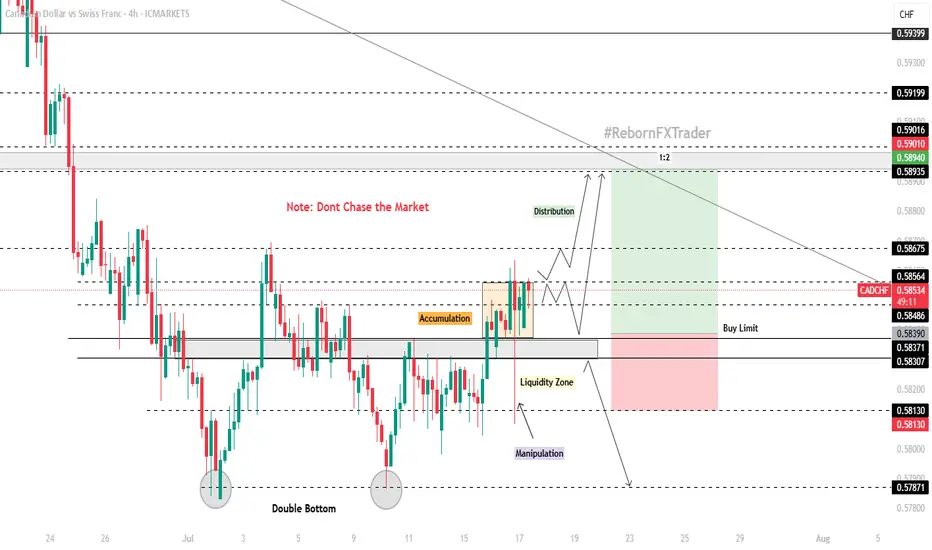
CAD/CHF 4H Technical and Fundamental AnalysisCAD/CHF 4H Technical and Fundamental Analysis
CAD/CHF has shown bullish potential this week, supported by strengthening fundamentals and a technical breakout. From a macro perspective, the Canadian dollar (CAD) continues to benefit from rising crude oil prices, a key Canadian export. With WTI crude trading above $80 per barrel, the commodity-backed CAD gains further momentum. Meanwhile, the Swiss franc (CHF)—often viewed as a safe haven—is seeing mild outflows as risk appetite improves globally and capital shifts toward higher-yielding assets.
From a central bank standpoint, the Bank of Canada (BoC) has struck a cautiously optimistic tone regarding inflation, while the Swiss National Bank (SNB) has already begun cutting interest rates—creating a divergent policy path that favors CAD strength against CHF.
On the technical side, CAD/CHF recently found strong support in the 0.57800–0.58100 zone, where price formed a potential double bottom pattern just below key resistance—a signal often associated with bullish reversal. A minor key level at 0.58300 was broken, followed by a clear accumulation phase. After consolidation, price grabbed liquidity with a long wick but closed above the key level, forming a bullish engulfing candle, suggesting strong buying pressure.
We now await a retracement into our zone of interest to position long entries with favorable risk-reward.
📍 Buy Setup:
Entry: Buy Limit at 0.58390
Stop Loss: 0.58130 (below liquidity grab)
Take Profit: 0.58940 (next key resistance)
📌 Disclaimer:
This is not financial advice. Always wait for proper confirmation before executing trades. Manage risk wisely and trade what you see—not what you feel.