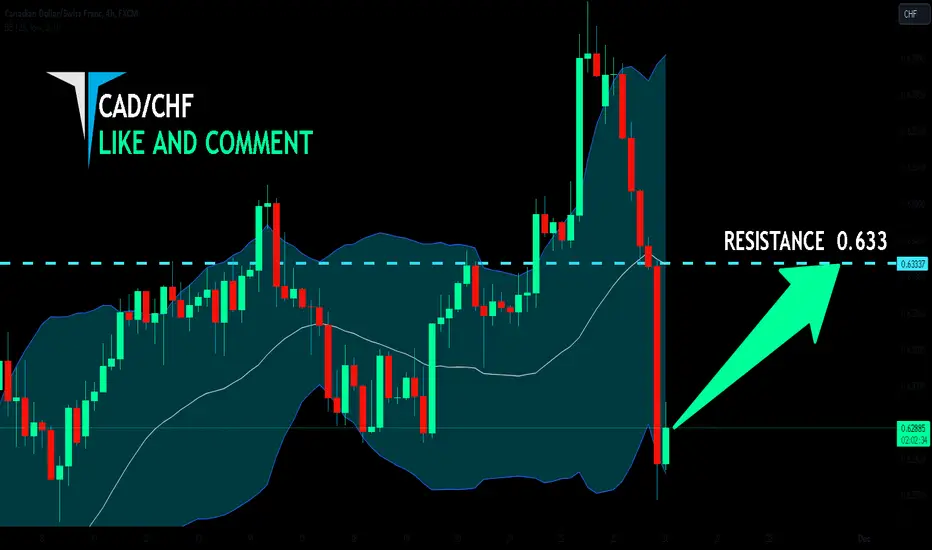
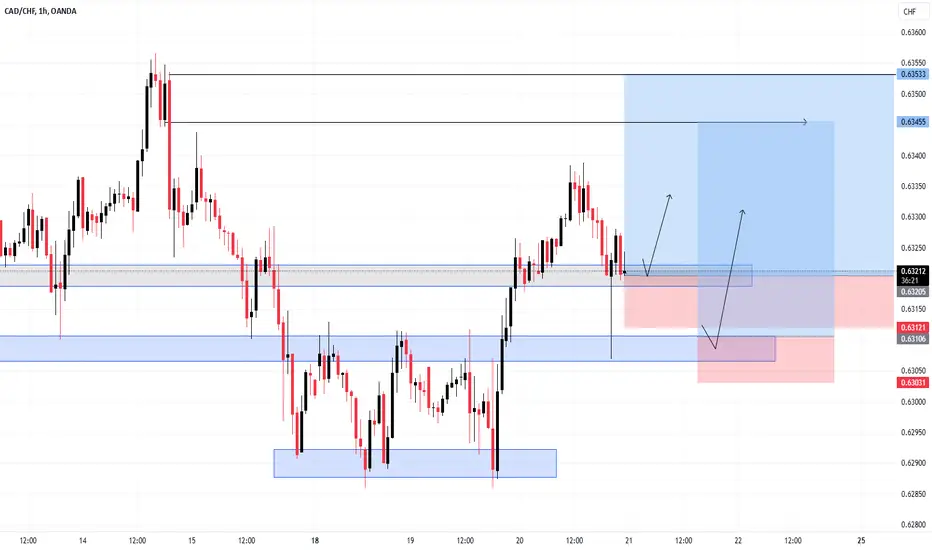
CAD/CHF BULLS WILL DOMINATE THE MARKET|LONG
Hello, Friends!
CAD/CHF pair is in the uptrend because previous week’s candle is green, while the price is evidently falling on the 4H timeframe. And after the retest of the support line below I believe we will see a move up towards the target above at 0.633 because the pair is oversold due to its proximity to the lower BB band and a bullish correction is likely.
✅LIKE AND COMMENT MY IDEAS✅
CHFCAD trade ideas
Ulta Bullish on the 4HR Time-FrameNot sure if it needs a lot of explanation as it is very clear.
The price should visit this strong resistance-turned-support line which coincides with a POI, Fib Golden Level and 20EMA.
A buy with a very good RR is likely to happen in the next hours.

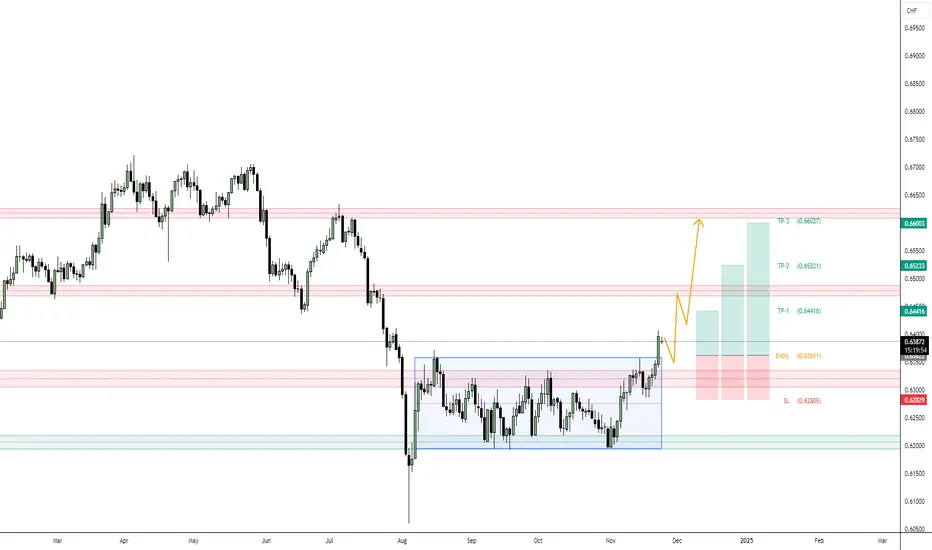
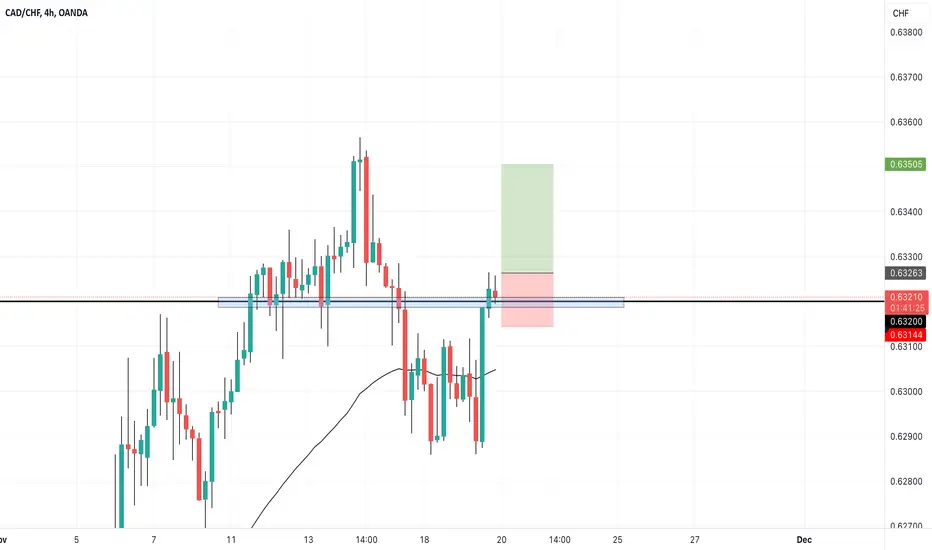
CAD/CHF Trade Setup: Breakout Retest with High R/R OpportunityThe CAD/CHF pair has displayed significant bullish momentum, successfully breaking out of a strong consolidation zone that has persisted since August. This consolidation pattern resembled a rectangle, providing a clear range for price action. The breakout above this range indicates a potential shift in market sentiment, favoring buyers.
Key Technical Observations
Breakout Confirmation:
The price has decisively closed above the upper boundary of the rectangle, confirming a breakout. This breakout signals increased buying interest and opens the path for further upside potential.
Support and Fibonacci Confluence:
The previous resistance zone of the rectangle is now expected to act as a support area upon a retest. Notably, this area aligns with the 0.382 Fibonacci retracement level, further reinforcing its significance as a potential demand zone.
Bullish Continuation Bias:
The breakout aligns with broader market trends and technical indicators, suggesting a continuation of bullish momentum if the support area holds.
Trade Setup
The following trade setup is proposed for CAD/CHF based on the outlined technical framework:
Entry Zone : Near 0.63600 (retest of the previous resistance-turned-support).
Stop Loss: Near 0.62800 (below the support zone to account for volatility).
Take Profit Levels:
TP1: 0.64400 (initial profit target near minor resistance).
TP2: 0.65200 (mid-term target in line with historical levels).
TP3: 0.66000 (extended target, capturing the broader bullish potential).
Risk-Reward Assessment
This setup offers an attractive risk-to-reward ratio with a controlled downside (80 pips) and substantial upside potential at each target:
TP1: +80 pips (1:1 R/R).
TP2: +160 pips (1:2 R/R).
TP3: +240 pips (1:3 R/R).
Market Conditions to Monitor
Retest Validation: Ensure the price action confirms support near 0.63600, such as a bullish reversal candlestick or increased volume.
Fundamental Events: Monitor economic data releases and geopolitical developments affecting CAD or CHF to avoid unexpected volatility.
Momentum Indicators: RSI and MACD should sustain bullish trends, supporting the continuation of upward momentum.
Conclusion
The CAD/CHF pair presents a high-probability trading opportunity following its breakout from a well-defined consolidation zone. A retest of the newly established support area near 0.63600 offers an ideal entry point. Traders are advised to remain vigilant and adhere to the defined risk management parameters to maximize potential returns while minimizing exposure.
This report is for informational purposes and does not constitute financial advice. Always conduct your due diligence before entering any trade.
BUY CADCHF - Price Action Entry Revealed!!!Trader Tom, a technical analyst with over 15 years’ experience, explains his trade idea using price action and a top down approach. This is one of many trades so if you would like to see more then please follow us and hit the boost button.
We are proud to be an OFFICIAL Trading View partner so please support the channel by using the link below and unleash the power of trading view today!
tradingview.sweetlogin.com

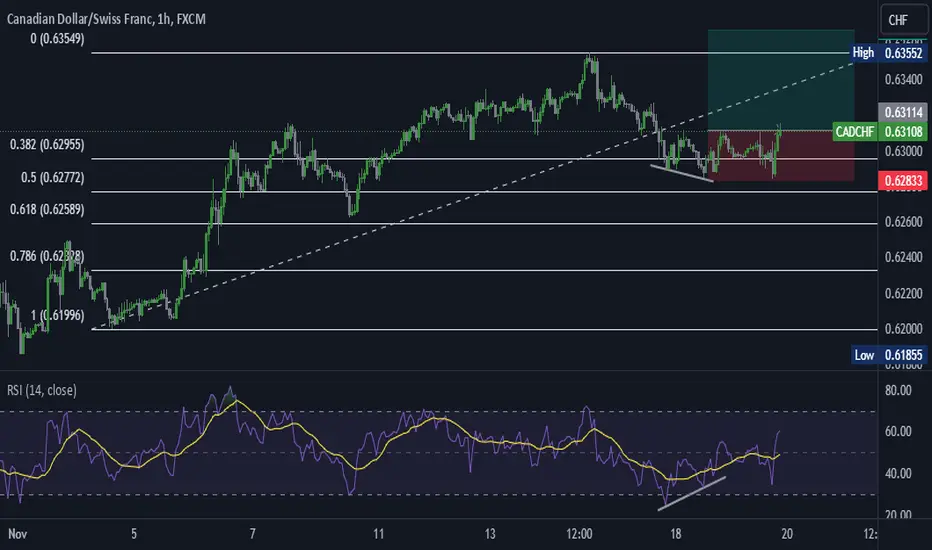
CADCHFafter a huge spike in an uptrend in 1hr time frame, I am setting up a buy order at the resistance level, going for a tp2

CADCHF POTENTIAL LONG/BUY SWING TRADE OPPORTUNITYHey everyone! Hope you are having an amazing weekend so far and an amazing Sunday! Just wanted to come on here and make a video post breaking down a potential long/buy opportunity I see on the Canadian Dollar (CAD) vs the Swiss Franc (CHF). Hope you guys enjoy and please boost this post and follow my page for more setups and analysis!
Cheers!

CADCHF - Long after filling the imbalance !!Hello traders!
‼️ This is my perspective on CADCHF.
Technical analysis: Here we are in a bullish market structure from 4H timeframe perspective, so I look for a long. I want price to continue the retracement to fill the that huge imbalance and then to reject from bullish OB.
Like, comment and subscribe to be in touch with my content!

Buy Idea on CAD/CHFThe CAD/CHF pair, on the 4-hour timeframe, has shown signs of bullish momentum after bouncing off the key support level at 0.6500. The formation of bullish candles and potential divergence in the RSI indicator suggest the possibility of upward movement toward higher resistance levels.
🔹 Technical Analysis:
The 0.63333 level has acted as a critical support zone.
The 50-period moving average (MA50) on the 4-hour chart may act as dynamic support.
🔹 Proposed Buy Strategy:
🔹 Key Notes:
Maintain proper risk management with a risk-to-reward ratio of at least 1:2.
Monitor economic news related to CAD and CHF, as it could significantly impact this pair.
This idea is for educational purposes only, and trading decisions are the responsibility of the trader.

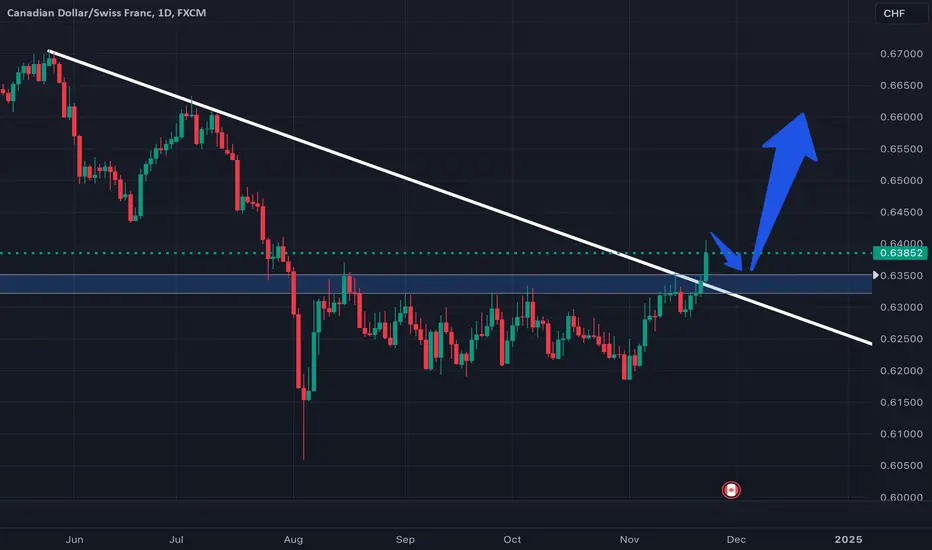
Potential Long Opportunity on CADCHFSome confluences I think will cause this pair to go long:
- Valid trend line broken on Daily Time frame.
- Price couldn't make a lower low on Daily
What do you think?
CADCHF: Support at 0.382 Fib Level with Bullish DivergenceCADCHF has found support at the 0.382 Fibonacci retracement level and is forming a bullish divergence. This technical setup indicates potential upward momentum.
CADCHFit's been on a strong uptrend for a while and is now consolidating at a spike peak giving a v-formation. i am speculating another jump from here

cadchfhi Traders, Market structure of cadchf is more likely to have a retracement on a higher tf, like daily and 4 hour TF, however, price may take supply area if you want to go short, and wait till price hits the below liquidity

CAD/CHFhello traders, the condition of the market is very interesting and beautiful, the market is in a rejection state and it looks very clean, we can wait a little and get confirmation and try to buy from the specified zones

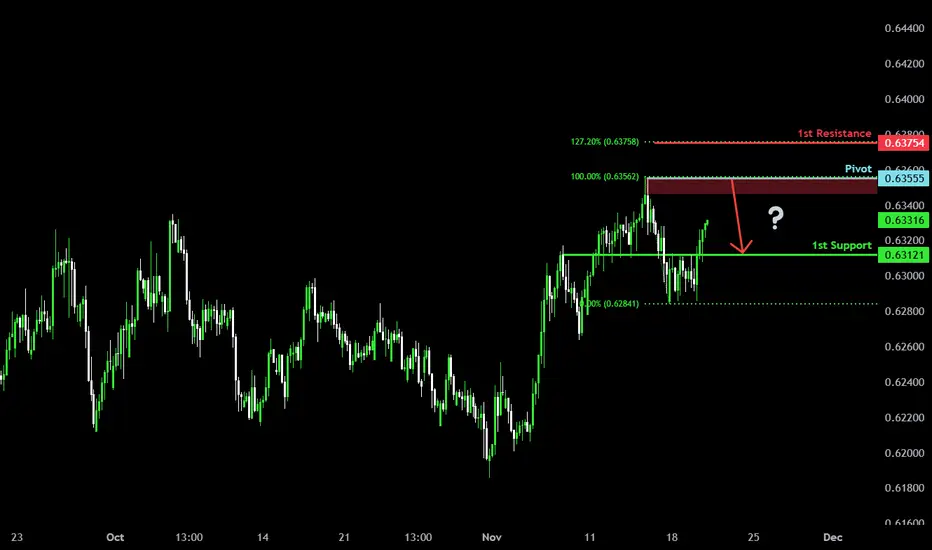
Could the price reverse from here?CAD/CHF is rising towards the pivot which is a pullback resistance and a reversal from this level could indicate a double top pattern which might lead to a potential price drop to the 1st support.
Pivot: 0.63555
1st Support: 0.63121
1st Resistance: 0.63754
Risk Warning:
Trading Forex and CFDs carries a high level of risk to your capital and you should only trade with money you can afford to lose. Trading Forex and CFDs may not be suitable for all investors, so please ensure that you fully understand the risks involved and seek independent advice if necessary.
Disclaimer:
The above opinions given constitute general market commentary, and do not constitute the opinion or advice of IC Markets or any form of personal or investment advice.
Any opinions, news, research, analyses, prices, other information, or links to third-party sites contained on this website are provided on an "as-is" basis, are intended only to be informative, is not an advice nor a recommendation, nor research, or a record of our trading prices, or an offer of, or solicitation for a transaction in any financial instrument and thus should not be treated as such. The information provided does not involve any specific investment objectives, financial situation and needs of any specific person who may receive it. Please be aware, that past performance is not a reliable indicator of future performance and/or results. Past Performance or Forward-looking scenarios based upon the reasonable beliefs of the third-party provider are not a guarantee of future performance. Actual results may differ materially from those anticipated in forward-looking or past performance statements. IC Markets makes no representation or warranty and assumes no liability as to the accuracy or completeness of the information provided, nor any loss arising from any investment based on a recommendation, forecast or any information supplied by any third-party.
CADCHF buyprice stayed under the strong level
higher high is made after bullish impulse
so continuation is expecting

CADCHF Pontential buy If price manages to close above resistance on the smaller timeframe we have a clean buy set up. This has potential to become a swing trade
CADCHF: Rejection at Key ResistanceCADCHF faced a strong rejection at a key resistance level, indicating potential downward movement.

CADCHF, Head and Shoulder at Resistance ZoneRejected from Resistance
Head and Shoulder Formation
Bearish Divergence
Right Shoulder Formation
Entry on break of neckline
Sl above right shoulder
Tp towards 1:1

CADCHF: Bull Trap & Confirmed Bearish Movement 🇨🇦🇨🇭
CADCHF looks bearish after a false violation of a key horizontal
daily resistance.
The price formed a strong bearish imbalance
and violated multiple intraday supports.
I think that the pair will reach 0.6276 support soon.
❤️Please, support my work with like, thank you!❤️

CADCHFThis pair has been doing a lot of side way moves, but I think as in 15 min time frame it looks uptrend, I am putting a long position here for another spike from this point
CADCHF Massive Short! SELL!
My dear subscribers,
CADCHF looks like it will make a good move, and here are the details:
The market is trading on 0.6349 pivot level.
Bias - Bearish
My Stop Loss - 0.6373
Technical Indicators: Both Super Trend & Pivot HL indicate a highly probable Bearish continuation.
Target - 0.6302
About Used Indicators:
The average true range (ATR) plays an important role in 'Supertrend' as the indicator uses ATR to calculate its value. The ATR indicator signals the degree of price volatility.
———————————
WISH YOU ALL LUCK

CADCHFWe can attempt to buy CADCHF from specified level as it make HL , also 0.618 FIB level occur indicate that it moves upward.
SL , TP mention in chart.
