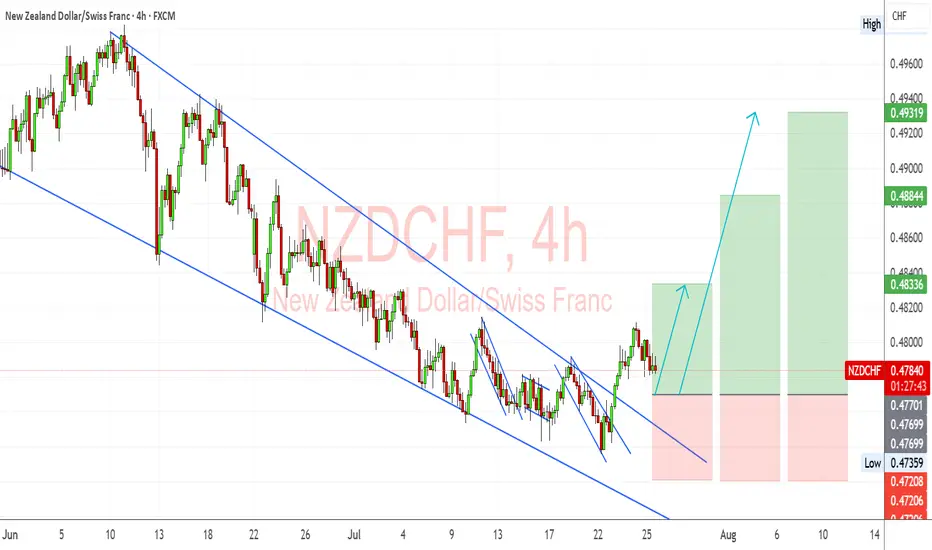
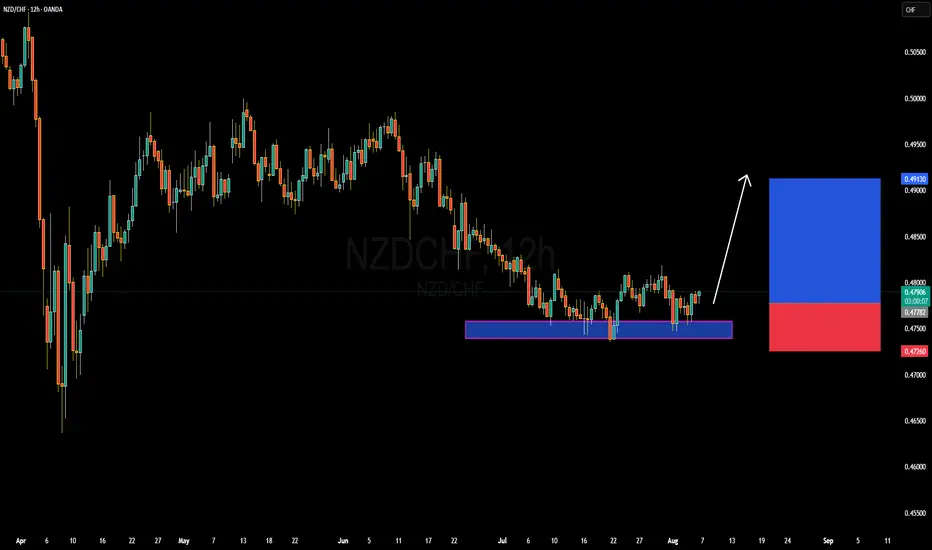
NZDCHF – Bullish Breakout Sets Stage for ReversalNZDCHF has broken decisively out of a long-term descending channel, signaling a potential trend reversal. Price action confirmed multiple bullish flags within the falling structure, followed by a clean breakout and higher low retest, supporting a bullish continuation bias.
Currently, the pair is stabilizing just above prior resistance turned support around 0.4760–0.4780, forming a potential launchpad for the next leg higher.
Upside Targets:
TP1: 0.48336
TP2: 0.48844
TP3: 0.49319
Invalidation Zone:
A drop below 0.4720 would invalidate the breakout structure and expose the downside.
Fundamental Drivers:
🇳🇿 NZD Strength: RBNZ remains relatively hawkish compared to other central banks, and the Kiwi may gain from improving risk sentiment and easing global recession fears.
🇨🇭 CHF Weakness: Swiss Franc is under mild pressure as safe-haven flows weaken amid improving tone on US-China-EU trade headlines and fading ECB rate cut bets.
🗓️ Macro Flow: Upcoming risk events (Fed comments, trade updates, and NZ economic prints) could inject momentum into the pair, especially if risk appetite improves.
Bias: ✅ Bullish (Buy)
Confidence: ★★★★☆
Watch for: Clean hold above 0.4770 zone + bullish momentum continuation.
CHFNZD trade ideas
NZDCHF Remains Heavily Influenced By The SNBNZDCHF Remains Heavily Influenced By The SNB
NZDCHF remains heavily influenced by the Swiss National Bank (SNB), which continues to control the value of several currencies.
Despite this, NZDCHF looks significantly oversold. All it may need is time before a bullish wave begins to unfold.
Meanwhile, the U.S. will increase tariffs on New Zealand products from 10% to 15% starting August 7.
At the same time, the U.S. has slapped a hefty 39% tariff on Swiss goods.
Considering this angle—especially since it’s been a hot topic lately—NZD seems to have a stronger position than CHF.
Let’s see how price action develops through this storm.
You may find more details in the chart!
Thank you and Good Luck!
PS: Please support with a like or comment if you find this analysis useful for your trading day
Disclosure: I am part of Trade Nation's Influencer program and receive a monthly fee for using their TradingView charts in my analysis.

NZDCHF: Bearish Continuation from Re-Delivered Re-Balanced ArrayGreetings Traders,
In today’s analysis of NZDCHF, recent price action confirms the presence of bearish institutional order flow. As a result, we aim to align ourselves with this directional bias by identifying strategic selling opportunities.
Key Observations on H4:
Bearish Market Structure Shift: The H4 timeframe has recently confirmed a bearish shift in market structure, providing us with a clear framework to seek short setups in line with institutional momentum.
RDRB Resistance Zone: Price has retraced into a Re-Delivered Re-Balanced (RDRB) array—an area where prior institutional selling took place and has now been re-engaged. This region is expected to serve as resistance, offering a high-probability zone for confirmation entries to the downside.
Trading Plan:
Entry Strategy: Monitor lower timeframes (M15 and below) for bearish confirmation setups within the RDRB array.
Target Objective: The current draw on liquidity remains the liquidity pool residing at deeper discount levels, which aligns with our short bias.
For a detailed market walkthrough and in-depth execution zones, be sure to watch this week’s Forex Market Breakdown:
As always, stay disciplined, wait for clear confirmations, and manage your risk responsibly.
Kind regards,
The Architect 🏛️📉

NZD-CHF Risky Long! Buy!
Hello,Traders!
NZD-CHF keeps falling and
Will hit the horizontal support
Of 0.4738 on Monday from
Where we will be expecting
A local rebound and a
Bullish move up
Buy!
Comment and subscribe to help us grow!
Check out other forecasts below too!
Disclosure: I am part of Trade Nation's Influencer program and receive a monthly fee for using their TradingView charts in my analysis.

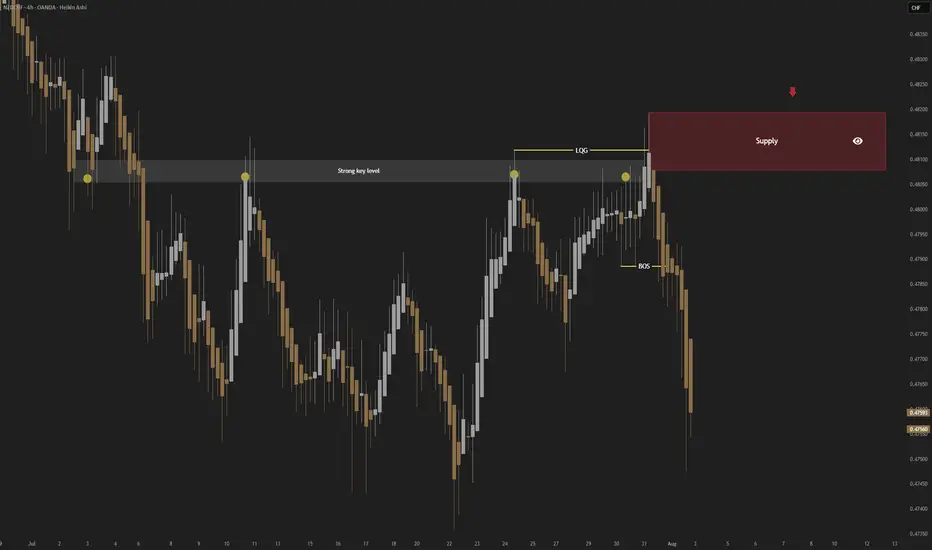
NZDCHF: Selling Within Bearish Order Flow & Order BlockGreetings Traders,
In today’s analysis of NZDCHF, recent price action confirms the presence of bearish institutional order flow. As a result, we aim to align ourselves with this directional bias by identifying strategic selling opportunities.
🔍 Key Observations on H4:
Bearish Market Structure Shift
The H4 timeframe has confirmed a bearish shift in market structure, giving us a solid framework to seek short setups aligned with institutional momentum.
Bearish Order Block
Price has recently reached a bearish order block, expected to act as a strong resistance zone for potential downside continuation.
Liquidity Engineering
Buy stops on H4 have been taken out—this sweep may be used to order the pair against liquidity, favoring bearish continuation.
📈 Trading Plan:
Entry Strategy
Monitor lower timeframes (e.g., M15 and below) for bearish confirmation setups within or near the bearish order block.
Target Objective
Our draw on liquidity remains the liquidity pool located at deeper discount levels, in alignment with the prevailing short bias.
For a detailed market walkthrough and in-depth execution zones, be sure to watch this week’s Forex Market Breakdown:
Stay disciplined, trust your confirmations, and manage your risk wisely.
Kind regards,
The Architect 🏛️📉

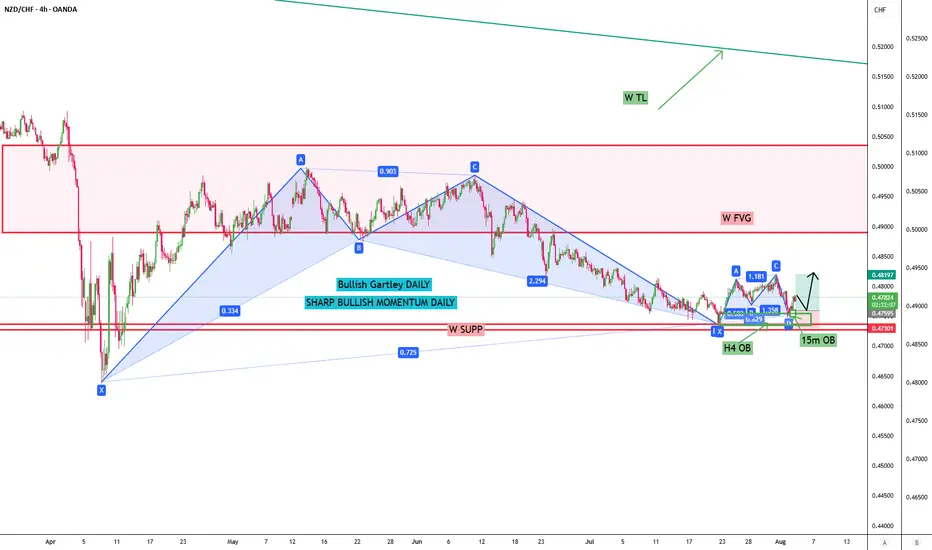
NZDCHF POTENTIAL BULLISHWeekly chart shows NZDCHF has bounced off its minimum since 2004, with RSI showing just recovering from the OS area. Price has bounced back from the weekly resistance around 0.47400. This bounce has formed a bullish Gartley on the daily chart and another bullish Gartley on the H4 timeframe. It was supported by an OB on H4 and in micro scale engulfing candles.
I expect that the 20 MA will reject the price on H4 BB since multiple bearish candles passed the lower band.
Would consider the entry where the 15m OB was touched by a rejected wick around 0.47600. TPs may be around points A and C on the Gartley pattern, and SL below the X point.
Let's see how it goes, and fingers crossed, the pending gets activated.
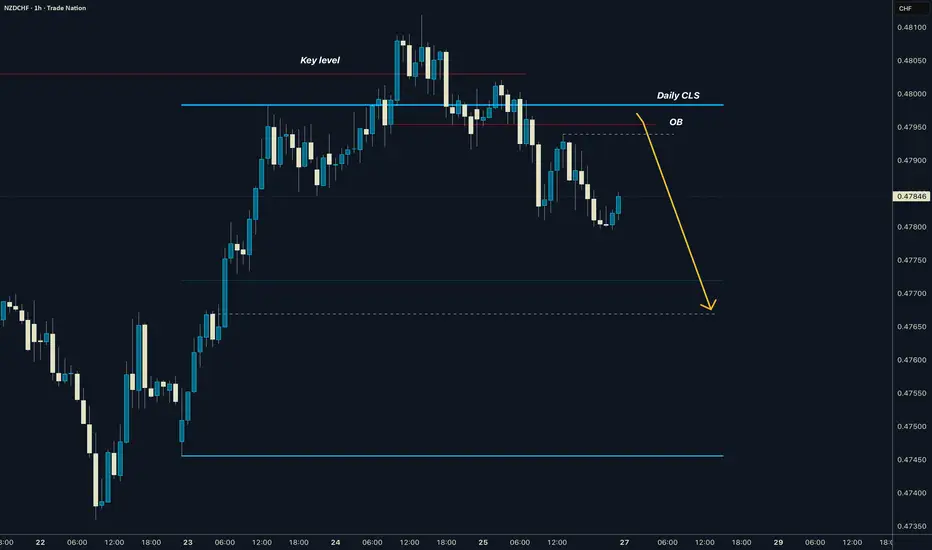
NZDCHF I Daily CLS I Model 1 I Pullback entryYo Market Warriors ⚔️
Fresh Crypto Analysis— if you’ve been riding with me, you already know:
🎯My system is 100% mechanical. No emotions. No trend lines. No subjective guessing. Working all timeframes. Just precision, structure, and sniper entries.
🧠 What’s CLS?
It’s the real smart money. The invisible hand behind $7T/day — banks, algos, central players.
📍Model 1:
HTF bias based on the daily and weekly candles closes,
Wait for CLS candle to be created and manipulated. Switch to correct LTF and spot CIOD. Enter and target 50% of the CLS candle.
For high probability include Dealing Ranges, Weekly Profiles and CLS Timing.
Analysis done on the Tradenation Charts
Disclosure: I am part of Trade Nation's Influencer program and receive a monthly fee for using their TradingView charts in my analysis.
Trading is like a sport. If you consistently practice you can learn it.
“Adapt what is useful. Reject whats useless and add whats is specifically yours.”
David Perk aka Dave FX Hunter
💬 Comment any Coin I ll give you my quick view
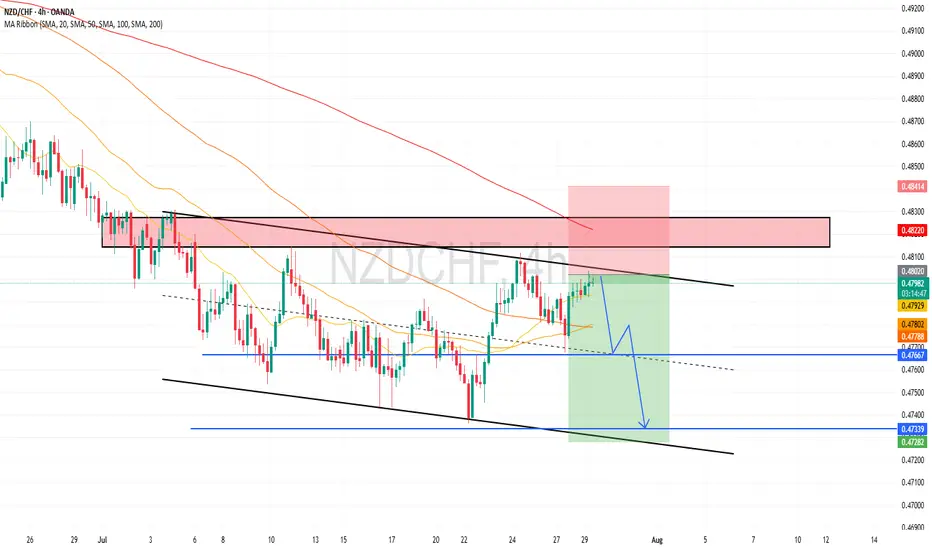
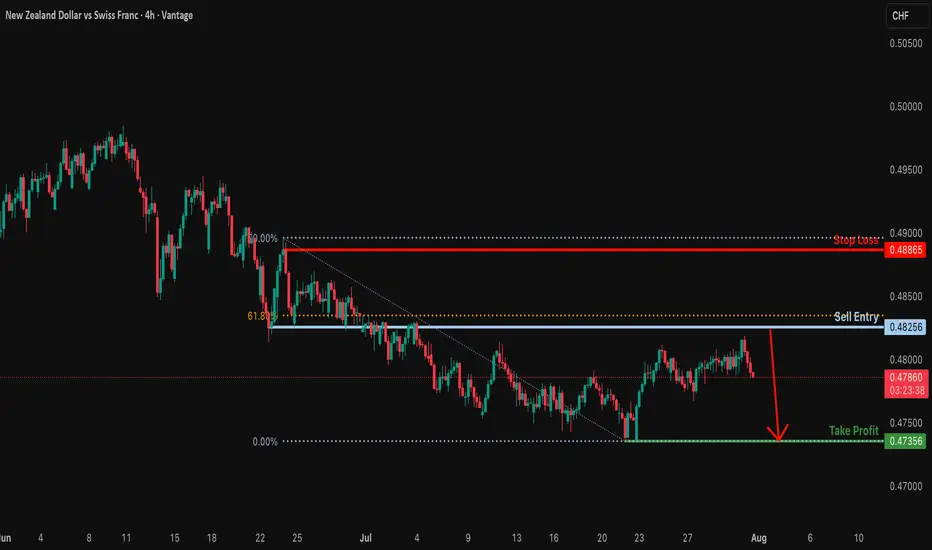
Bearish drop?The NZD/CHF is rising towards the resistance level, which is a pullback resistance that is slightly below the 61.8% Fibonacci retracement. It could drop from this level to our take-profit.
Entry: 0.48256
Why we like it:
There is a pullback resistance that is slightly below the 61.8% Fibonacci retracement.
Stop loss: 0.48865
Why we like it:
There is a pullback resistance.
Take profit: 0.47356
Why we like it:
There is a swing low support.
Enjoying your TradingView experience? Review us!
Please be advised that the information presented on TradingView is provided to Vantage (‘Vantage Global Limited’, ‘we’) by a third-party provider (‘Everest Fortune Group’). Please be reminded that you are solely responsible for the trading decisions on your account. There is a very high degree of risk involved in trading. Any information and/or content is intended entirely for research, educational and informational purposes only and does not constitute investment or consultation advice or investment strategy. The information is not tailored to the investment needs of any specific person and therefore does not involve a consideration of any of the investment objectives, financial situation or needs of any viewer that may receive it. Kindly also note that past performance is not a reliable indicator of future results. Actual results may differ materially from those anticipated in forward-looking or past performance statements. We assume no liability as to the accuracy or completeness of any of the information and/or content provided herein and the Company cannot be held responsible for any omission, mistake nor for any loss or damage including without limitation to any loss of profit which may arise from reliance on any information supplied by Everest Fortune Group.
Bullish bounce?NZD/CHF is reacting off the pivot, which is a pullback support and could rise to the 1st resistance.
Pivot: 0.47867
1st Support: 0.47391
1st Resistance: 0.48695
Risk Warning:
Trading Forex and CFDs carries a high level of risk to your capital and you should only trade with money you can afford to lose. Trading Forex and CFDs may not be suitable for all investors, so please ensure that you fully understand the risks involved and seek independent advice if necessary.
Disclaimer:
The above opinions given constitute general market commentary, and do not constitute the opinion or advice of IC Markets or any form of personal or investment advice.
Any opinions, news, research, analyses, prices, other information, or links to third-party sites contained on this website are provided on an "as-is" basis, are intended only to be informative, is not an advice nor a recommendation, nor research, or a record of our trading prices, or an offer of, or solicitation for a transaction in any financial instrument and thus should not be treated as such. The information provided does not involve any specific investment objectives, financial situation and needs of any specific person who may receive it. Please be aware, that past performance is not a reliable indicator of future performance and/or results. Past Performance or Forward-looking scenarios based upon the reasonable beliefs of the third-party provider are not a guarantee of future performance. Actual results may differ materially from those anticipated in forward-looking or past performance statements. IC Markets makes no representation or warranty and assumes no liability as to the accuracy or completeness of the information provided, nor any loss arising from any investment based on a recommendation, forecast or any information supplied by any third-party.

NZDCHF is in the Bearish Side due to Bearish TrendHello Traders
In This Chart NZDCHF HOURLY Forex Forecast By FOREX PLANET
today NZDCHF analysis 👆
🟢This Chart includes_ (NZDCHF market update)
🟢What is The Next Opportunity on NZDCHF Market
🟢how to Enter to the Valid Entry With Assurance Profit
This CHART is For Trader's that Want to Improve Their Technical Analysis Skills and Their Trading By Understanding How To Analyze The Market Using Multiple Timeframes and Understanding The Bigger Picture on the Chart
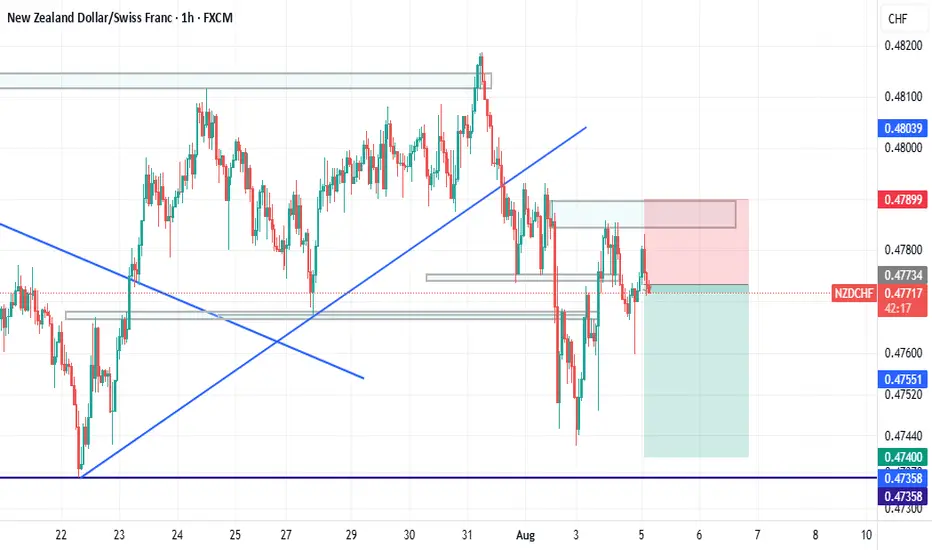
NZDCHF - Can we make it back to previous highs?NZDCHF has been shaping up for the next price movement as bulls strongly rejected any further downside and created a strong reversal impulse which should gain some momentum.
Good Luck

NZDCHF BUYSPrice was in a long downtrend, but sellers eventually lost strength. After a sharp selloff, the market began moving sideways — showing signs that larger players were quietly building positions while keeping price in a range.
Price then dipped below the range and quickly reversed, followed by strong buying that broke previous highs and shifted the overall structure from bearish to bullish. If that same buying pressure returns, we could see a continuation of the upward move as momentum builds.
Entry: 0.47629
Take Profit: 0.48139
Stop Loss: 0.47490
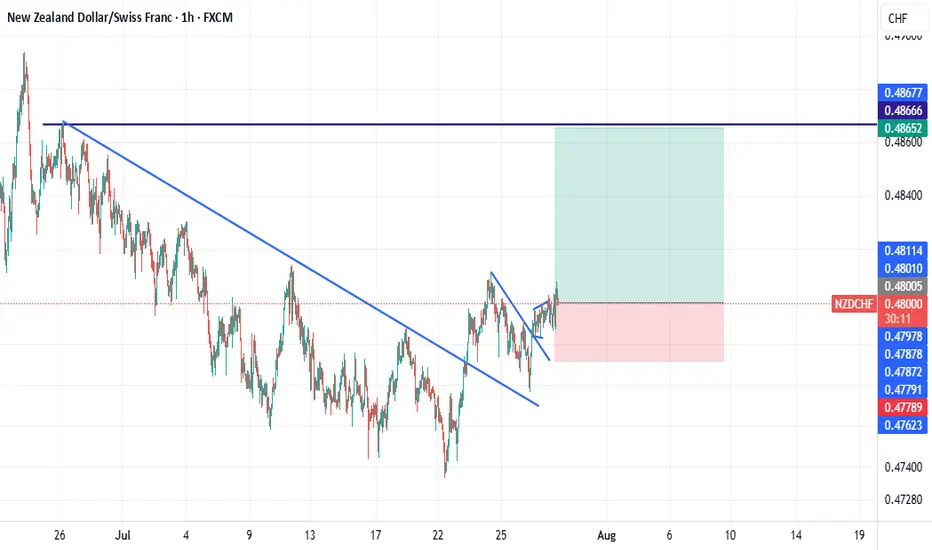
NZD-CHF Local Bearish Bias! Sell!
Hello,Traders!
NZD-CHF made a retest of
The horizontal resistance
of 0.4810 so we are locally
Bearish biased and we
Will be expecting a
Further bearish move down
Sell!
Comment and subscribe to help us grow!
Check out other forecasts below too!
Disclosure: I am part of Trade Nation's Influencer program and receive a monthly fee for using their TradingView charts in my analysis.
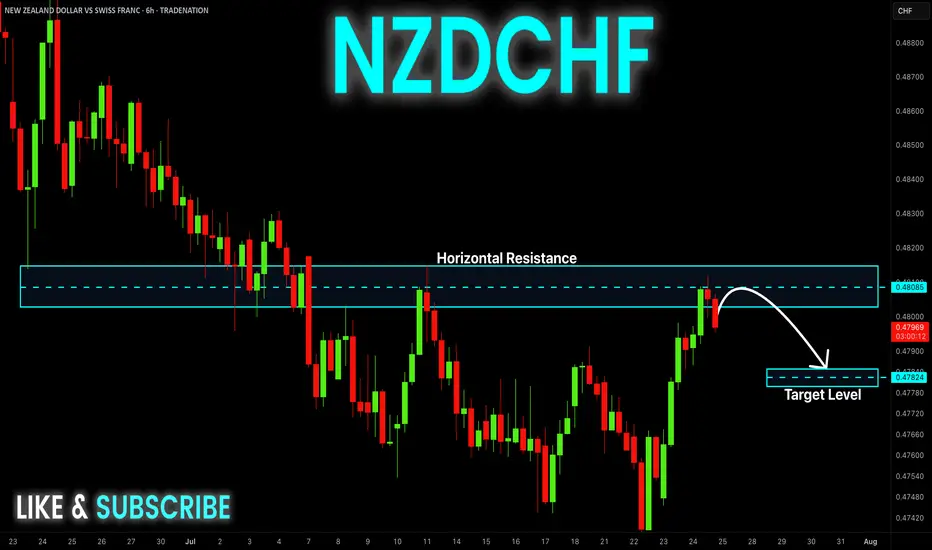
NZD/CHF BEST PLACE TO SELL FROM|SHORT
NZD/CHF SIGNAL
Trade Direction: short
Entry Level: 0.479
Target Level: 0.477
Stop Loss: 0.481
RISK PROFILE
Risk level: medium
Suggested risk: 1%
Timeframe: 6h
Disclosure: I am part of Trade Nation's Influencer program and receive a monthly fee for using their TradingView charts in my analysis.
✅LIKE AND COMMENT MY IDEAS✅

NZDCHF Forming Bullish ContinuationNZDCHF has been consolidating above a well-defined support zone near the 0.4720–0.4750 region, as seen clearly on the 12H chart. Price has reacted multiple times to this demand area, forming a potential accumulation base. Recent candlestick structure is signaling rejection of lower prices, with buyers stepping in and building pressure for a potential breakout to the upside.
From a macro perspective, the New Zealand dollar is showing signs of resilience despite softening economic data, while the Swiss franc remains fundamentally strong due to its safe-haven status. However, as risk sentiment improves globally and commodity currencies gain traction, NZD is finding support. The Reserve Bank of New Zealand is expected to maintain a cautious but neutral stance in upcoming meetings, while the Swiss National Bank has surprised markets recently by signaling a more dovish outlook, which could weigh on CHF in the short term.
The chart setup provides a clean risk-to-reward ratio with a tight invalidation below the demand zone. If price sustains above 0.4780, a breakout toward 0.4910–0.4950 is on the table, offering a high-probability bullish continuation setup. The market structure shift with higher lows and rejection wicks is giving early signs of reversal momentum. This makes NZDCHF a compelling candidate for buyers looking to position ahead of a potential breakout.
In the current market environment, where central bank tone shifts and risk-on sentiment are reshaping currency flows, pairs like NZDCHF are key to watch. This setup is not only technically clean but also aligns with the broader narrative of CHF softening and NZD stabilization. Patience and confirmation will be critical, but this pair is shaping up to deliver a solid upside opportunity.
Behold the legendary NZD/CHF long setupBehold the legendary NZD/CHF long setup, powered by my top-secret pyramidal formula buried deep within the Great Pyramid’s King’s Chamber (and heavily guarded by irritable golden scarabs):
Kiwi Pharaoh’s Pivot Points
– We superimpose NZD/CHF swings onto the four hidden pyramid chambers. When price dips into the “Southern Antechamber Zone” (around 0.5800), it’s said an ancient ibis deity quacks—and that’s our buy trigger.
Helvetic Sphinx Sentiment
– We feed Swiss National Bank communiqués and Kiwi dairy export data through the Sphinx’s riddle-engine. If the riddle solves to “Lacto-strength,” pound the digital maize—time to go long.
Ra’s Wellington-Hour Candle Filter
– Only candles closing between 08:00–16:00 NZST (Auckland daylight hours) count as “true” sun-blessed Kiwi candles. Any moves outside NZ business hours? Treated as mirages in the desert—ignored.
Anubis’ Forex-Flow Veil
– We quantify interbank NZD/CHF flows in units of “pharaoh-ounces.” When daily turnover sails past 3,000 pharaoh-ounces, brace for a breakout ritual (aka a crisp rally).
Tomb-Run Trend Confirmation
– Trendlines aren’t drawn from mere swing points, but from the three sacred hieroglyphic glyphs etched into the sarcophagus walls. Connect them, and the “Tomb-Run Uptrend” emerges.

NZDCHF: Bullish Continuation is Highly Probable! Here is Why:
Remember that we can not, and should not impose our will on the market but rather listen to its whims and make profit by following it. And thus shall be done today on the NZDCHF pair which is likely to be pushed up by the bulls so we will buy!
Disclosure: I am part of Trade Nation's Influencer program and receive a monthly fee for using their TradingView charts in my analysis.
❤️ Please, support our work with like & comment! ❤️

short on nzdchfwe are in a downtrend and price pullback to a broken support and reach to a supply zone too...
NZDCHF; Heikin Ashi Trade Idea📈 Hey Traders!
Here’s a fresh outlook from my trading desk. If you’ve been following me for a while, you already know my approach:
🧩 I trade Supply & Demand zones using Heikin Ashi chart on the 4H timeframe.
🧠 I keep it mechanical and clean — no messy charts, no guessing games.
❌ No trendlines, no fixed sessions, no patterns, no indicator overload.
❌ No overanalyzing market structure or imbalances.
❌ No scalping, and no need to be glued to the screen.
✅ I trade exclusively with limit orders, so it’s more of a set-and-forget style.
✅ This means more freedom, less screen time, and a focus on quality setups.
✅ Just a simplified, structured plan and a calm mindset.
💬 Let’s Talk:
💡 Do you trade supply & demand too ?
💡What’s your go-to timeframe ?
💡Ever tried Heikin Ashi ?
📩 Got questions about my strategy or setup? Drop them below — ask me anything, I’m here to share.
Let’s grow together and keep it simple. 👊
NZDCHF Long Trade OANDA:NZDCHF Long Day Trade - Low Risk, with my back testing of this strategy, it hits multiple possible take profits, manage your position accordingly.
Note: Manage your risk yourself, its risky trade, see how much your can risk yourself on this trade.
Use proper risk management
Looks like good trade.
Lets monitor.
Use proper risk management.
Disclaimer: only idea, not advice

buy nzdchfbreak the trend line and pullback to the trendline and have a big green candle that shows the power of buyers after break trend line..
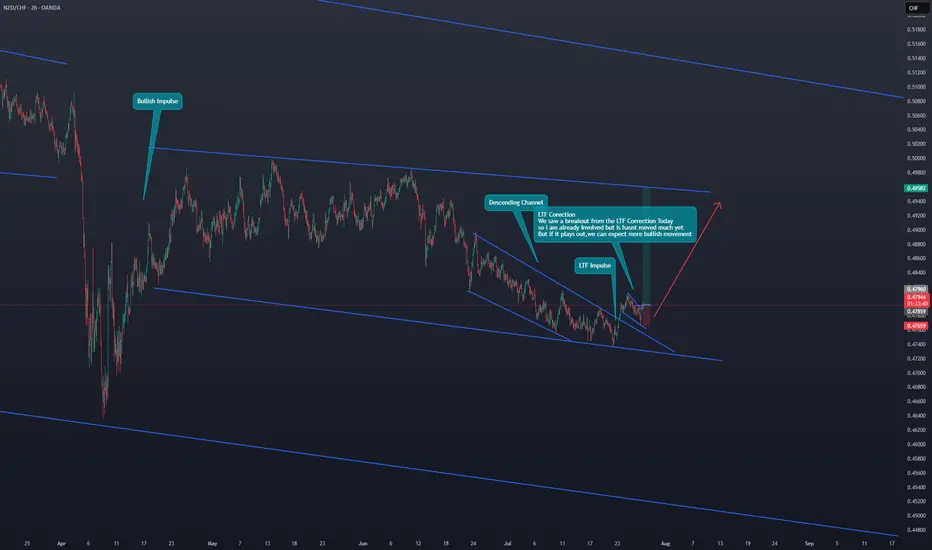
NZD/CHF Bullish move to expectWe saw a breakout from the LTF Correction Today
so i am already Involved but is hasnt moved much yet.
But if it plays out,we can expect more bullish movement
NZDCHF is in the Bearish Side due to Bearish TrendHello Traders
In This Chart NZDCHF HOURLY Forex Forecast By FOREX PLANET
today NZDCHF analysis 👆
🟢This Chart includes_ (NZDCHF market update)
🟢What is The Next Opportunity on NZDCHF Market
🟢how to Enter to the Valid Entry With Assurance Profit
This CHART is For Trader's that Want to Improve Their Technical Analysis Skills and Their Trading By Understanding How To Analyze The Market Using Multiple Timeframes and Understanding The Bigger Picture on the Chart