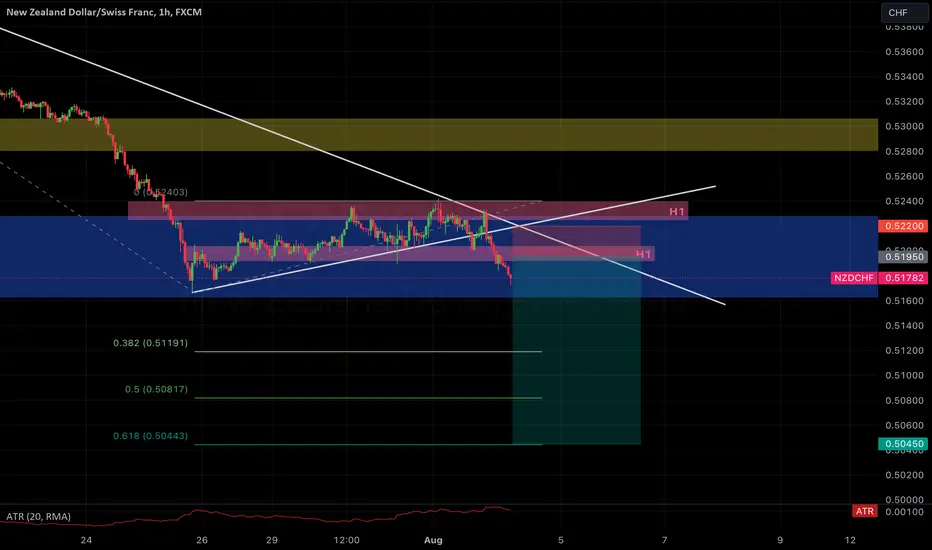
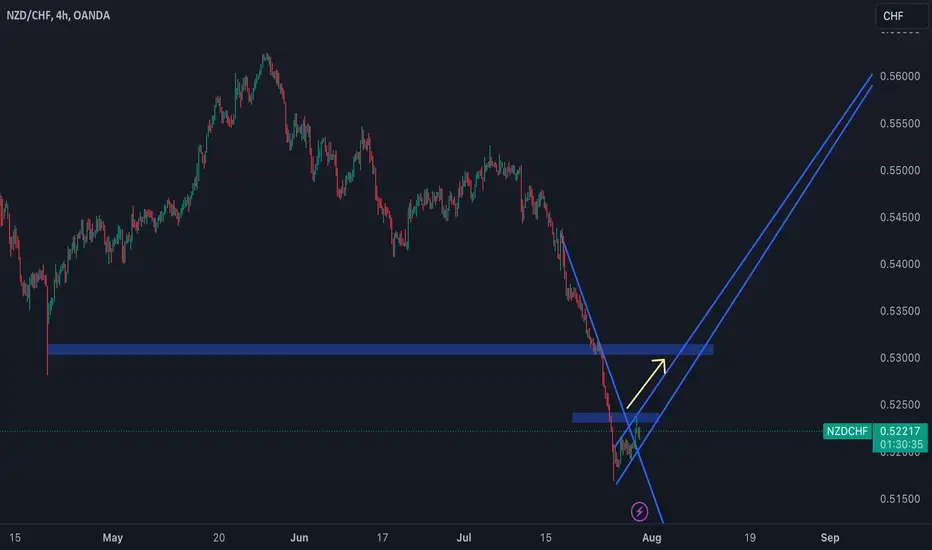
NZDCHF Flag down timeBias Bearish
Fundamental NZD is weak and CHF is holding strong
Price action
Price rejected from H4 Bearish TL and broke out of raising flag pattern. The price also break and close below H1 SR level. This indicates that bearish momentum is still going strong. All time low, so using Fibo Extension for targets.
Confluence
H4 Bearish TL, Broken Flag SR level and H1 SR level.
Setup
Entry at H1 broken SR level
SL 2x ATR(20)
TP fibo extension 61.8% R:R 1:6
CHFNZD trade ideas
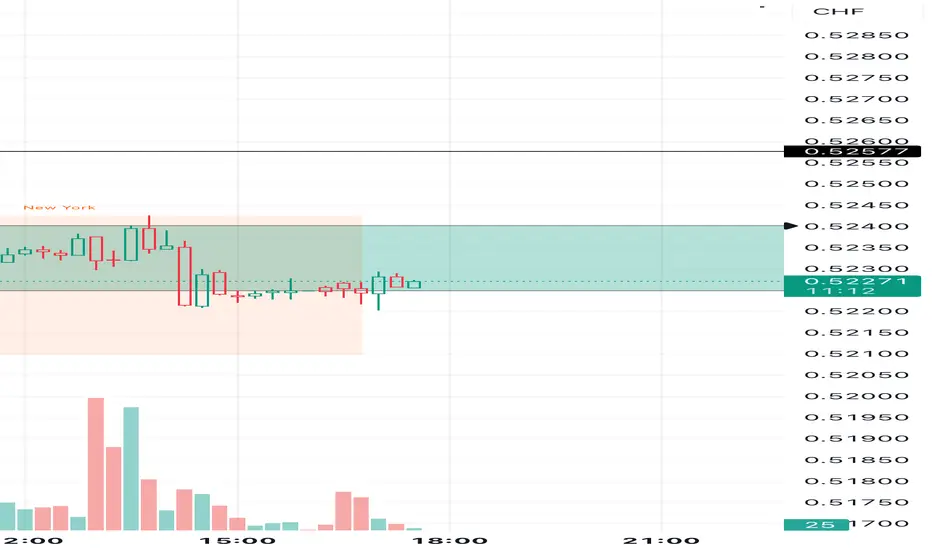
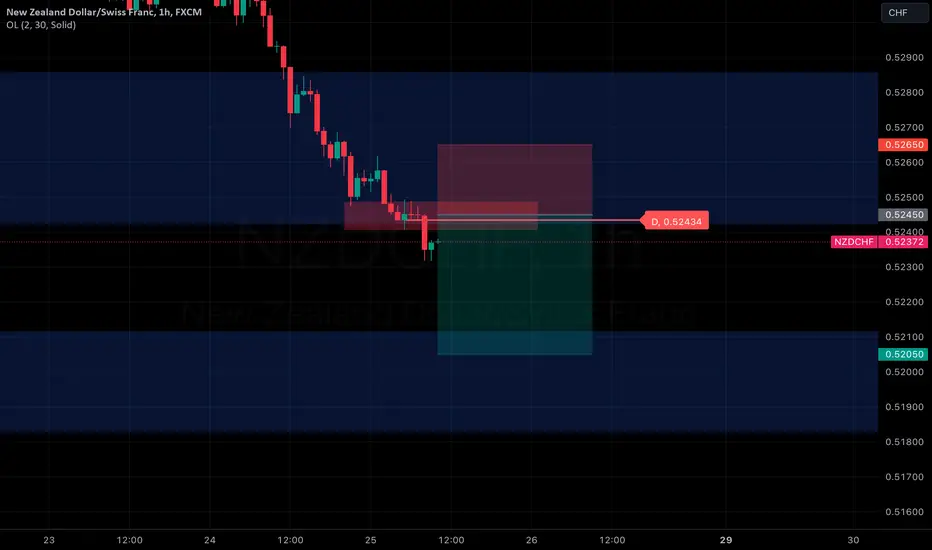
Let’s do some scalping!Looking to scalp 5 pips when price closes above my zone of .52402! I have quite a few trades today I’ll try and post em all. If momentum looks strong I’ll shoot for .52577 OANDA:NZDCHF
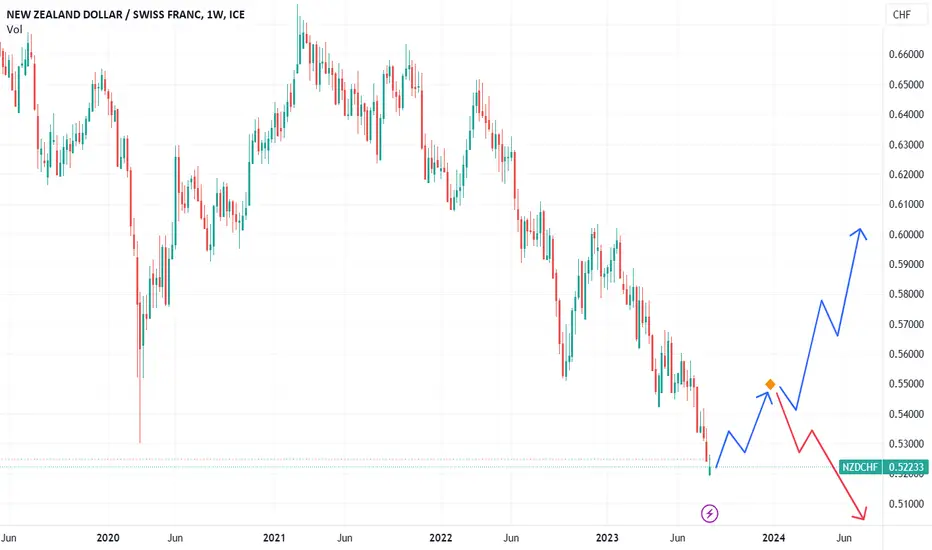
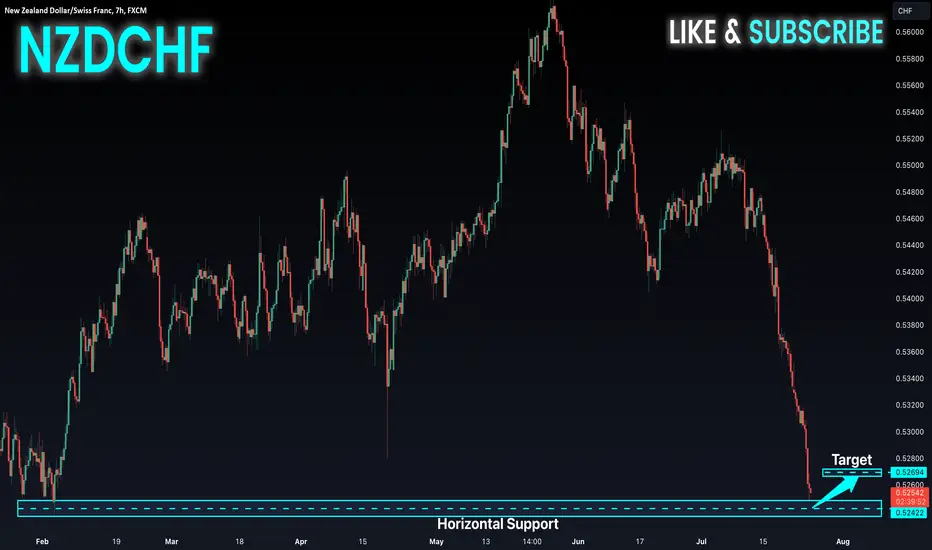
Can the Kiwi learn how to fly?The Kiwi Dollar has been very weak against the Swiss Franc for pretty much the entirety of 2023, with the last noteworthy bull run occurring last autumn. After this year's prolonged and massive bear run, the pair has finally reached its all-time lowest price. The current area around 0.52 seems to have potential as a good support price.
I feel a short-term bullish retracement might occur from this area, pushing price back up to around 0.55 area. From there, initial bias would be the continuation of the downtrend, but perhaps a risk-on bias will overtake the market, pushing price even higher.
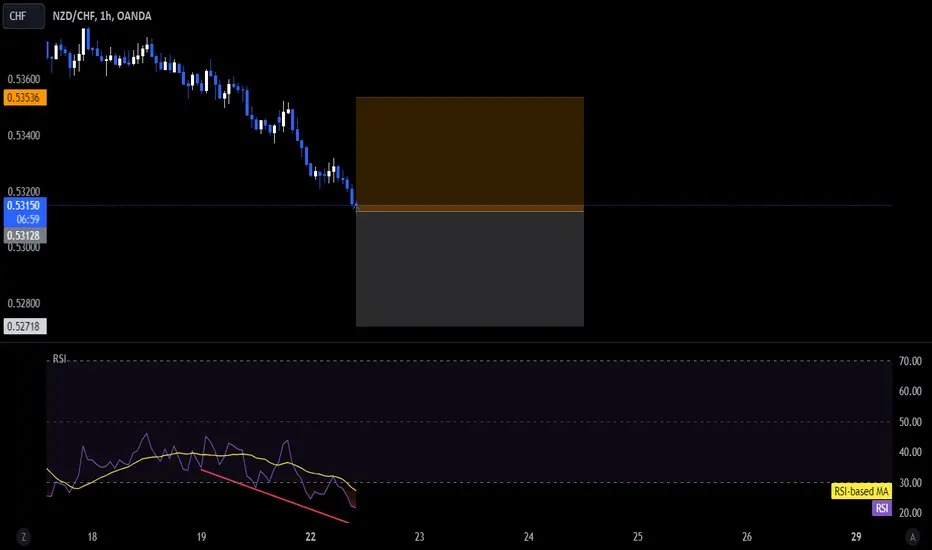
NZD / CHF !! recovering in a DOWN trend⭐️ Smart investment, Strong finance
⭐️ Personal comments NOVA:
Oversold signs - selling pressure gradually decreasing, expect a temporary recovery for NZD/CHF
⭐️ SET UP NZDCHF PRICE:
🔥BUY zone: 0.52200 - 0.52000 SL 0.51700
TP1: 0.52500
TP2: 0.52900
TP3: 0.53500
⭐️ Technical analysis:
Based on technical indicators EMA 34, EMA89 and support resistance areas to set up a reasonable BUY order.
⭐️ NOTE:
Note: Nova wishes traders to manage their capital well
- take the number of lots that match your capital
- Takeprofit equal to 4-6% of capital account
- Stoplose equal to 2-3% of capital account
- The winner is the one who sticks with the market the longest

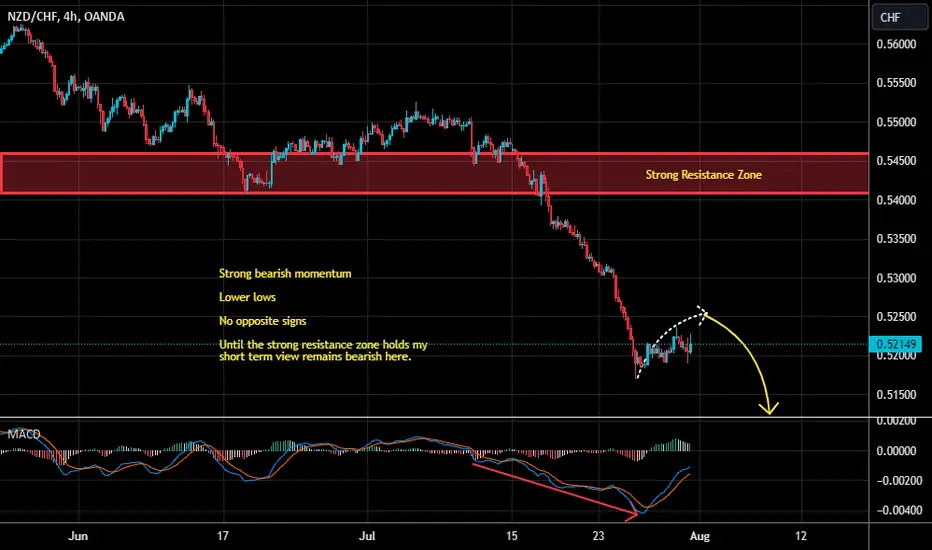
NZDCHF Short Term Sell IdeaH4 - Strong bearish momentum
Lower lows
No opposite signs
Until the strong resistance zone holds my short term view remains bearish here.
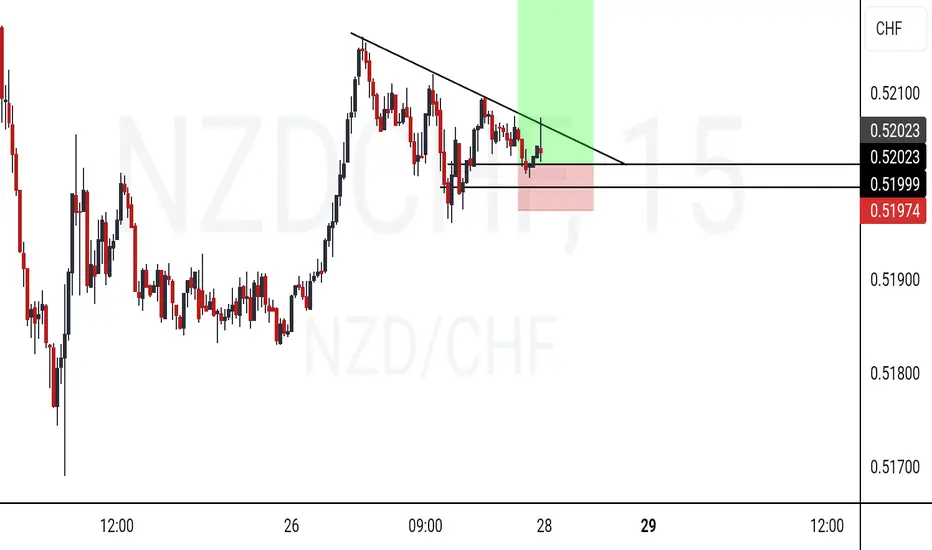
NZD/CHF - Breakout to the upside coming soon?Following on from a substantial downtrend in this pair, we can see that price has broken out of the descending channel and been ranging sideways for the last 4 days. Price is now consolidating within a small ascending channel. This is a pivotal area for this pair as any break above this could signal the beginning of a large correctional move to the upside.
If price can breach higher above the 5240 zone this may indicate further upside in this pair.
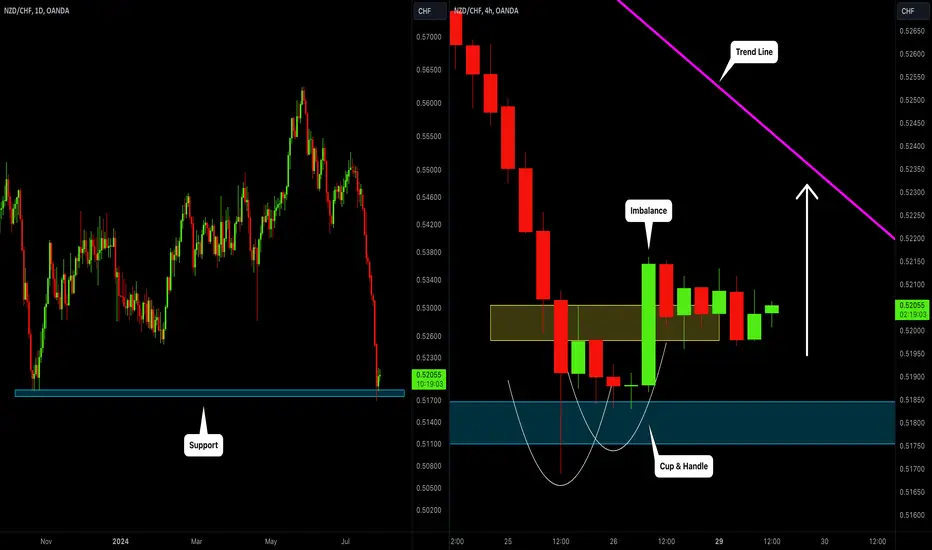
NZDCHF: Time For Pullback 🇳🇿🇨🇭
NZDCHF may bounce from a key daily historic support.
After its test, the price formed a cup & handle pattern on a 4H time frame
and broke its neckline with a bullish imbalance.
I expect a bullish move to a falling trend line.
❤️Please, support my work with like, thank you!❤️
NZD/CHF is Near A Very Strong Area Of Support Enter Buy Nowthe price reached the lowest point ever and i happens to be a strong area of support too so it will be great to enter buy now

Can we see a break out??Looks like it's poised for a break out unless it's a fake out. Looking for longs from demand zone.
NZDCHF - Bearish FlagThe currency pairs are telling that the pair is still going down with no serious trend divergence. We will play bearish flag here. The trade plan is set accordingly. Let's hope the plan works!

NZDCHF: ITF CURVE ANALYSIS (1D)✨NZDCHF: ITF CURVE ANALYSIS (1D) ✨ (UPTREND)
BLO2 @ 0.5275 ⏳
BLO1 @ 0.5315 ⏳
BSO @ 0.5442 ⏳
TP1 @ 0.54637
TP2 @ 0.57091
TP3 @ 0.5864
TP4 @ 0.5900
SLO1 @ 0.59071 ⏳
SLO2 @ 0.59923 ⏳
🔑
BLO = BUY LIMIT ORDER
ITF = INTERMEDIATE TIME FRAME
SLO = SELL LIMIT ORDER
TP = TAKE PROFIT
Intermediate time frames (4 hours to 6 day):
— Offer a clearer picture of the underlying trend compared to short-term frames.
— Provide more opportunities for confirmation signals and technical analysis.
— Allow for more flexible trading schedules, trades can be held overnight.
— Suitable for swing traders and some positional traders.

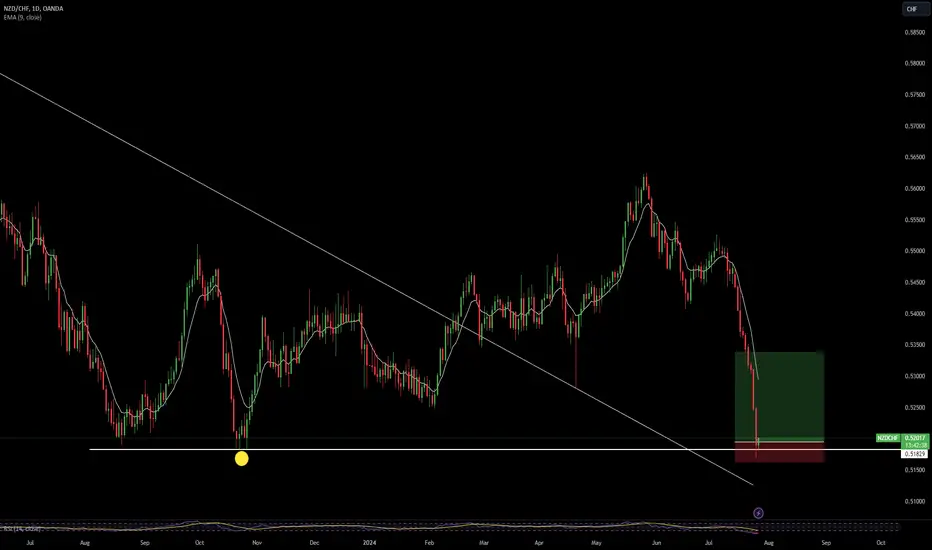
NZDCHF lowerBias Bearish
Fundamental
NZD data are bearish
CHF data are bullish
Price has break through the Daily SR level. Price is extreme bearish. In the Daily S/R level, lower TF H1, price broke through support level. Bearish movement have higher probability
Short set up
Short trade at H1 broken support level. SL above the swing high of H1. TP targeting the next lower Daily S/R level
NZD-CHF Very Risky Long! Buy!
Hello,Traders!
NZD-CHF is collapsing
Further down and has lost
Almost 7% from the local peak
So the pair is massively oversold
And as it is about to retest
The horizontal support of 0.5237
A local bullish correction
But this is a risky setup
Because of how easily
The pair broke all the
Previous support levels
So please use no more
Than 0.5% of the account
For this trade
Buy!
Like, comment and subscribe to help us grow!
Check out other forecasts below too!
NZD/CHF - Bearish CampaignThe NZD/CHF is on the move south after a major downside reversal started taking shape about a month and a half ago. On the short-term scale, price-action seems to be finishing up an upside technical correction. This could be that prime timing to take action. We short the pair to the next significant support key-level at 0.5262. We should be watchful about the coming support at 0.5432.

NZDCHF in a Complex Bullish ScenarioNZDCHF in a Complex Bullish Scenario
The current area was tested in August and October 2023 and February 2024.
Chances are that we could see the price rise again from this support area, given that it also corresponds to all-time lows.
On the other hand, the price also decreased due to the manipulation of the SNB. So, in general, we should be cautious, but an uptrend may start soon.
The current area was tested in August and October 2023 and February 2024.
We could see the price rise again from this support area, given that it also corresponds to all-time lows.
On the other hand, the price also decreased due to the manipulation of the SNB. So, in general, we should be cautious, but an uptrend may start soon.
You may find more details in the chart!
Thank you and Good Luck!
❤️PS: Please support with a like or comment if you find this analysis useful for your trading day❤️

NZD/CHF Vey Near Best The Place To Buy It And Get 250 Pips !This Is An Educational + Analytic Content That Will Teach Why And How To Enter A Trade
Make Sure You Watch The Price Action Closely In Each Analysis As This Is A Very Important Part Of Our Method
Disclaimer : This Analysis Can Change At Anytime Without Notice And It Is Only For The Purpose Of Assisting Traders To Make Independent Investments Decisions.

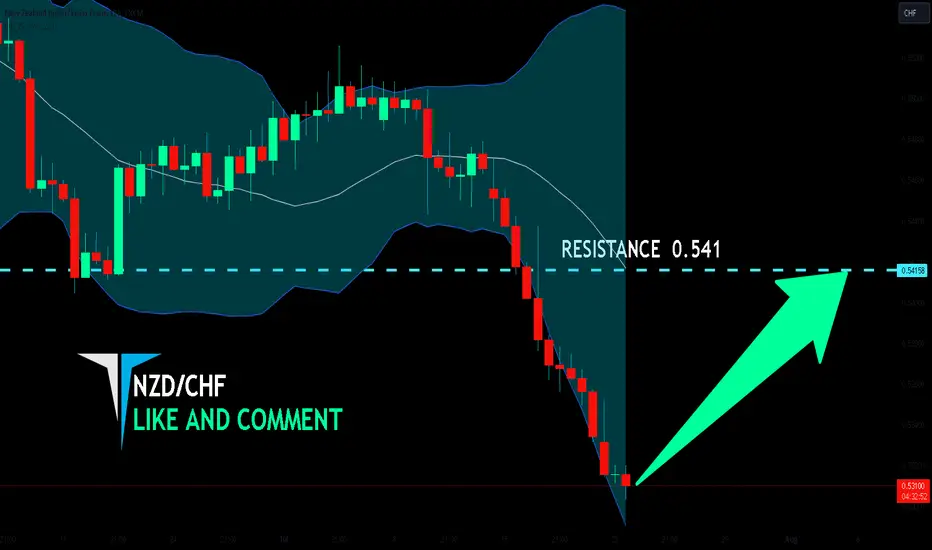
NZD/CHF BULLISH BIAS RIGHT NOW| LONG
Hello, Friends!
We are now examining the NZD/CHF pair and we can see that the pair is going down locally while also being in a downtrend on the 1W TF. But there is also a powerful signal from the BB lower band being nearby indicating that the pair is oversold so we can go long from the support line below and a target at 0.541 level.
✅LIKE AND COMMENT MY IDEAS✅
Long and Strong, NZDCHF Plays Its SongI've always wanted to be a part of a thrilling Kiwi-Swiss adventure, and what's more thrilling than a 0.55 target?
1. Risk-On Sentiment and Economic Recovery
The New Zealand Dollar (NZD) is often considered a risk-correlated currency, meaning it tends to perform well during periods of global economic optimism and growth. As the global economy shows signs of recovery, particularly in the second half of 2024, the NZD is likely to strengthen
. This is further supported by the Reserve Bank of New Zealand's (RBNZ) efforts to maintain inflation within a target range, which can boost investor confidence in the NZD .
2. Technical Indicators Suggest Bullish Patterns
Recent technical analysis indicates the formation of bullish patterns in the NZDCHF pair. Specifically, a cup and handle formation on the 4-hour chart suggests a potential breakout, with confirmation expected if the price closes above 0.5433 . This technical setup supports a bullish outlook, with potential targets at 0.5448 and 0.5460, making the 0.55 target plausible .
3. Economic Data and Forecasts
New Zealand's economic data and forecasts provide a supportive backdrop for the NZD. The country is expected to see a reduction in inflation to below 3% by Q3 2024, with further decreases anticipated by 2026 . Additionally, while the first half of 2024 saw GDP contraction, growth is expected to resume in the second half of the year . These factors contribute to a positive economic outlook for New Zealand, which can strengthen the NZD.
4. Safe Haven Dynamics of the Swiss Franc
The Swiss Franc (CHF) is traditionally seen as a safe haven currency, attracting investment during times of economic uncertainty . However, as global economic conditions improve, the demand for safe haven assets like the CHF may decrease, leading to a relative weakening of the CHF against riskier currencies like the NZD . This shift in investor sentiment can support a long position in NZDCHF.
5. Impact of Chinese Economic Performance
China is New Zealand's largest trading partner, and the performance of the Chinese economy significantly impacts the NZD . Positive developments in China can lead to increased demand for New Zealand exports, thereby strengthening the NZD. As the Chinese economy shows signs of stabilization and growth, this can further support a bullish outlook for NZDCHF.
6. Market Sentiment and Real-Time News
Real-time market sentiment and news also play a crucial role in currency movements. Recent reports indicate a slight decline in the NZD, but this could present a buying opportunity if the broader economic and technical indicators remain positive . Additionally, consumer confidence in New Zealand, as measured by the ANZ Roy Morgan Consumer Confidence index, remains a key indicator to watch .

NZDCHF Big move Upside is ComingThis channel looks interesting to me.
Watch the support to see an opportunity for big pips upside.

NZDCHF - DowntrendThe currency pairs are telling that the pair is still going down with no serious trend divergence. The trade plan is set accordingly. Let's hope the plan works!
COMING SOON BUYEntry point: green price (0.51664)
Respectively
TP1 & TP2 oranges prices
We wait until our entry price is touched, then we enter the transaction

NZDCHF | Range Idea | Pre-MarketWithin a 100K Account Balance the split on Trade & Risk Management = 1/10% - 1/20% margin as an Execution Range, to set up an Order Entry and select a per Trade on Average, to avoid any drawdown hit regarding to Stop Loss & to execute Risk on Management Specifics. Trail Stop efforts are a Focus of Attention to the set up in general when Volatile-Price-Action is involved, mainly because of the usage of an Intraday-Scalp-Position tool on behalf on the Trade Plan in general
# POSITION & Risk Reward | 15 Minutes Time Frame
- Measurement on Session
* Retracement | 0.5 & 0.618
* Extension | 0.88 & 1
# POSITION & Risk Reward | 1 Hour Time Frame
- Measurement on Session
* 20 EMA
* 1000 EMA
* Retracement
# TREND | TIME FRAME CONDUCTIVE | 4 Hour Time Frame
- Support & Resistance area 1
- Support & Resistance area 2
- Support & Resistance area 3
- Subdivision & General Trend
- Measurement on Session
* Retracement
* Support & Resistance
* Trade Area | Focus & Motion ahead
Active Sessions on Relevant Range & Elemented Probabilities;
* Asian(Ranging) - London(Upwards) - NYC(Downwards)
* Weekend Crypto Session
