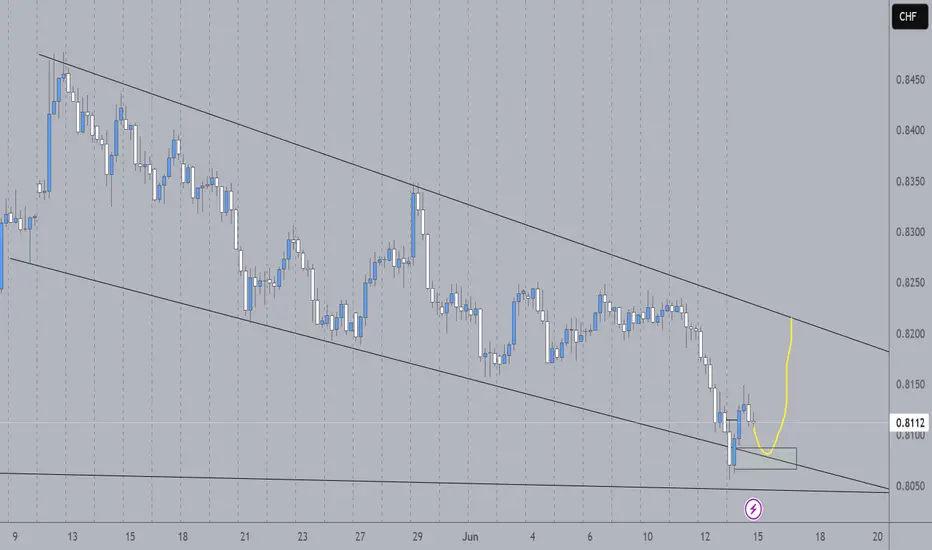
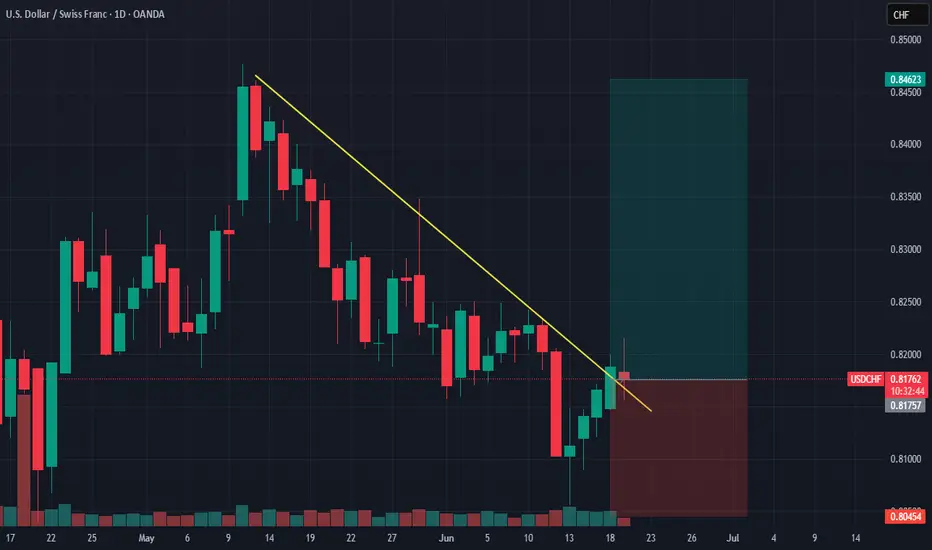
USDCHF LONGS?Looks like usdchf failed to break out the falling wedge after closing outside it and then closing back inside of it. Waiting for a retest of the lower boundary to take some potential longs this week
CHFUSD trade ideas
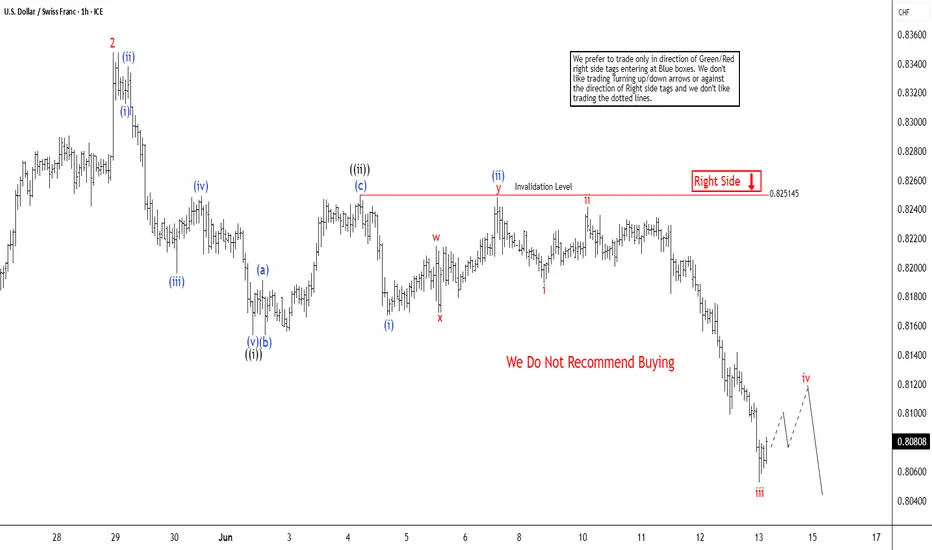
Elliott Wave Analysis: USDCHF Resumes Bearish TrendThe USDCHF currency pair has been declining since its peak on May 13, 2025. It follows a pattern that technical analysts identify as an impulsive wave with an extended structure, often referred to as a “nest.” This analysis tracks the pair’s movement through a series of waves, as observed on the 1-hour chart. It provides insight into its short-term trajectory and potential future movements.
Starting from the May 13 high, the initial decline, labeled wave 1, concluded at 0.8184. This was followed by a corrective rally in wave 2, which peaked at 0.8347. From there, the pair resumed its downward trend in wave 3. The wave 3 has unfolded with further subdivisions, forming another impulsive pattern in a lesser degree. Specifically, from the wave 2 high, the first sub-wave (i) ended at 0.8312, followed by a brief rally in wave (ii) to 0.8338. The pair then extended lower in wave (iii), reaching 0.8195, before a corrective wave (iv) rallied to 0.8249. The subsequent decline in wave (v) completed at 0.8153, finalizing wave ((i)) of the larger structure.
Following this, a recovery rally in wave ((ii)) reached 0.8250 before the pair turned lower again in wave ((iii)). Within this segment, the first sub-wave (i) ended at 0.8167, and a corrective wave (ii) rallied to 0.8248. In the near term, as long as the pair remains below 0.8250, any rallies are expected to fail after 3, 7, or 11 swings, with the pair likely to extend lower. This analysis suggests continued bearish momentum, with traders advised to monitor key levels for confirmation of further downside.
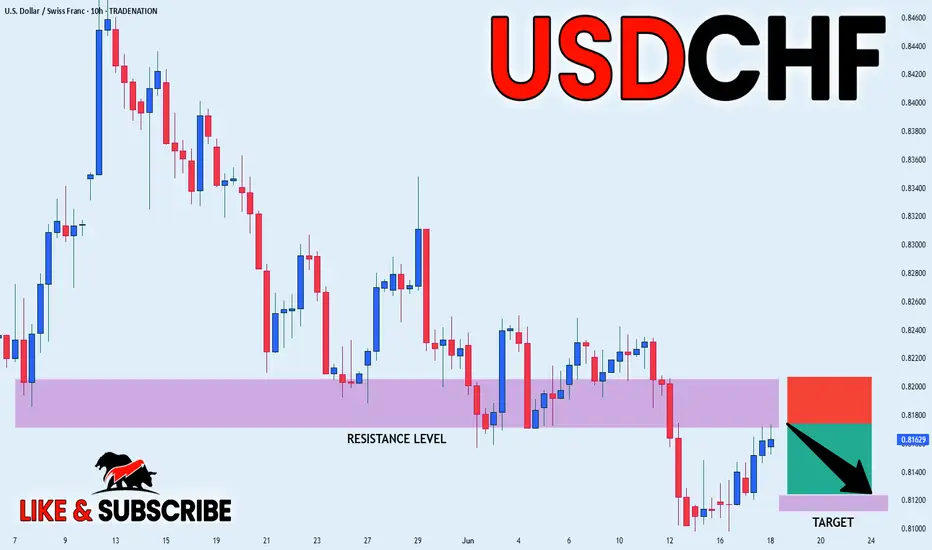
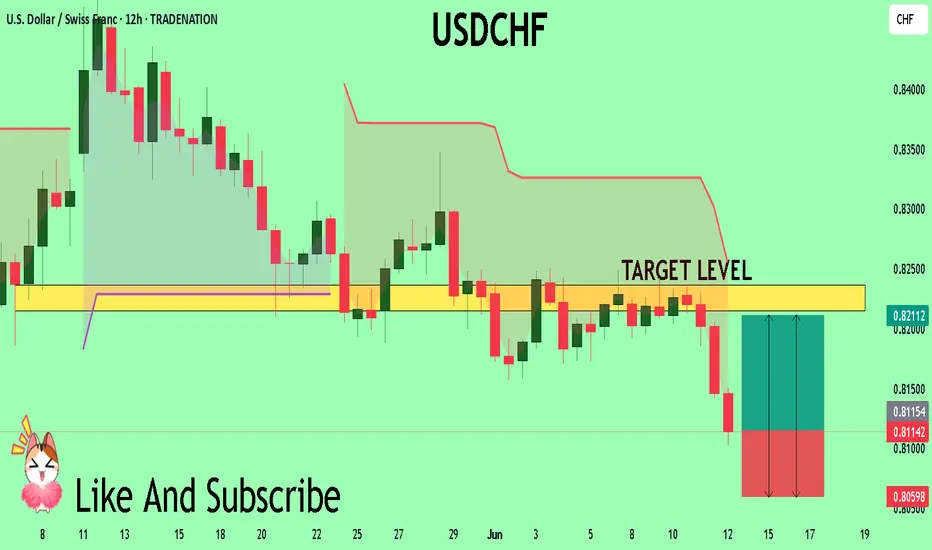
USD_CHF SHORT SIGNAL|
✅USD_CHF made a nice
Rebound from the support
Below just as we predicted in
Our previous analysis but is now
About to retest the horizontal
Resistance of 0.8200 from where
We can go short with the TP
Of 0.8124 and the SL of 0.8207
SHORT🔥
✅Like and subscribe to never miss a new idea!✅
Disclosure: I am part of Trade Nation's Influencer program and receive a monthly fee for using their TradingView charts in my analysis.
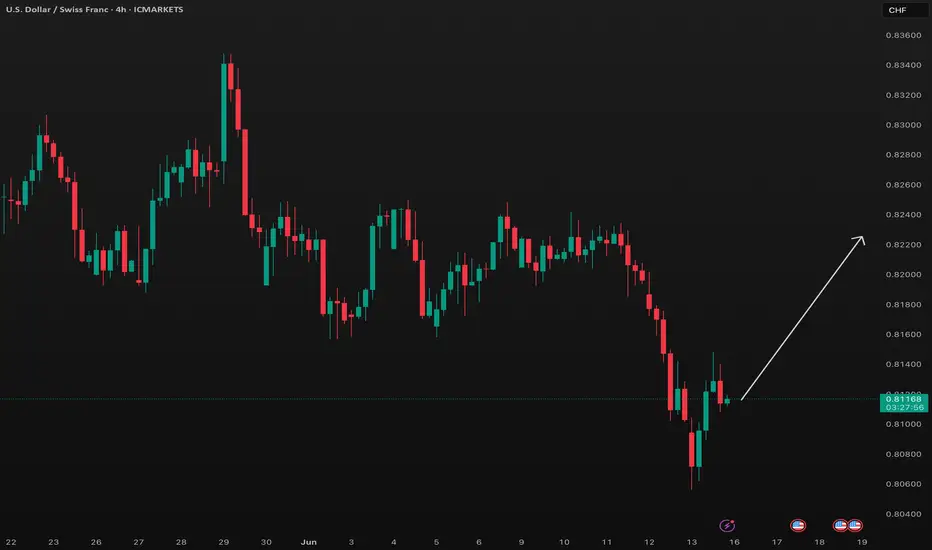
USDCHF Buy Setup 19-06-2025It appears that USD/CHF has broken above the downtrend and is expected to remain bullish following a period of consolidation.
TP and SL are marked.
Risk no more than 1%.
Swing trade setup, so stay patience
USDCHF 4 hr 2025-06-13Here is a Low Risk with a possible great reward opertunity .
@4xForecaster very nice 2.0

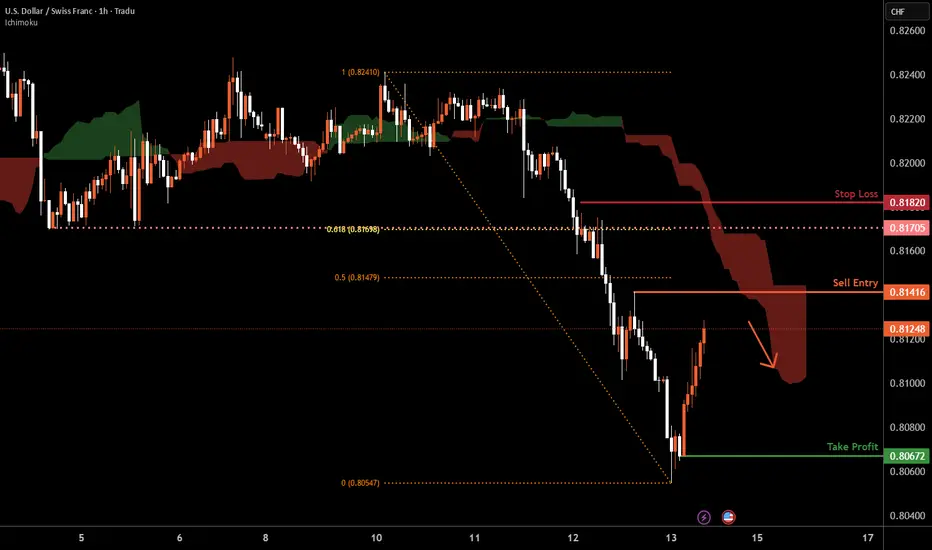
USD/CHF H1 | Swing-high resistance at 50% Fibonacci retracementUSD/CHF is rising towards a swing-high resistance and could potentially reverse off this level to drop lower.
Sell entry is at 0.8141 which is a swing-high resistance that aligns closely with the 50% Fibonacci retracement.
Stop loss is at 0.8182 which is a level that sits above the 61.8% Fibonacci retracement and a pullback resistance.
Take profit is at 0.8067 which is a swing-low support.
High Risk Investment Warning
Trading Forex/CFDs on margin carries a high level of risk and may not be suitable for all investors. Leverage can work against you.
Stratos Markets Limited (tradu.com ):
CFDs are complex instruments and come with a high risk of losing money rapidly due to leverage. 63% of retail investor accounts lose money when trading CFDs with this provider. You should consider whether you understand how CFDs work and whether you can afford to take the high risk of losing your money.
Stratos Europe Ltd (tradu.com ):
CFDs are complex instruments and come with a high risk of losing money rapidly due to leverage. 63% of retail investor accounts lose money when trading CFDs with this provider. You should consider whether you understand how CFDs work and whether you can afford to take the high risk of losing your money.
Stratos Global LLC (tradu.com ):
Losses can exceed deposits.
Please be advised that the information presented on TradingView is provided to Tradu (‘Company’, ‘we’) by a third-party provider (‘TFA Global Pte Ltd’). Please be reminded that you are solely responsible for the trading decisions on your account. There is a very high degree of risk involved in trading. Any information and/or content is intended entirely for research, educational and informational purposes only and does not constitute investment or consultation advice or investment strategy. The information is not tailored to the investment needs of any specific person and therefore does not involve a consideration of any of the investment objectives, financial situation or needs of any viewer that may receive it. Kindly also note that past performance is not a reliable indicator of future results. Actual results may differ materially from those anticipated in forward-looking or past performance statements. We assume no liability as to the accuracy or completeness of any of the information and/or content provided herein and the Company cannot be held responsible for any omission, mistake nor for any loss or damage including without limitation to any loss of profit which may arise from reliance on any information supplied by TFA Global Pte Ltd.
The speaker(s) is neither an employee, agent nor representative of Tradu and is therefore acting independently. The opinions given are their own, constitute general market commentary, and do not constitute the opinion or advice of Tradu or any form of personal or investment advice. Tradu neither endorses nor guarantees offerings of third-party speakers, nor is Tradu responsible for the content, veracity or opinions of third-party speakers, presenters or participants.
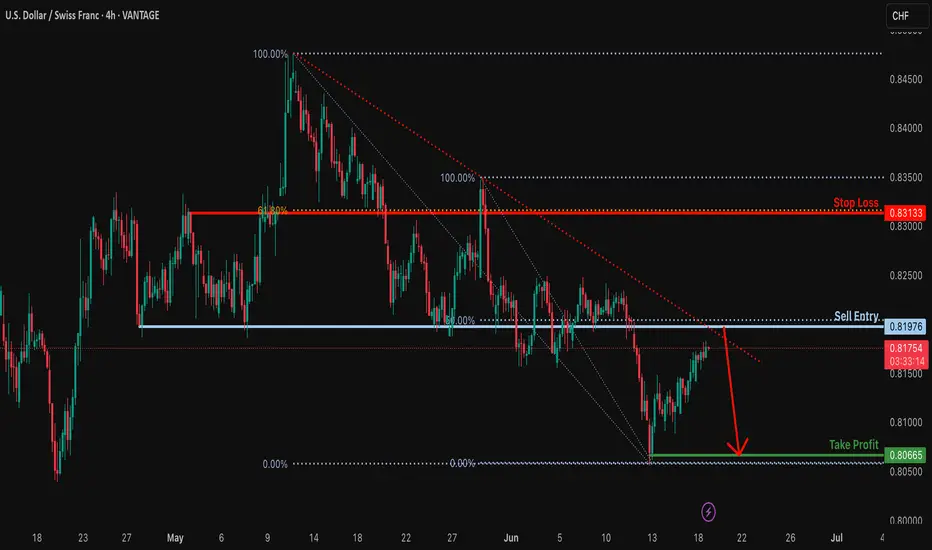
Major resistance ahead?USD/CHF is rising towards the resistance level which is a pullback resistance that aligns with the 50% Fibonacci retracement and could reverse from this level too ur take profit.
Entry: 0.8197
Why we like it:
There is a pullback resistance level hat lines up with the 50% Fibonacci retracement.
Stop loss: 0.8313
Why we like it:
There is a pullback resistance level that lines up with the 61.8% Fibonacci retracement.
Take profit: 0.8066
Why we like it:
There is a pullback support level.
Enjoying your TradingView experience? Review us!
Please be advised that the information presented on TradingView is provided to Vantage (‘Vantage Global Limited’, ‘we’) by a third-party provider (‘Everest Fortune Group’). Please be reminded that you are solely responsible for the trading decisions on your account. There is a very high degree of risk involved in trading. Any information and/or content is intended entirely for research, educational and informational purposes only and does not constitute investment or consultation advice or investment strategy. The information is not tailored to the investment needs of any specific person and therefore does not involve a consideration of any of the investment objectives, financial situation or needs of any viewer that may receive it. Kindly also note that past performance is not a reliable indicator of future results. Actual results may differ materially from those anticipated in forward-looking or past performance statements. We assume no liability as to the accuracy or completeness of any of the information and/or content provided herein and the Company cannot be held responsible for any omission, mistake nor for any loss or damage including without limitation to any loss of profit which may arise from reliance on any information supplied by Everest Fortune Group.
USD/CHF SHORT USD/CHF SHORT " break of a support area and retest it + 61.8% fib retracement + 50 ema dynamic resistance + down trendline "
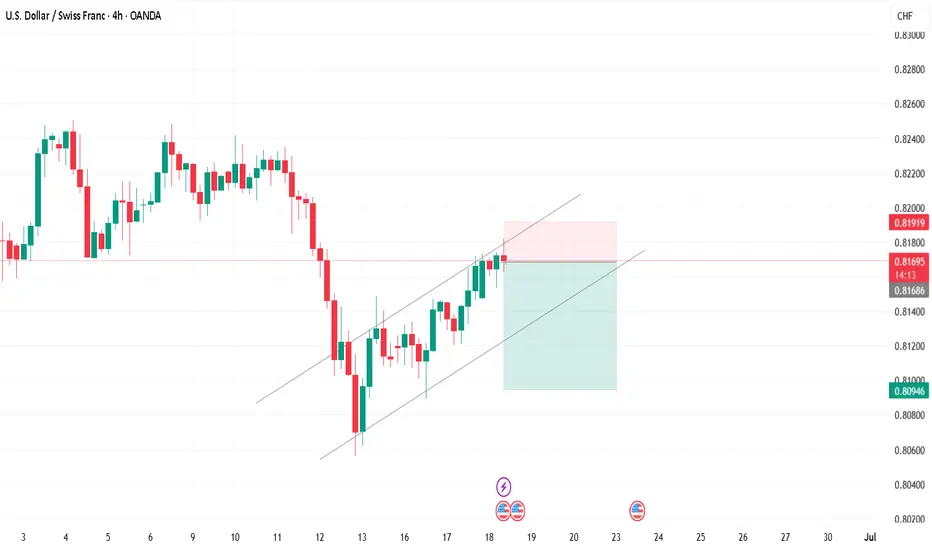
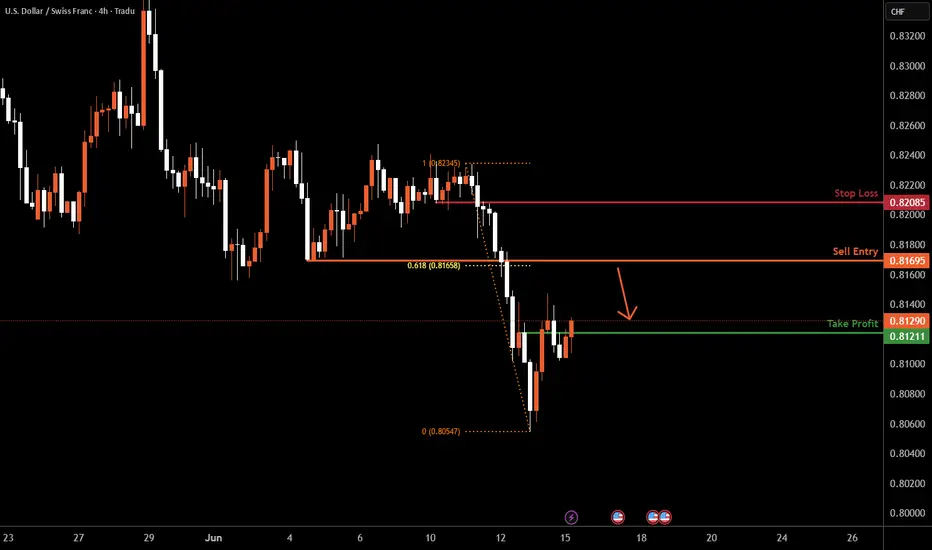
USDCHF H4 | Bearish Reversal Based on the H4 chart, the price is rising toward our sell entry level at 0.8169, a pullback resistance that aligns with the 61.8% Fibo retracement.
Our take profit is set at 0.8121, a pullback support.
The stop loss is set at 0.8208, a pullback resistance.
High Risk Investment Warning
Trading Forex/CFDs on margin carries a high level of risk and may not be suitable for all investors. Leverage can work against you.
Stratos Markets Limited (tradu.com ):
CFDs are complex instruments and come with a high risk of losing money rapidly due to leverage. 63% of retail investor accounts lose money when trading CFDs with this provider. You should consider whether you understand how CFDs work and whether you can afford to take the high risk of losing your money.
Stratos Europe Ltd (tradu.com ):
CFDs are complex instruments and come with a high risk of losing money rapidly due to leverage. 63% of retail investor accounts lose money when trading CFDs with this provider. You should consider whether you understand how CFDs work and whether you can afford to take the high risk of losing your money.
Stratos Global LLC (tradu.com ):
Losses can exceed deposits.
Please be advised that the information presented on TradingView is provided to Tradu (‘Company’, ‘we’) by a third-party provider (‘TFA Global Pte Ltd’). Please be reminded that you are solely responsible for the trading decisions on your account. There is a very high degree of risk involved in trading. Any information and/or content is intended entirely for research, educational and informational purposes only and does not constitute investment or consultation advice or investment strategy. The information is not tailored to the investment needs of any specific person and therefore does not involve a consideration of any of the investment objectives, financial situation or needs of any viewer that may receive it. Kindly also note that past performance is not a reliable indicator of future results. Actual results may differ materially from those anticipated in forward-looking or past performance statements. We assume no liability as to the accuracy or completeness of any of the information and/or content provided herein and the Company cannot be held responsible for any omission, mistake nor for any loss or damage including without limitation to any loss of profit which may arise from reliance on any information supplied by TFA Global Pte Ltd.
The speaker(s) is neither an employee, agent nor representative of Tradu and is therefore acting independently. The opinions given are their own, constitute general market commentary, and do not constitute the opinion or advice of Tradu or any form of personal or investment advice. Tradu neither endorses nor guarantees offerings of third-party speakers, nor is Tradu responsible for the content, veracity or opinions of third-party speakers, presenters or participants.
Bullish bounce off pullback support?USD/CHF is falling towards the support level which is a pullback support and could bounce from this level to our take profit.
Entry: 0.8066
Why we like it:
There is a pullback support.
Stop loss: 0.8031
Why we like it:
There is a support level at the 61% Fibonacci projection and the 127.2% Fibonacci extension.
Take profit: 0.8157
Why we lik eit:
There is an overlap resistance level.
Enjoying your TradingView experience? Review us!
Please be advised that the information presented on TradingView is provided to Vantage (‘Vantage Global Limited’, ‘we’) by a third-party provider (‘Everest Fortune Group’). Please be reminded that you are solely responsible for the trading decisions on your account. There is a very high degree of risk involved in trading. Any information and/or content is intended entirely for research, educational and informational purposes only and does not constitute investment or consultation advice or investment strategy. The information is not tailored to the investment needs of any specific person and therefore does not involve a consideration of any of the investment objectives, financial situation or needs of any viewer that may receive it. Kindly also note that past performance is not a reliable indicator of future results. Actual results may differ materially from those anticipated in forward-looking or past performance statements. We assume no liability as to the accuracy or completeness of any of the information and/or content provided herein and the Company cannot be held responsible for any omission, mistake nor for any loss or damage including without limitation to any loss of profit which may arise from reliance on any information supplied by Everest Fortune Group.

USDCHF BUY TRADE PLANUSD/CHF - June 13, 2025
📋 Plan Overview
Type: Countertrend Buy
Direction: Long
Confidence: Medium-High
R:R: ~2.5:1
Status: Waiting for retracement or confirmation
📈 Market Bias & Type
Short-term reversal opportunity inside long-term bearish trend
Bias: Temporary bullish correction
Type: Reversal (LTF Bounce against HTF trend)
🔰 Confidence Level with % and Breakdown
Total: 70%
HTF Oversold/Wick Rejection: 25%
Bullish H1-H4 structure shift: 20%
Volume spike + H1 engulfing: 15%
Fundamental/Sentiment: 10%
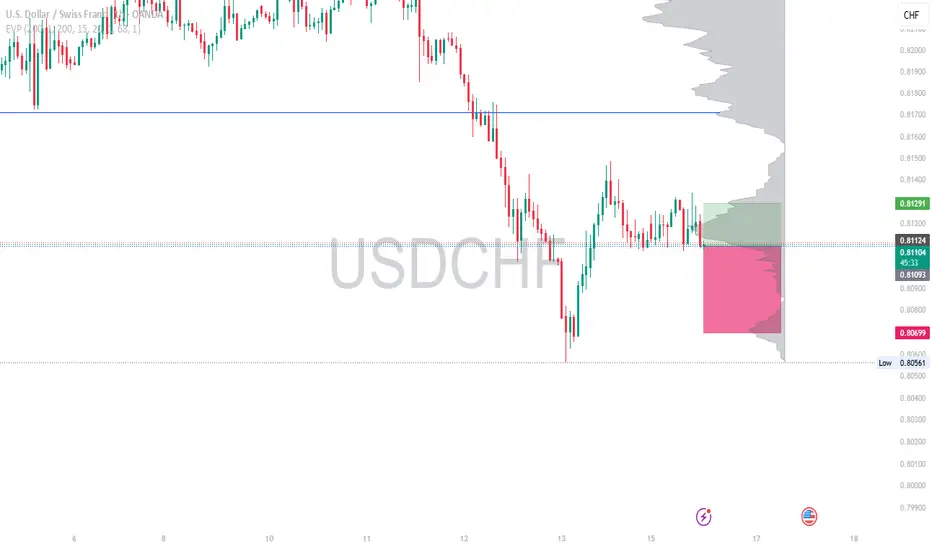
📍 Entry Zones
Primary: 0.8110 - 0.8120 (pullback zone to broken H1 structure)
Secondary: 0.8085 (origin of impulse leg if deeper retracement happens)
❗ SL with Reasoning
SL: 0.8050
Below the low of June 13 H1 reversal candle + structural invalidation
🎯 TP1/TP2/TP3 Targets
TP1: 0.8180 (recent H1 supply flip)
TP2: 0.8225 (H4 resistance)
TP3: 0.8290 (D1 imbalance fill area)
🧠 Management Strategy
Risk: 1%
Scaling: Add on confirmation from H1 higher low (0.8140+)
Breakeven: After TP1 or on strong bullish H1 candle + volume confirmation
⚠️ Confirmation Checklist
✅ Bullish engulfing on H1
✅ Impulse breakout structure
✅ Volume rise on reversal candle
⚠️ Still awaiting H1 retest or HL (no rush entry)
⏳ Validity
H1: 12h
H4: 36–48h max (until invalidation)
❌ Invalidation Conditions
Clean break and close below 0.8050
Failure to form HL and break above 0.8145 (range trap risk)
🌐 Fundamental & Sentiment Snapshot
CHF remains firm on safe haven flow
USD broadly weaker on Fed rate pause expectations
CPI/retail sentiment suggests potential DXY weakness short-term
Safe haven profit-taking could lift USD short-term
📋 Final Trade Summary
Looking for a corrective buy in a broader USDCHF downtrend. Signs of early reversal on LTFs with clean H1 impulse leg. Entry awaits retracement into structure. Conservative targets aligned with HTF levels. Risk tightly defined; no overexposure.
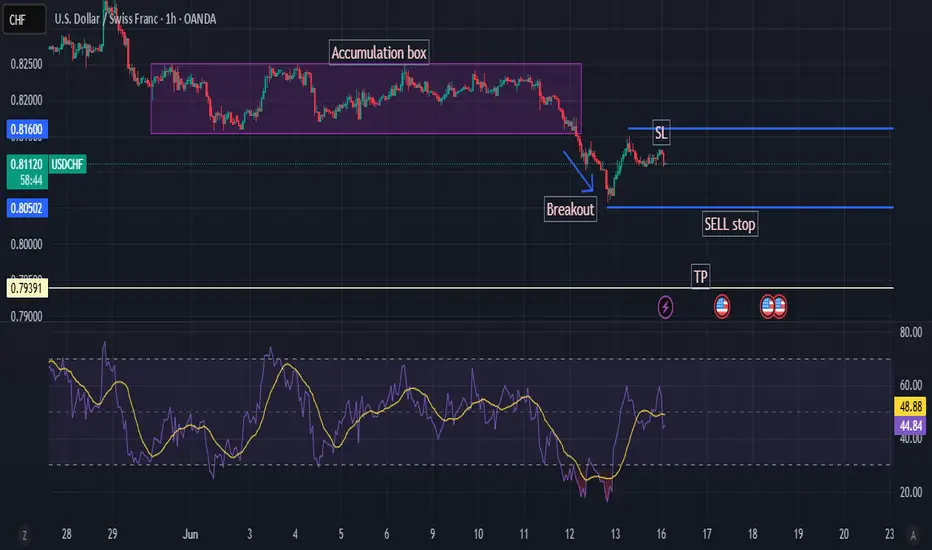
USDCHF - Bearish Continuation STORY : Bearish Indications :
1- LH and LL
2- No Divergence
3- Symmetrical pattern
4- Seasonal Show USDCHF Bearish in June for last 15 years
Bullish Indications:
1- SXF on 1H time frame make a bearish Divergence which indicates a
strong corrective move in the index.
if that happens market will make breakout above 0.81565
Anticipation : I anticipate in order for the market to continue, the market will break the neck line and then continue bearish
Plan : Enter into the market with pending order (Sell Stop) and then wait for the TPs to hit as per mentioned target points.

USDCHFwe can see usdchf is looking bearish so with risk management we will be selling to the down side 1:2
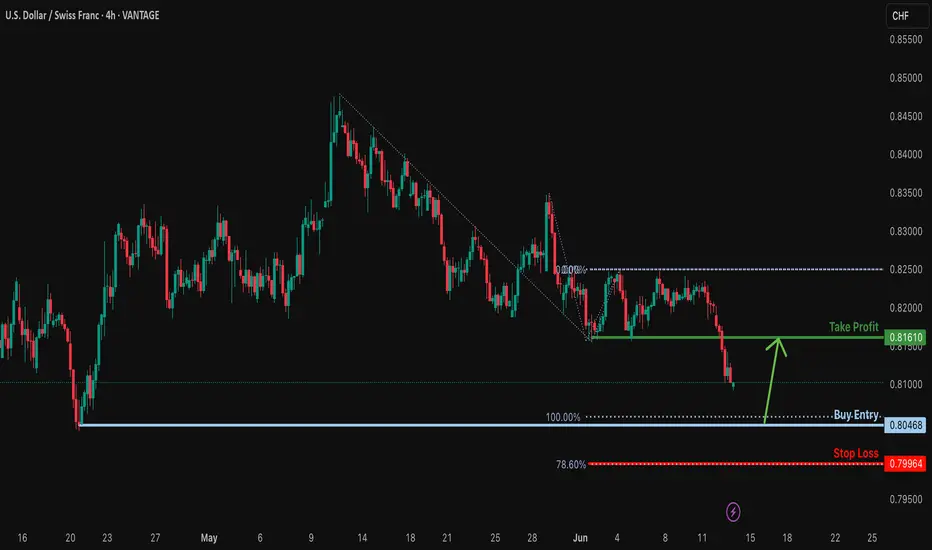
Falling towards pullback support?USD/CHF is falling toward the support level, which is a pullback support aligning with the 100% Fibonacci projection. A bounce from this level could indicate a double bottom pattern, potentially leading to a price rise toward our take profit target.
Entry: 0.8046
Why we like it:
There is a pullback support level that aligns with the 100% Fibonacci projection.
Stop loss: 0.7996
Why we like it:
There is a support level at the 78.6% Fibonacci projection.
Take profit: 0.8161
Why we like it:
There is a pullback resistance level.
Enjoying your TradingView experience? Review us!
Please be advised that the information presented on TradingView is provided to Vantage (‘Vantage Global Limited’, ‘we’) by a third-party provider (‘Everest Fortune Group’). Please be reminded that you are solely responsible for the trading decisions on your account. There is a very high degree of risk involved in trading. Any information and/or content is intended entirely for research, educational and informational purposes only and does not constitute investment or consultation advice or investment strategy. The information is not tailored to the investment needs of any specific person and therefore does not involve a consideration of any of the investment objectives, financial situation or needs of any viewer that may receive it. Kindly also note that past performance is not a reliable indicator of future results. Actual results may differ materially from those anticipated in forward-looking or past performance statements. We assume no liability as to the accuracy or completeness of any of the information and/or content provided herein and the Company cannot be held responsible for any omission, mistake nor for any loss or damage including without limitation to any loss of profit which may arise from reliance on any information supplied by Everest Fortune Group.
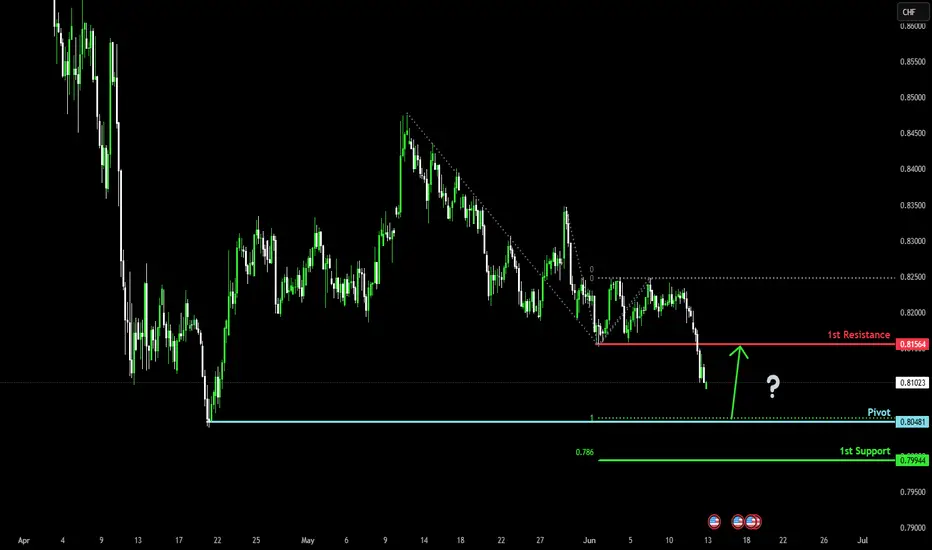
Falling towards major support?USD/CHF is falling towards the pivot and could bounce to the 1st resistance.
Pivot: 0.8048
1st Support: 0.7994
1st Resistance: 0.8156
Risk Warning:
Trading Forex and CFDs carries a high level of risk to your capital and you should only trade with money you can afford to lose. Trading Forex and CFDs may not be suitable for all investors, so please ensure that you fully understand the risks involved and seek independent advice if necessary.
Disclaimer:
The above opinions given constitute general market commentary, and do not constitute the opinion or advice of IC Markets or any form of personal or investment advice.
Any opinions, news, research, analyses, prices, other information, or links to third-party sites contained on this website are provided on an "as-is" basis, are intended only to be informative, is not an advice nor a recommendation, nor research, or a record of our trading prices, or an offer of, or solicitation for a transaction in any financial instrument and thus should not be treated as such. The information provided does not involve any specific investment objectives, financial situation and needs of any specific person who may receive it. Please be aware, that past performance is not a reliable indicator of future performance and/or results. Past Performance or Forward-looking scenarios based upon the reasonable beliefs of the third-party provider are not a guarantee of future performance. Actual results may differ materially from those anticipated in forward-looking or past performance statements. IC Markets makes no representation or warranty and assumes no liability as to the accuracy or completeness of the information provided, nor any loss arising from any investment based on a recommendation, forecast or any information supplied by any third-party.
USDCHF Will Explode! BUY!
My dear friends,
USDCHF looks like it will make a good move, and here are the details:
The market is trading on 0.8114 pivot level.
Bias - Bullish
Technical Indicators: Supper Trend generates a clear long signal while Pivot Point HL is currently determining the overall Bullish trend of the market.
Goal - 0.8214
Recommended Stop Loss - 0.8059
About Used Indicators:
Pivot points are a great way to identify areas of support and resistance, but they work best when combined with other kinds of technical analysis
Disclosure: I am part of Trade Nation's Influencer program and receive a monthly fee for using their TradingView charts in my analysis.
———————————
WISH YOU ALL LUCK
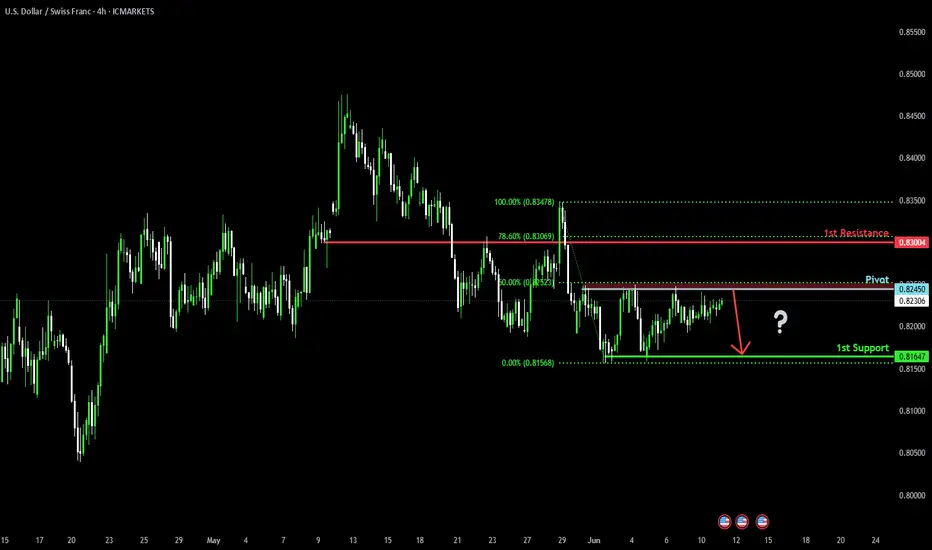
Major resistance ahead?The Swissie (USD/CHF) is rising towards the pivot which has been identified as a pullback resistance and could reverse to the pullback support.
Pivot: 0.8245
1st Support: 0.8164
1st Resistance: 0.8300
Risk Warning:
Trading Forex and CFDs carries a high level of risk to your capital and you should only trade with money you can afford to lose. Trading Forex and CFDs may not be suitable for all investors, so please ensure that you fully understand the risks involved and seek independent advice if necessary.
Disclaimer:
The above opinions given constitute general market commentary, and do not constitute the opinion or advice of IC Markets or any form of personal or investment advice.
Any opinions, news, research, analyses, prices, other information, or links to third-party sites contained on this website are provided on an "as-is" basis, are intended only to be informative, is not an advice nor a recommendation, nor research, or a record of our trading prices, or an offer of, or solicitation for a transaction in any financial instrument and thus should not be treated as such. The information provided does not involve any specific investment objectives, financial situation and needs of any specific person who may receive it. Please be aware, that past performance is not a reliable indicator of future performance and/or results. Past Performance or Forward-looking scenarios based upon the reasonable beliefs of the third-party provider are not a guarantee of future performance. Actual results may differ materially from those anticipated in forward-looking or past performance statements. IC Markets makes no representation or warranty and assumes no liability as to the accuracy or completeness of the information provided, nor any loss arising from any investment based on a recommendation, forecast or any information supplied by any third-party.
USDCHF Inverse flag and pole pattern USDCHF Trade Setup –
Bearish Flag & Pole Pattern (1H Time Frame)
🔍 Market Overview:
Currently observing a bearish flag & pole formation on USDCHF, paired with a bullish FVG retracement. Price is approaching a potential supply zone at 0.81700, presenting a high-probability short opportunity.
📌 Sell Zone:
🔹 Supply Zone: 0.81700
🔹 Stop Loss: Above Bearish Order Block at 0.82300
🎯 Bearish Targets:
1️⃣ First Target: 0.81200 (Demand Zone)
2️⃣ Second Target: 0.80900 (Demand Zone)
3️⃣ Final Target: 0.80600 (Major Support)
✨ Bullish Fair Value Gap remains unfilled at 0.80700 — watch for potential reaction once filled.
📊 Technical Confluence:
✅ Bearish flag & pole
✅ Supply zone reaction
✅ FVG retracement
✅ Multiple demand zones for scaling out profits
📣 Like, Follow, Comment & Join the community for more real-time setups and updates!
— Livia 😜 | Trade Smart. Stay Sharp.

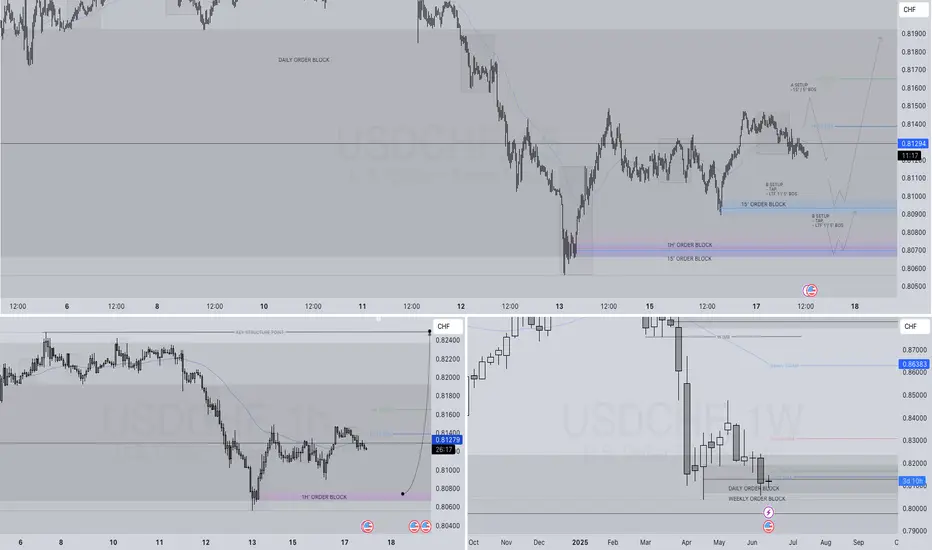
USDCHF LONG FORECAST Q2 W25 D17 Y25USDCHF LONG FORECAST Q2 W25 D17 Y25
Professional Risk Managers👋
Welcome back to another FRGNT chart update📈
Diving into some Forex setups using predominantly higher time frame order blocks alongside intraday confirmation & breaks of structure.
Let’s see what price action is telling us today! 🔥
💡Here are some trade confluences📝
✅Weekly order block rejection
✅Daily order block rejection
✅15’ order block
✅Intraday bullish breaks of structure
🔑 Remember, to participate in trading comes always with a degree of risk, therefore as professional risk managers it remains vital that we stick to our risk management plan as well as our trading strategies.
📈The rest, we leave to the balance of probabilities.
💡Fail to plan. Plan to fail.
🏆It has always been that simple.
❤️Good luck with your trading journey, I shall see you at the very top.
🎯Trade consistent, FRGNT X
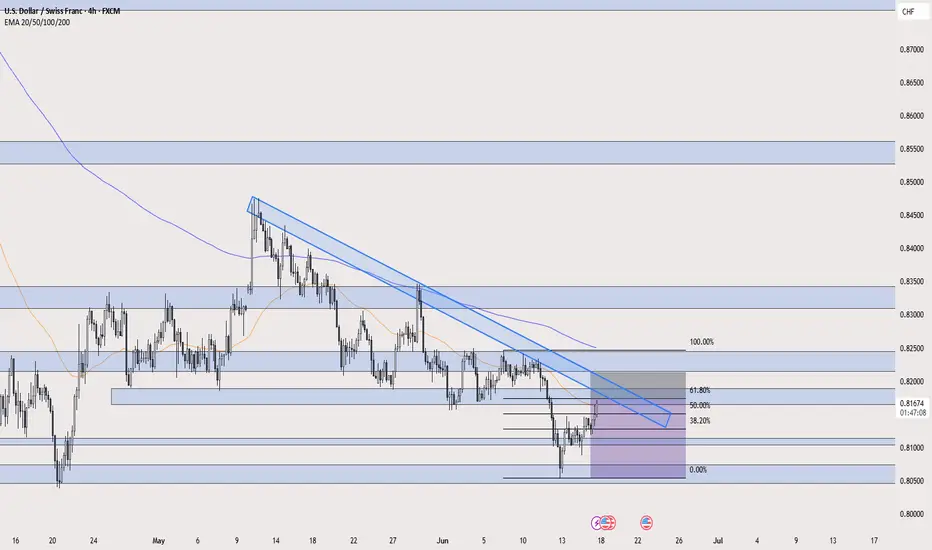
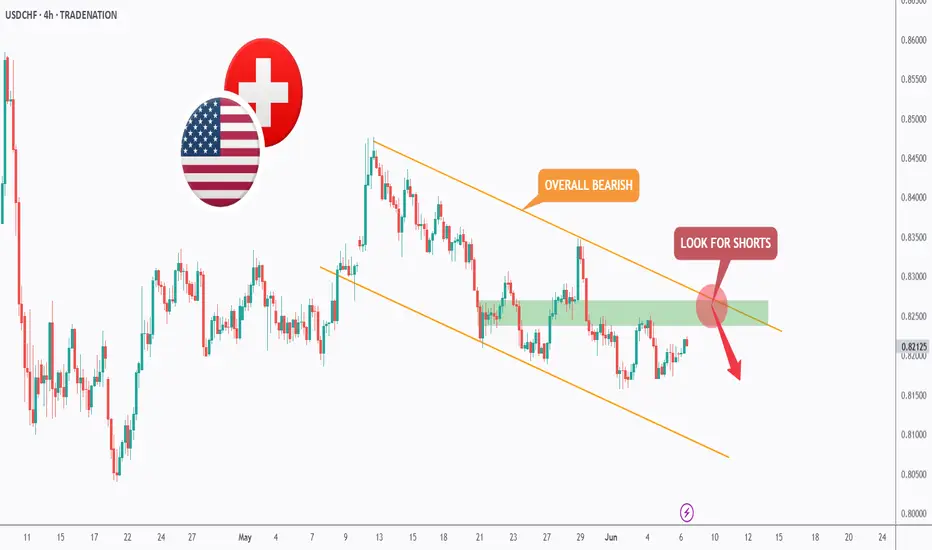
USDCHF - Follow The Bears!Hello TradingView Family / Fellow Traders. This is Richard, also known as theSignalyst.
📈USDCHF has been overall bearish trading within the falling channel marked in orange. And it is currently retesting the upper bound of the channel.
Moreover, the green zone is a strong structure.
🏹 Thus, the highlighted red circle is a strong area to look for sell setups as it is the intersection of the upper orange trendline and structure.
📚 As per my trading style:
As #USDCHF approaches the red circle zone, I will be looking for bearish reversal setups (like a double top pattern, trendline break , and so on...)
📚 Always follow your trading plan regarding entry, risk management, and trade management.
Good luck!
All Strategies Are Good; If Managed Properly!
~Rich
Disclosure: I am part of Trade Nation's Influencer program and receive a monthly fee for using their TradingView charts in my analysis.
USD/CHF – Rejection at Key Fib Confluence, Bearish Continuation We’re seeing a beautiful textbook rejection off the 0.79Fib zone (0.8200), precisely where price tapped into a previous structure break and minor supply block. Price surged into the red zone, wicked just above the 200 EMA, and was instantly met with heavy sell-side pressure — a strong signal of institutional distribution.
📌 Technical Confluences at Play:
Price failed to break the 200 EMA cleanly — acting as dynamic resistance.
0.79 Fib levels aligning with prior supply.
Rising wedge structure broken to the downside.
Entry candle printing a solid engulfing rejection — institutional footprint.
📉 Target Zone:
Primary TP sits at the 0.236 Fib level (0.8101), but the full measured move of this wedge gives us a final downside target near 0.8038, with intermediate stops at key Fibs. Invalidation above 0.82294
🧠 Trader’s Insight:
“Patience is power. You don’t chase moves, you position for moments.”
Let the market come to your zone of interest, validate your thesis, and then strike with precision. The best trades come from areas where multiple confirmations stack in your favor.
📉 Trade Plan:
Entry: 0.81933 rejection zone
TP1: 0.8130
TP2: 0.8101
Final TP: 0.8038
SL: Above 0.82294 (tight invalidation)
@WrightWayInvestments
@WrightWayInvestments
@WrightWayInvestments