USDCHF: The Cold War of Currencies (USD-CHF)#USDCHF: The Cold War of Currencies
The U.S. Dollar has been trying to woo the Swiss Franc for years now… but CHF isn’t impressed. It’s like dating someone who responds to your best pickup line with "Danke, aber nein."
Since peaking above 1.01 in late 2022, this pair has been stuck in a stubborn downhill ski slope that would make even a Swiss instructor proud. Lower highs, lower lows and now we’re hugging the 0.8120 zone like it’s the last fondue pot at a winter party.
📉 Volumes are thinning, confidence is fading, and if this descending love story continues, we might soon see a re-test of the ghosted zone near 0.8000 or worse, the never called-back ex: 0.78!!!
BUT zoom in, and there’s a flicker. A box range forming. Some might call it consolidation. Some might call it a dead cat bounce. But hey, hope is a strategy if you trade with stop-losses.
👉 Buyers, you're dancing on thin alpine ice.
👉 Sellers, you’ve been skiing downhill for a while don't forget gravity eventually levels out.
If USD doesn’t bring a surprise interest rate ski-lift, this might just be the quiet drift into the CHF woods.
Moral of the chart: Never underestimate a neutral country with a strong currency and no emotional baggage! Is the same like me Zero Emotions on Trading! With this strategy i gain gain and gain.. learn your own way and good luck..
#USDCHF #Swiss #CHF #DollarDilemmas #TechnicalAnalysis #RangeOrBreak #AlpineRejection
CHFUSD trade ideas

USD/CHF Testing June Low as Momentum Turns SouthRising geopolitical tensions and sliding U.S. Treasury yields have dragged USD/CHF sharply lower, delivering a bearish engulfing candle on the daily and pushing the pair back towards the June low at .8160. The move sets up a potential short should that level give way.
A clean break of .8160 would allow for positions to be established with a stop above for protection, targeting a retest of the April 21 swing low at .8040. Momentum signals are turning bearish, with RSI (14) breaking its uptrend and drifting further from neutral, while MACD looks set to cross the signal line below zero.
While a long setup is also a consideration should .8160 hold, recent price action and momentum shifts suggest it’s a low-probability play.
Good luck!
DS
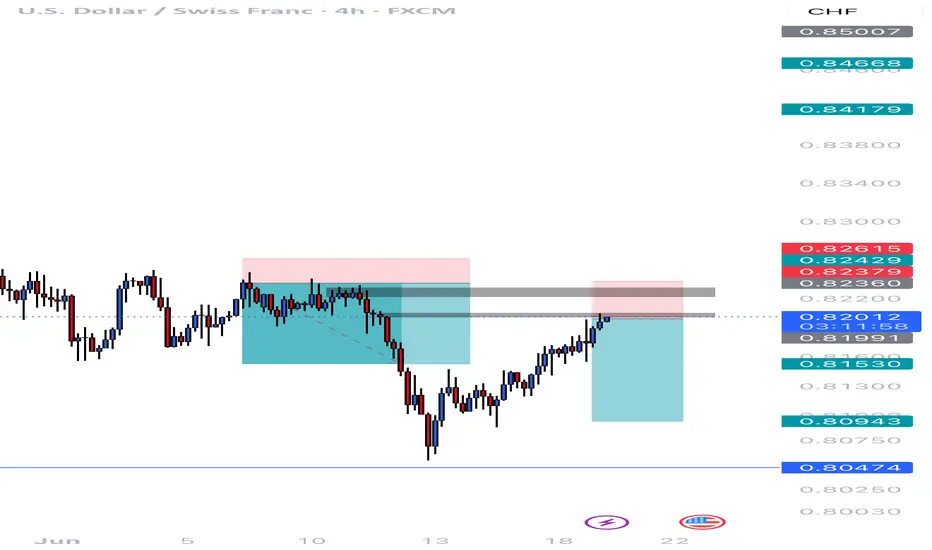
USDCHF - TIME TO MAKE MILLIONSTeam, we been waiting over a week by now
Last time we kill the market well
I only trade when i see opportunity, otherwise I do not trade
Most of my trade are 95% winning ratio and accuracy.
I hope you enjoy the ride for USDCHF
Dont forget when it hit above 0.82000 zone, take 50% and the rest is above 0.8215-8230
SEAT BELL UP AND ENJOY THE RIDE.
EURCHF H4As we can see , we had sell side Liquidity that have been taken out after that , we had MSS (market structure shift ) which creates inducement that forms SMT ( smart money technique). After SMT market goes up creating inversion fair value gap. And we took our entry at our order block.
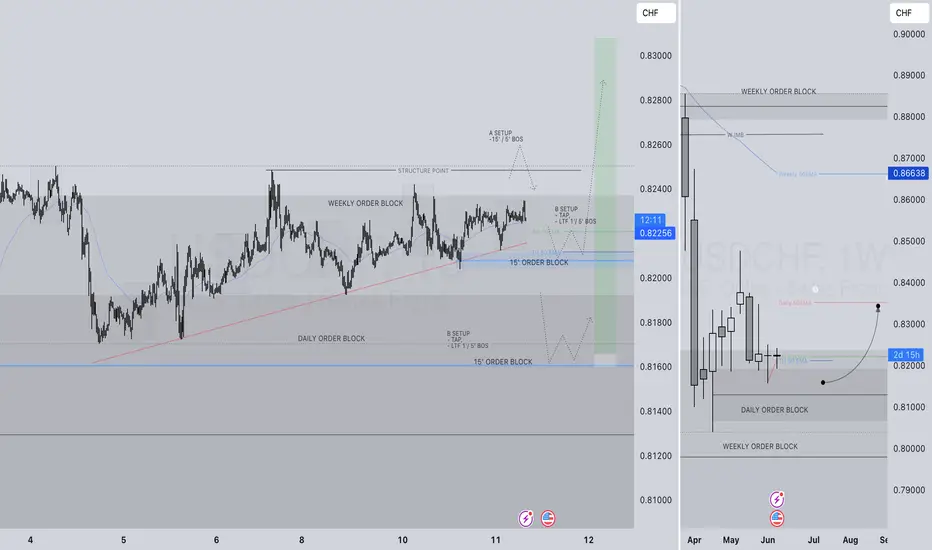
USDCHF LONG FORECAST Q2 W24 D11 Y25👀 USDCHF LONG FORECAST Q2 W24 D11 Y25
🔥HOT PICK ALERT 🔥
Professional Risk Managers👋
Welcome back to another FRGNT chart update📈
Diving into some Forex setups using predominantly higher time frame order blocks alongside intraday confirmation & breaks of structure.
Let’s see what price action is telling us today! 🔥
💡Here are some trade confluences📝
✅Weekly order block rejection
✅Daily order block rejection
✅15’ order block
✅Intraday bullish breaks of structure
🔑 Remember, to participate in trading comes always with a degree of risk, therefore as professional risk managers it remains vital that we stick to our risk management plan as well as our trading strategies.
📈The rest, we leave to the balance of probabilities.
💡Fail to plan. Plan to fail.
🏆It has always been that simple.
❤️Good luck with your trading journey, I shall see you at the very top.
🎯Trade consistent, FRGNT X

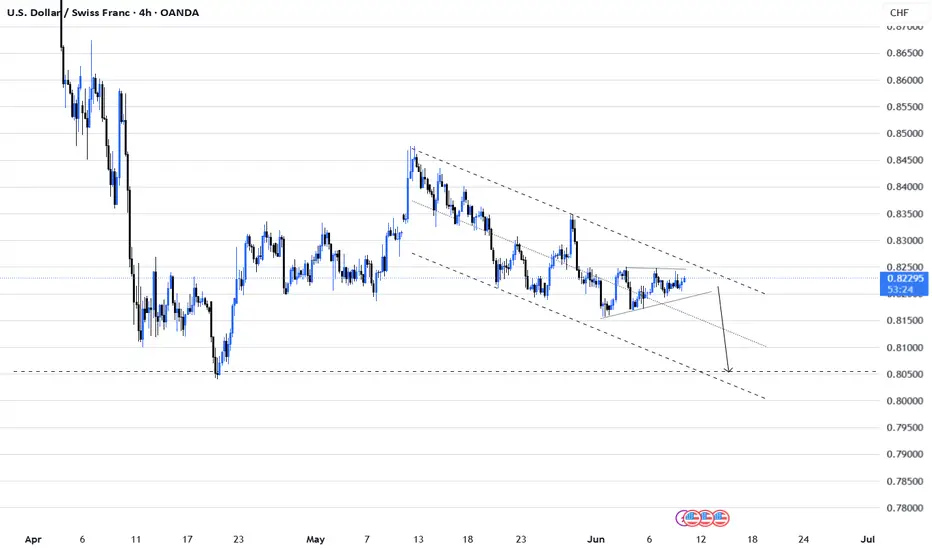
USDCHF 4HOURThe market is currently in a long- term downtrend. Some opportunity to join the trend.
However, if the market clearly breaks through that's an amazing confirmation for short.
-
-
What do you think?
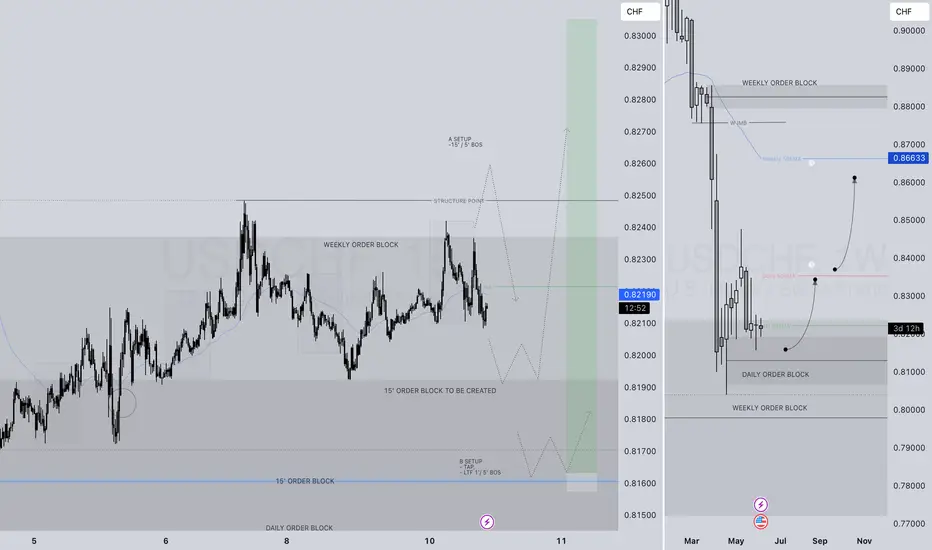
USDCHF LONG FORECAST Q2 W24 D10 Y25👀 USDCHF LONG FORECAST Q2 W24 D10 Y25
🔥HOT PICK ALERT 🔥
Professional Risk Managers👋
Welcome back to another FRGNT chart update📈
Diving into some Forex setups using predominantly higher time frame order blocks alongside intraday confirmation & breaks of structure.
Let’s see what price action is telling us today! 🔥
💡Here are some trade confluences📝
✅Weekly order block rejection
✅Daily order block rejection
✅15’ order block
✅Intraday bullish breaks of structure
🔑 Remember, to participate in trading comes always with a degree of risk, therefore as professional risk managers it remains vital that we stick to our risk management plan as well as our trading strategies.
📈The rest, we leave to the balance of probabilities.
💡Fail to plan. Plan to fail.
🏆It has always been that simple.
❤️Good luck with your trading journey, I shall see you at the very top.
🎯Trade consistent, FRGNT X
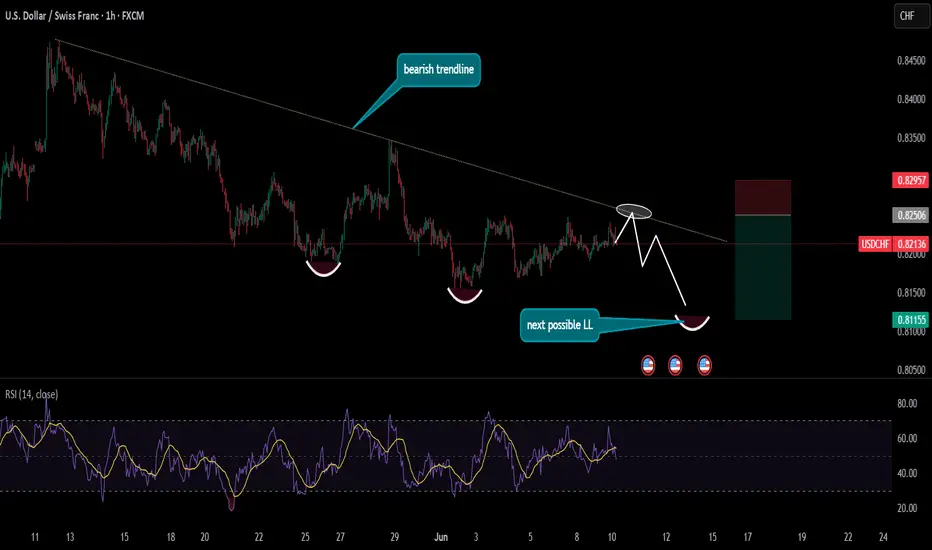
USDCHF in bearish trend price action seems quite bearish when it touches the trendline it makes new LL, right now the price is in range for some time but as soon as it hit the trendline make sure to get enter in short short trade unless some major fundamental event happensshort. For more clearance i have also opened a short position on the chart with 1:3 RR
AUD/JPY Short, EUR/JPY Short, GBP/JPY Short and USD/CHF ShortAUD/JPY Short
Minimum entry requirements:
- 1H impulse down below area of value.
- If tight non-structured 5 min continuation follows, reduced risk entry on the break of it.
- If tight structured 5 min continuation follows, reduced risk entry on the break of it or 5 min risk entry within it.
- If tight non-structured 15 min continuation follows, 5 min risk entry within it if the continuation is structured on the 5 min chart or reduced risk entry on the break of it.
- If tight structured 15 min continuation follows, reduced risk entry on the break of it or 15 min risk entry within it.
EUR/JPY Short
Minimum entry requirements:
- If structured 1H continuation forms, 1H risk entry within it.
GBP/JPY Short
Minimum entry requirements:
- If tight non-structured 1H continuation forms, 15 min risk entry within it if the continuation is structured on the 15 min chart.
- If tight structured 1H continuation forms, 1H risk entry within it.
USD/CHF Short
Minimum entry requirements:
- Corrective tap into area of value.
- 4H risk entry or 1H risk entry after 2 x 1H rejection candles.
Minimum entry requirements:
- Tap into area of value.
- 1H impulse down below area of value.
- If tight non-structured 5 min continuation follows, reduced risk entry on the break of it.
- If tight structured 5 min continuation follows, reduced risk entry on the break of it or 5 min risk entry within it.
- If tight non-structured 15 min continuation follows, 5 min risk entry within it if the continuation is structured on the 5 min chart or reduced risk entry on the break of it.
- If tight structured 15 min continuation follows, reduced risk entry on the break of it or 15 min risk entry within it.

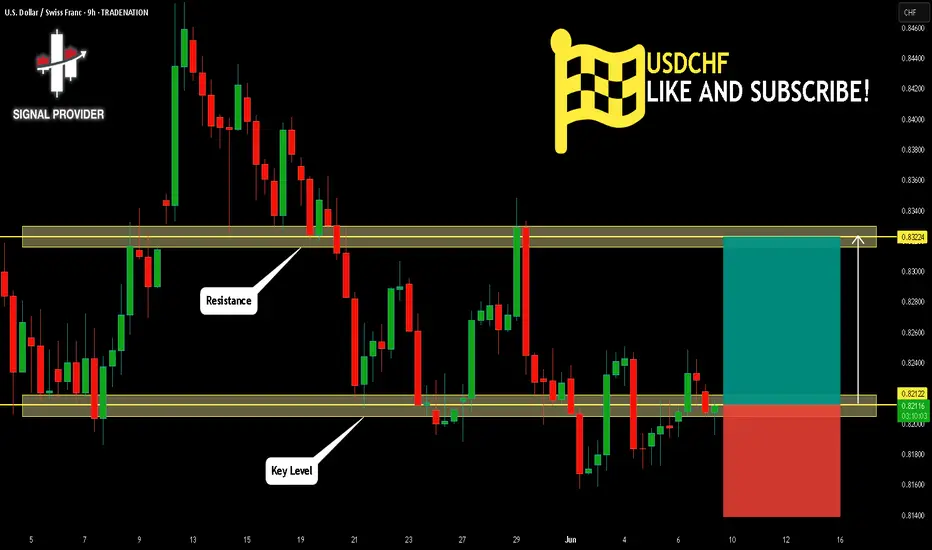
USDCHF Will Go Higher! Long!
Please, check our technical outlook for USDCHF.
Time Frame: 9h
Current Trend: Bullish
Sentiment: Oversold (based on 7-period RSI)
Forecast: Bullish
The market is testing a major horizontal structure 0.821.
Taking into consideration the structure & trend analysis, I believe that the market will reach 0.832 level soon.
P.S
The term oversold refers to a condition where an asset has traded lower in price and has the potential for a price bounce.
Overbought refers to market scenarios where the instrument is traded considerably higher than its fair value. Overvaluation is caused by market sentiments when there is positive news.
Disclosure: I am part of Trade Nation's Influencer program and receive a monthly fee for using their TradingView charts in my analysis.
Like and subscribe and comment my ideas if you enjoy them!
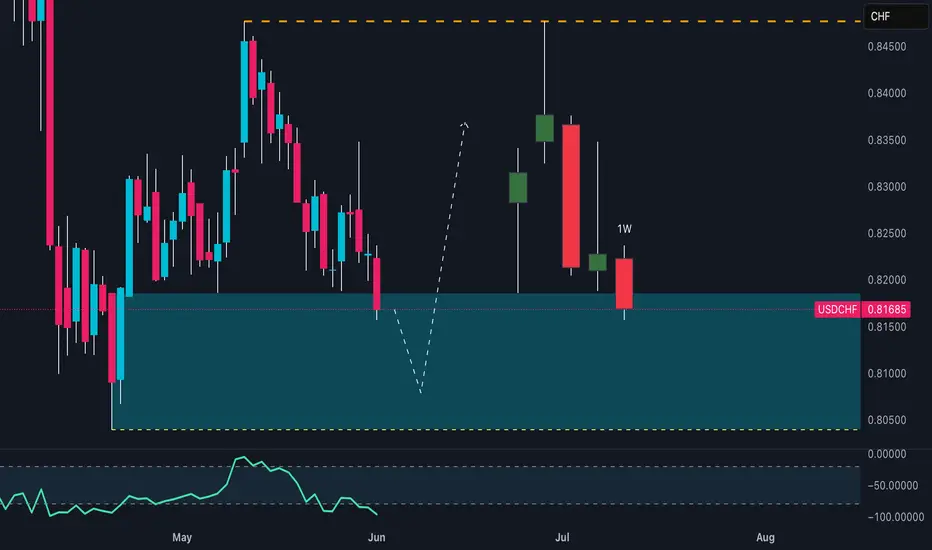
USDCHF Primed for Monster Move to 0.92? Here's Why!In today’s video, I break down a potentially strong bullish opportunity on USDCHF and why, with the right entry signal, we might see a solid push up towards 0.88 and eventually 0.92 in the weeks and months ahead.
First off, let's check the monthly chart. In April, price finally broke and closed below the major 0.84 support, a level that held firm since 2011. Below, I've marked the massive buy zone created around the 2011 lows—interestingly, depending on your broker, you’ll notice this zone was tested during the dramatic Swiss franc unpegging event back in 2015 as well.
But here's why I don’t think we’re headed down to retest that monthly zone anytime soon. Zooming into the weekly charts, we clearly see a key weekly buy zone. This was actually the origin point for the massive move up from the 2011 lows to 0.95. This exact weekly level is already proving its significance again, given the strong buying reaction we saw here in May.
Now, zooming further into the daily charts, we had a nice bounce at that weekly buy zone, pushing price back up to retest the previous support at 0.84. If the market truly wanted lower prices, we would've seen a sharp sell-off from there. Instead, price has slowly been grinding lower, forming a clear W double-bottom pattern—a powerful reversal signal.
This all points to higher prices ahead, especially considering USDCHF currently offers one of the most attractive swap carry opportunities due to the interest rate differentials and the SNB’s hints about possibly returning to negative rates to weaken the franc.
Here's my game plan:
Wait patiently for the next bullish daily candle with a clear close above 0.83.
My first target will be the 0.88 area (previous strong resistance and weekly sell zone).
The longer-term target will be around the 0.92 resistance zone.
My stop loss will be placed comfortably below 0.80. Should we spike lower to that level, I'll remain alert for another high-probability bullish entry signal.
Let me know your thoughts below!

PREPPING FOR LONGSUSD/CHF 1H - It will be interesting to see whether or not this area of Demand holds and whether we have means to enter in on this market with some long positions, taking advantage of the corrective wave that should trade price up and into the Supply Zone above.
Once we have clear rejection from the zone price is currently trading into, delivering us with some fractal breaks I will be using that to build on my confluence and I will be looking for some entries on the market.
I want to see the last fractal high that traded price down and into that Demand Zone break, telling us that enough Demand has been introduced to now flip the balance, once we have that we can look to take part.
The potential trade here could be huge, its important we just wait patiently and sit on our hands, allowing price to come to us. Once I have the confirmation I need I will let you all know.
Sell USDCHFI'm analyzing USDCHF and on the 4-hour timeframe, the overall market is in an downtrend. In the 1-hour timeframe, a minor uptrend has been broken, and the price looks ready to align with the overall uptrend. If the market crosses my alert level, I’ll look for a sell opportunity.

USD/CHF Setup Breaking Down: Don’t Get Caught Long This TrapUSD/CHF is currently trading at a critical technical and macro-structural juncture. Price is hovering within the weekly support area between 0.8050 and 0.8200, a zone that has historically triggered significant bullish reactions. However, the latest weekly candle closed below the psychological 0.8200 level, showing a clear rejection of upper resistance and signaling a lack of buying strength on the U.S. dollar side. This weak closure undermines the bullish structure and opens the door for a potential continuation of the downtrend—especially if price breaks below the 0.8150 mark on the daily or H4 timeframe.
From a seasonal standpoint, June has historically been a bearish month for USD/CHF. Monthly average returns over the past 20, 15, 10, and 5 years confirm steady downside pressure on the dollar against the Swiss franc. Only the 2-year average shows a slight positive bias, but it remains an outlier against the broader seasonal trend. This supports the idea that the recent weakness is not only technical but also cyclical in nature.
The Commitment of Traders (COT) report reinforces this bearish view. On the Swiss franc side, commercial traders (typically the most informed and hedging-oriented participants) are heavily net long, while non-commercial traders (speculators) remain significantly net short. This imbalance is often seen around reversal points and may indicate rising CHF strength. On the U.S. dollar side, positioning is far more balanced—the Dollar Index COT shows a neutral stance, with non-commercials slightly net long but without any dominant momentum. This confirms there’s currently no structural strength behind the dollar to justify a meaningful rebound in USD/CHF.
Lastly, retail sentiment provides a classic contrarian signal: over 90% of retail traders are long on USD/CHF, with only 10% short. This extreme imbalance typically occurs ahead of bearish breakdowns, as institutional players tend to fade overcrowded retail positions.
In conclusion, USD/CHF remains vulnerable to further downside. The weekly price action is weak, seasonal trends are dollar-negative, COT positioning favors CHF strength, and retail sentiment is extremely long-biased. All factors align toward a likely bearish continuation, with technical targets in the 0.8080–0.8050 range. The only alternative scenario would require a strong H4/H1 bullish reaction with a reclaim of 0.8220—but at this stage, that appears unlikely without a major macro catalyst.
USD/CHF💰Symbol: { USD/CHF }
🟩Price: { 0.82174 }
🟥Stop: { 0.82385 }
1️⃣profit: { 0.81707 }
2️⃣profit: { 0.81300 }
3️⃣profit: { 0.81000 }
&
🟩Price: { 0.82455 }
🟥Stop: { 0.82936 }
1️⃣profit: { 0.82200 }
2️⃣profit: { 0.81707 }
3️⃣profit: { 0.81300 }
4️⃣profit: { 0.81000 }
📊Check your chart before entering.
🚨Check before use to make sure there is no important news.🚨
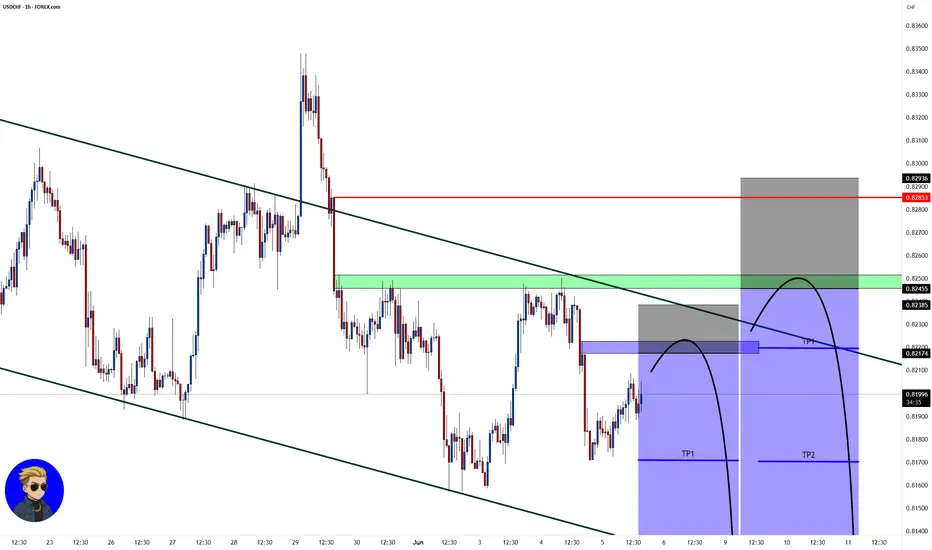
USD/CHF..30M chart pattern.Here’s the breakdown of MY USD/CHF Long Trade Setup:
📈 Trade Idea (Long USD/CHF)
Entry: 0.82140
1st Target: 0.82400
2nd Target: 0.82650
Stop Loss: Not specified ⚠️
🧮 Trade Metrics
Target Pips Gain % Gain (Approx)
1st Target +26 pips +0.32%
2nd Target +51 pips +0.62%
⚠️ Risk Consideration:
No stop loss provided — without it, risk/reward can’t be calculated.
A stop loss around 0.8180–0.8190 might make sense depending on recent support levels.
✅ Summary:
Clean setup with small but realistic targets.
Reward-to-risk will likely be favorable if you use a stop below 0.8190.
Would you like help identifying a technical stop loss or creating a table of your full trade plan (including BTC, gold, and USDCHF)?
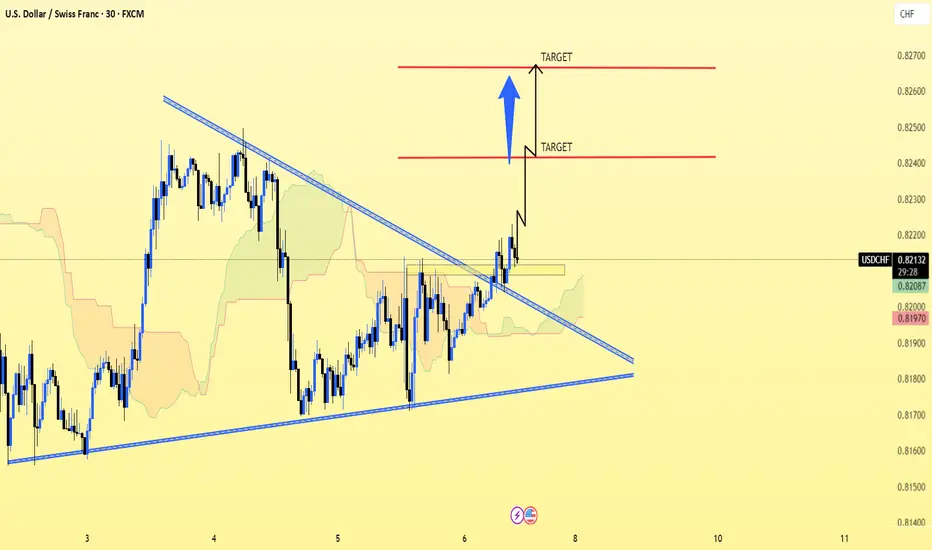
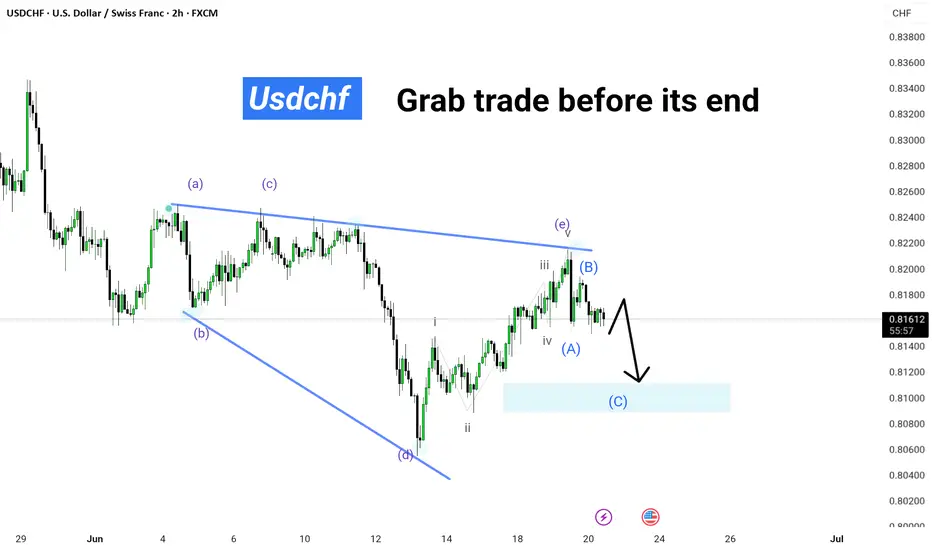
USDCHF || Grab trade before its end" – Upgrade Suggestions:" USDCHF correcting into demand zone 📉 Wave (C) incoming! Watch for the final leg before the reversal. Don’t miss this precision setup. 💥 #ElliottWave #USDCHF #ForexSetup"
🟢 Technical Breakdown:
Triangle Formation (ABCDE) completed near the top.
Price action shows a breakdown from Wave (B), suggesting a corrective leg is underway.
You’ve marked:
Wave (A) and (B) already formed.
Wave (C) is expected to reach the highlighted demand zone (blue box around 0.81000).
The current price is around 0.81633, indicating an ideal entry area for a short setup targeting the blue zone.
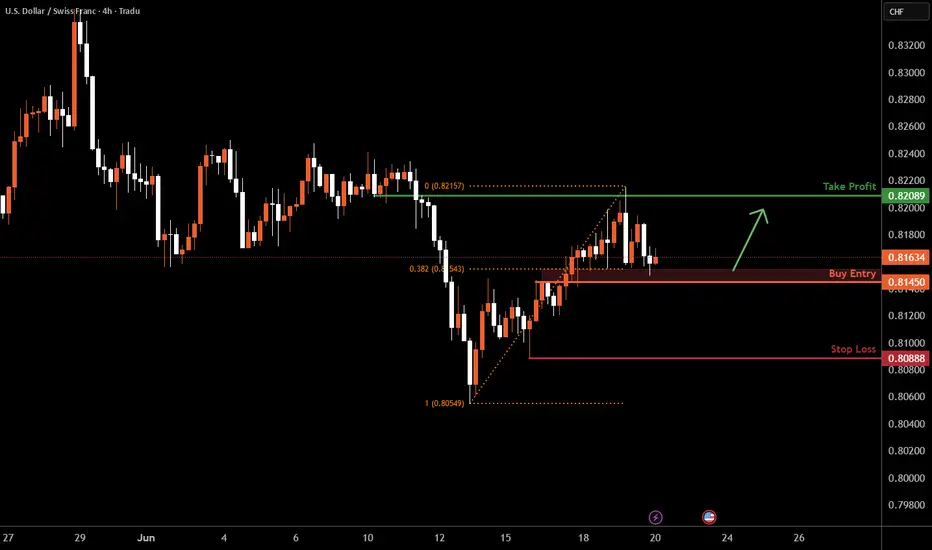
USDCHF H4 I Bullish Bounce Off the 50% FibBased on the H4 chart analysis, we can see that the price is falling toward our buy entry at 0.8145, which is an overlap support that aligns closely with the 38.2% Fib retracement.
Our take profit will be at 0.8208, an overlap resistance level.
The stop loss will be placed at 0.8088, which is a swing high low level.
High Risk Investment Warning
Trading Forex/CFDs on margin carries a high level of risk and may not be suitable for all investors. Leverage can work against you.
Stratos Markets Limited (tradu.com ):
CFDs are complex instruments and come with a high risk of losing money rapidly due to leverage. 63% of retail investor accounts lose money when trading CFDs with this provider. You should consider whether you understand how CFDs work and whether you can afford to take the high risk of losing your money.
Stratos Europe Ltd (tradu.com ):
CFDs are complex instruments and come with a high risk of losing money rapidly due to leverage. 63% of retail investor accounts lose money when trading CFDs with this provider. You should consider whether you understand how CFDs work and whether you can afford to take the high risk of losing your money.
Stratos Global LLC (tradu.com ):
Losses can exceed deposits.
Please be advised that the information presented on TradingView is provided to Tradu (‘Company’, ‘we’) by a third-party provider (‘TFA Global Pte Ltd’). Please be reminded that you are solely responsible for the trading decisions on your account. There is a very high degree of risk involved in trading. Any information and/or content is intended entirely for research, educational and informational purposes only and does not constitute investment or consultation advice or investment strategy. The information is not tailored to the investment needs of any specific person and therefore does not involve a consideration of any of the investment objectives, financial situation or needs of any viewer that may receive it. Kindly also note that past performance is not a reliable indicator of future results. Actual results may differ materially from those anticipated in forward-looking or past performance statements. We assume no liability as to the accuracy or completeness of any of the information and/or content provided herein and the Company cannot be held responsible for any omission, mistake nor for any loss or damage including without limitation to any loss of profit which may arise from reliance on any information supplied by TFA Global Pte Ltd.
The speaker(s) is neither an employee, agent nor representative of Tradu and is therefore acting independently. The opinions given are their own, constitute general market commentary, and do not constitute the opinion or advice of Tradu or any form of personal or investment advice. Tradu neither endorses nor guarantees offerings of third-party speakers, nor is Tradu responsible for the content, veracity or opinions of third-party speakers, presenters or participants.
USDCHF 19/06/2025Weekly:
-Bearish W pattern.
-IC.
Daily:
-Bearish W pattern.
-Previous day high liquidity sweep.
4H:
-Liquidity sweep.
-FVG.
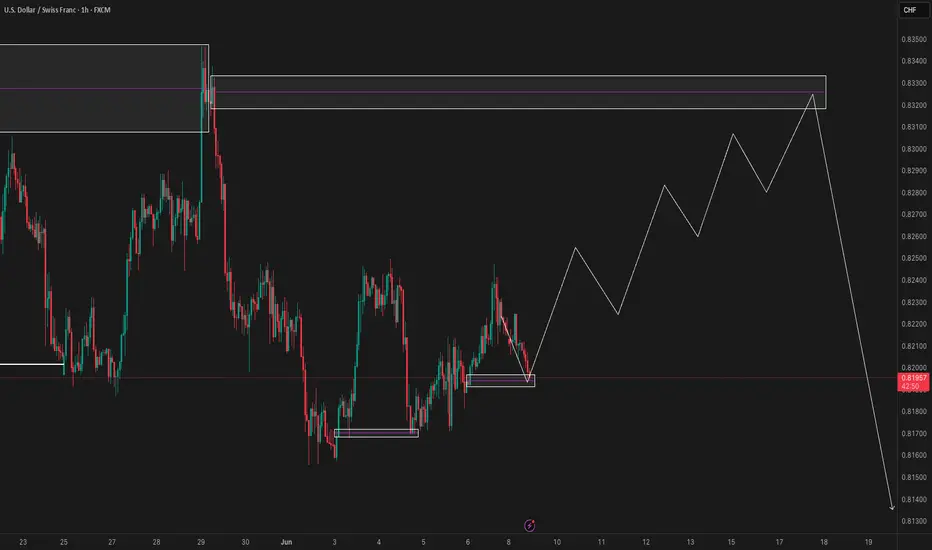
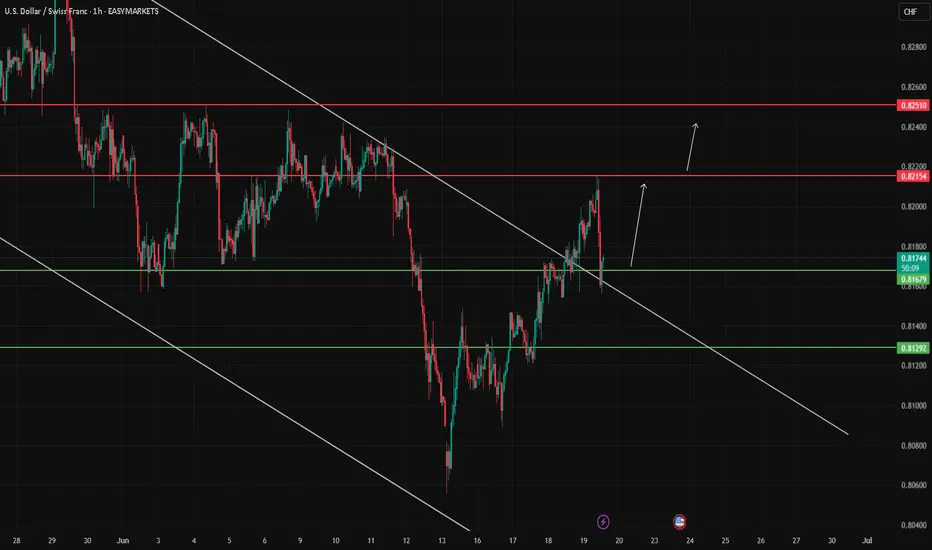
USD/CHF Breaks Channel USD/CHF has broken out of its descending channel and successfully retested the broken trendline.
Now trading above key support at 0.81679 – 0.81750, the pair may continue upward if this zone holds.
Bullish targets lie at 0.82154 and 0.82510.
A break below 0.81292 would invalidate this scenario and expose downside risk.
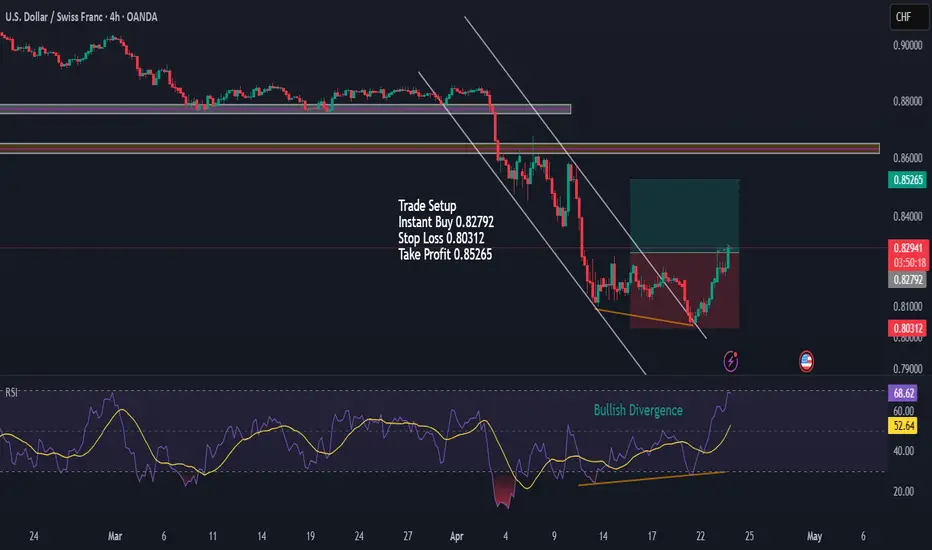
USDCHF BULLISHTrade Setup Details for USD/CHF (4H Chart)
Overview
Pair: USD/CHF (US Dollar / Swiss Franc)
Timeframe: 4H (4-hour chart)
Date of Analysis: April 23, 2022
Current Price: 0.82920 (as shown on the chart)
Market Sentiment: Bullish (indicated by "Bullish Divergence" on the RSI)
Trade Setup
Trade Type: Buy
Entry Point: 0.82792
The entry is marked just above the recent low, suggesting a potential reversal after the price broke below a descending trendline and retested a key support zone around 0.82790–0.82960.
Stop Loss: 0.80312
The stop loss is placed below the recent swing low, providing a buffer against further downside. This gives a risk of approximately 248 pips from the entry point.
Take Profit: 0.85265
The take profit is set at a key resistance level, aligning with previous highs around 0.85265. This offers a potential reward of approximately 247 pips from the entry point.
Risk-to-Reward Ratio: Approximately 1:1 (247 pips reward / 248 pips risk)
Technical Analysis
Price Action: The price has been in a downtrend, as indicated by the descending trendline. However, a break below this trendline followed by a retest suggests a potential reversal. The price is now approaching a key support zone between 0.82790 and 0.82960.
Support/Resistance:
Support: 0.82790–0.82960 (recent price action shows a bounce from this zone).
Resistance: 0.85265 (previous high, marked as the take profit level).
Indicators:
RSI (Relative Strength Index): The RSI is at 52.61, showing neutral momentum. However, a "Bullish Divergence" is noted, where the price made a lower low, but the RSI formed a higher low, indicating weakening bearish momentum and a potential reversal.
The RSI is also trending upward, supporting the bullish outlook.
Trendline: The descending trendline (drawn on the chart) has been broken, and the price is retesting this breakout area, which often acts as support after a breakout.
Trade Rationale
The setup is based on a combination of price action and technical indicators:
The break of the descending trendline suggests the downtrend may be losing steam.
Bullish divergence on the RSI indicates a potential reversal, as momentum shifts in favor of buyers.
The price is approaching a key support zone, which has historically held, increasing the likelihood of a bounce.
The take profit at 0.85265 aligns with a significant resistance level, providing a logical target for the trade.
Risk Management
The stop loss at 0.80312 ensures that the trade is invalidated if the price continues to decline significantly, protecting against larger losses.
Traders should consider position sizing to ensure the 248-pip risk aligns with their risk tolerance (e.g., risking 1–2% of their account on this trade).
Additional Notes
Monitor for confirmation of the reversal, such as a strong bullish candlestick pattern (e.g., engulfing or pin bar) at the support zone.
Be cautious of any fundamental news (e.g., US or Swiss economic data) that could impact USD/CHF volatility during the trade.
USDCHF Continuation of Sells Price is very bearish & trend is your friend,we have a unmitigated zone on our 1hr,I’d say this is a b+ trade