USDCHF Continuation of Sells Price is very bearish & trend is your friend,we have a unmitigated zone on our 1hr,I’d say this is a b+ trade
CHFUSD trade ideas
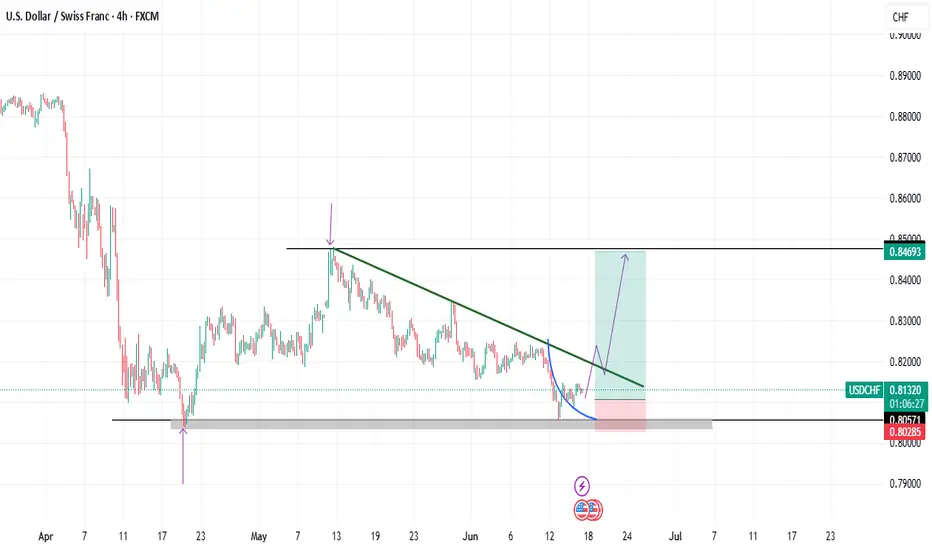
trend line breakout trend line brekout trade when the price retraces take a position when u see bullish candle

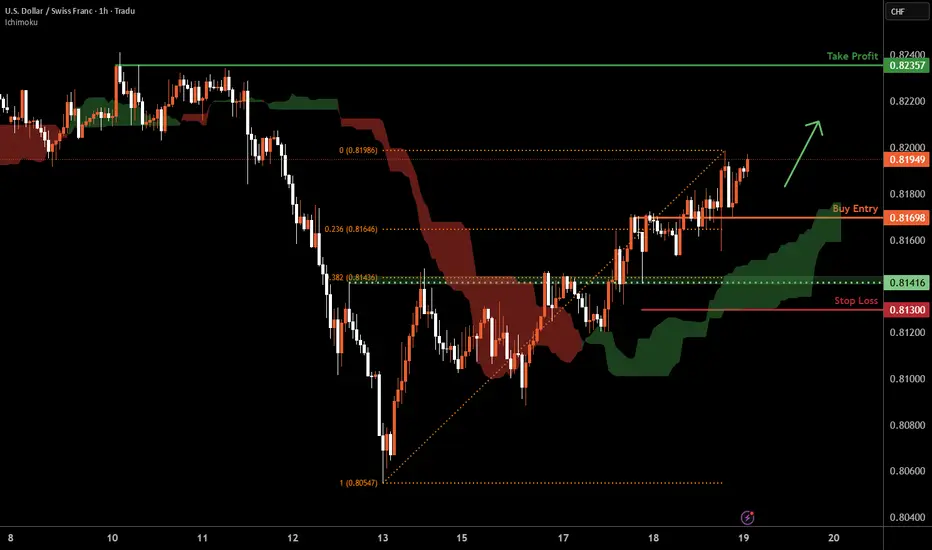
USD/CHF H1 | Upward trajectory to extend higher?USD/CHF could fall towards an overlap support and potentially bounce off this level to climb higher.
Buy entry is at 0.8169 which is an overlap support that aligns with the 23.6% Fibonacci retracement.
Stop loss is at 0.8130 which is a level that lies underneath an overlap support and the 38.2% Fibonacci retracement.
Take profit is at 0.8235 which is a multi-swing-high resistance.
High Risk Investment Warning
Trading Forex/CFDs on margin carries a high level of risk and may not be suitable for all investors. Leverage can work against you.
Stratos Markets Limited (tradu.com ):
CFDs are complex instruments and come with a high risk of losing money rapidly due to leverage. 63% of retail investor accounts lose money when trading CFDs with this provider. You should consider whether you understand how CFDs work and whether you can afford to take the high risk of losing your money.
Stratos Europe Ltd (tradu.com ):
CFDs are complex instruments and come with a high risk of losing money rapidly due to leverage. 63% of retail investor accounts lose money when trading CFDs with this provider. You should consider whether you understand how CFDs work and whether you can afford to take the high risk of losing your money.
Stratos Global LLC (tradu.com ):
Losses can exceed deposits.
Please be advised that the information presented on TradingView is provided to Tradu (‘Company’, ‘we’) by a third-party provider (‘TFA Global Pte Ltd’). Please be reminded that you are solely responsible for the trading decisions on your account. There is a very high degree of risk involved in trading. Any information and/or content is intended entirely for research, educational and informational purposes only and does not constitute investment or consultation advice or investment strategy. The information is not tailored to the investment needs of any specific person and therefore does not involve a consideration of any of the investment objectives, financial situation or needs of any viewer that may receive it. Kindly also note that past performance is not a reliable indicator of future results. Actual results may differ materially from those anticipated in forward-looking or past performance statements. We assume no liability as to the accuracy or completeness of any of the information and/or content provided herein and the Company cannot be held responsible for any omission, mistake nor for any loss or damage including without limitation to any loss of profit which may arise from reliance on any information supplied by TFA Global Pte Ltd.
The speaker(s) is neither an employee, agent nor representative of Tradu and is therefore acting independently. The opinions given are their own, constitute general market commentary, and do not constitute the opinion or advice of Tradu or any form of personal or investment advice. Tradu neither endorses nor guarantees offerings of third-party speakers, nor is Tradu responsible for the content, veracity or opinions of third-party speakers, presenters or participants.
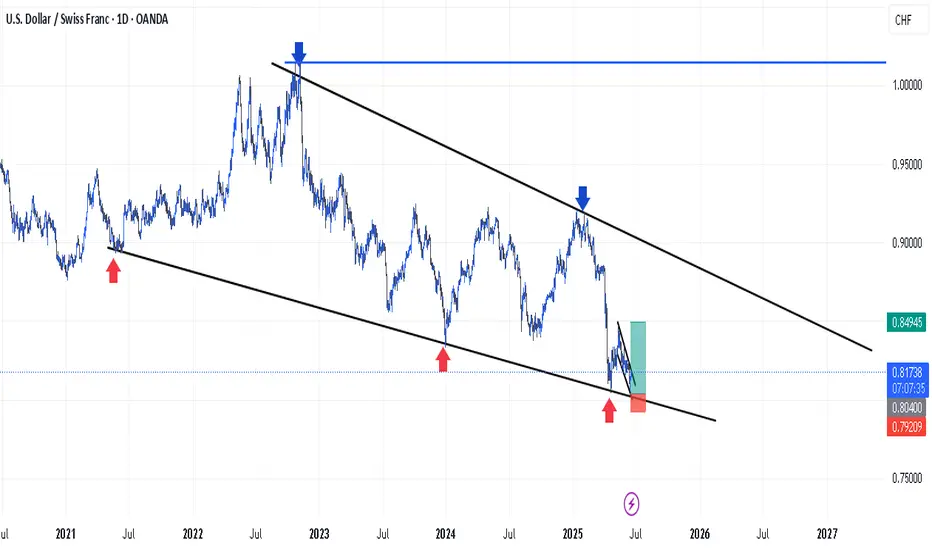
USDCHF OUTLOOK - SWING SETUPExpecting a bullish dollar in the next few months, which in turn will be bullish for USDCHF.
Note: ****I forgot to publish/share the trade setup after annotation.
"May fortune attend thee, and thy trade prosper." .......L2Earned

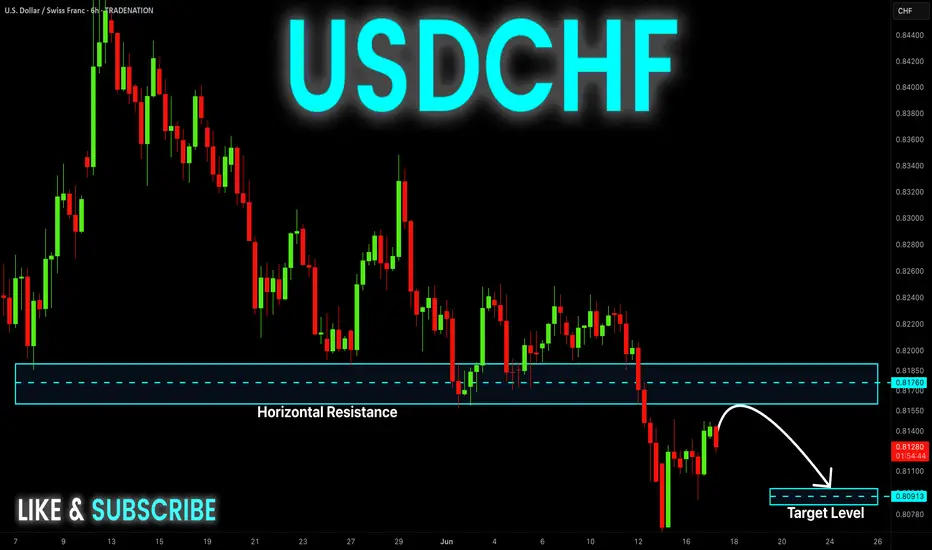
USDCHFIs USDCHF on the rise? 📈 Don't be fooled by the calm, this currency pair is keeping us all on edge. Keep a close watch and stay ahead of the game with these tips
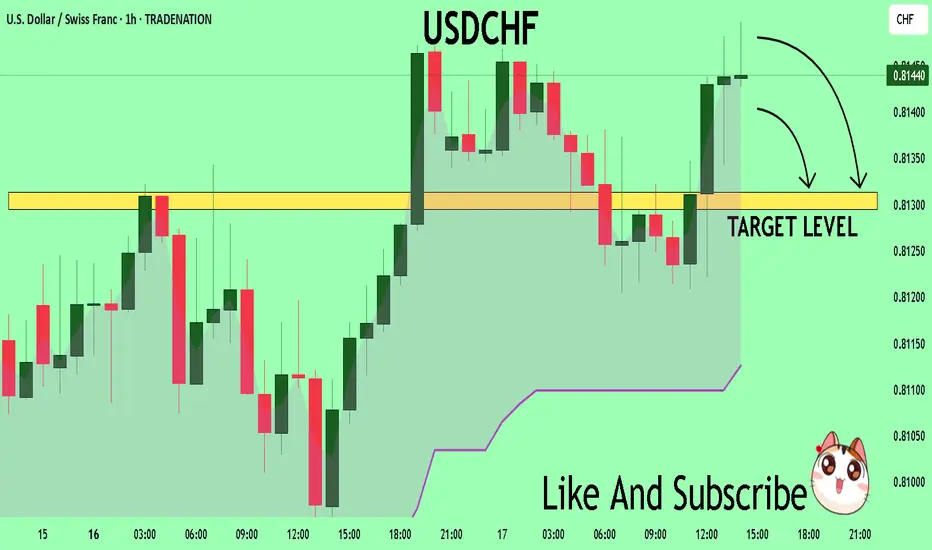
USDCHF My Opinion! SELL!
My dear followers,
I analysed this chart on USDCHF and concluded the following:
The market is trading on 0.8147 pivot level.
Bias - Bearish
Technical Indicators: Both Super Trend & Pivot HL indicate a highly probable Bearish continuation.
Target - 0.8131
About Used Indicators:
A super-trend indicator is plotted on either above or below the closing price to signal a buy or sell. The indicator changes color, based on whether or not you should be buying. If the super-trend indicator moves below the closing price, the indicator turns green, and it signals an entry point or points to buy.
Disclosure: I am part of Trade Nation's Influencer program and receive a monthly fee for using their TradingView charts in my analysis.
———————————
WISH YOU ALL LUCK
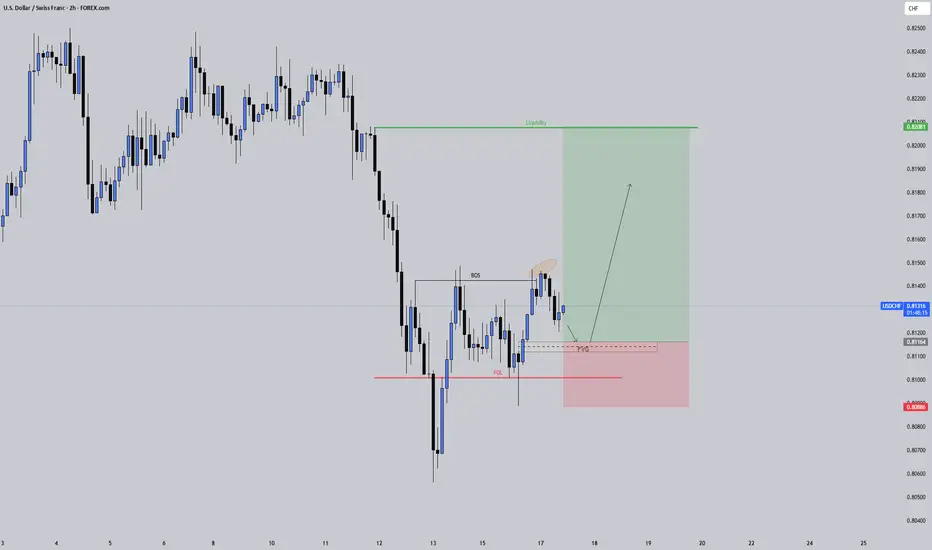
USDCHF: Up for a ride?What we just saw on USDCHF is a classic move that catches many traders off guard:
Price swept the Previous Day’s Low (PDL)
That’s where most retail traders get stopped out.
It’s also where smart money often steps in.
Break of Structure (BOS) followed immediately
A clean shift in direction.
Momentum flipped bullish.
Fair Value Gap (FVG) below
That’s likely where price will return to rebalance.
If price respects that zone, the next destination?
The liquidity resting above.
This is one of those setups that reminds me:
It’s not about catching every move. It’s about understanding why the move happened.
Let’s see how it plays out.
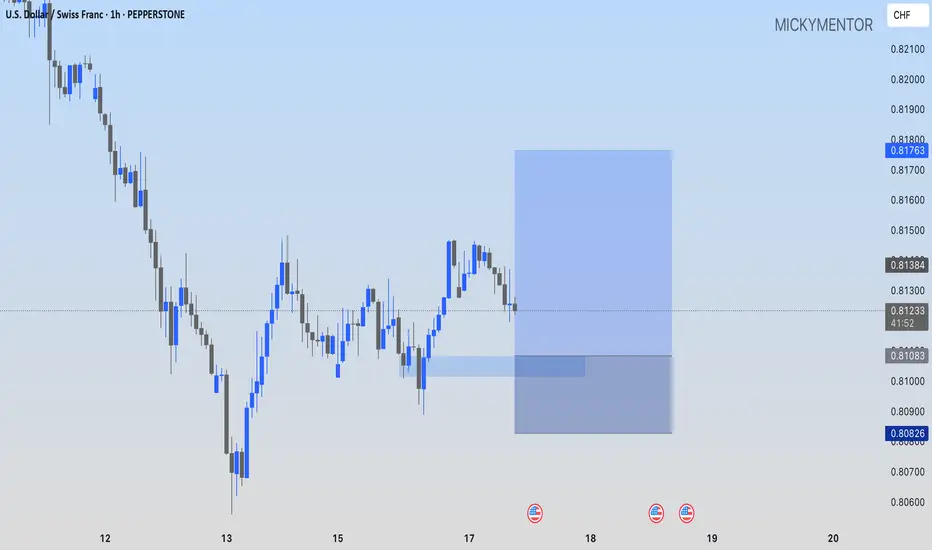
USDCHF: I'M GOING LONG AT 0.81083!!PEPPERSTONE:USDCHF I'm going long at 0.81083, looking at the 0.81763 as my target.
USD-CHF Bearish Bias! Sell!
Hello,Traders!
USD-CHF is trading in a
Downtrend and the pair
Is making a local bullish
Pullback but will soon
Hit a horizontal resistance
Level around 0.8185
So we are bearish biased
And we will be expecting
A further bearish move down
Sell!
Comment and subscribe to help us grow!
Check out other forecasts below too!
Disclosure: I am part of Trade Nation's Influencer program and receive a monthly fee for using their TradingView charts in my analysis.
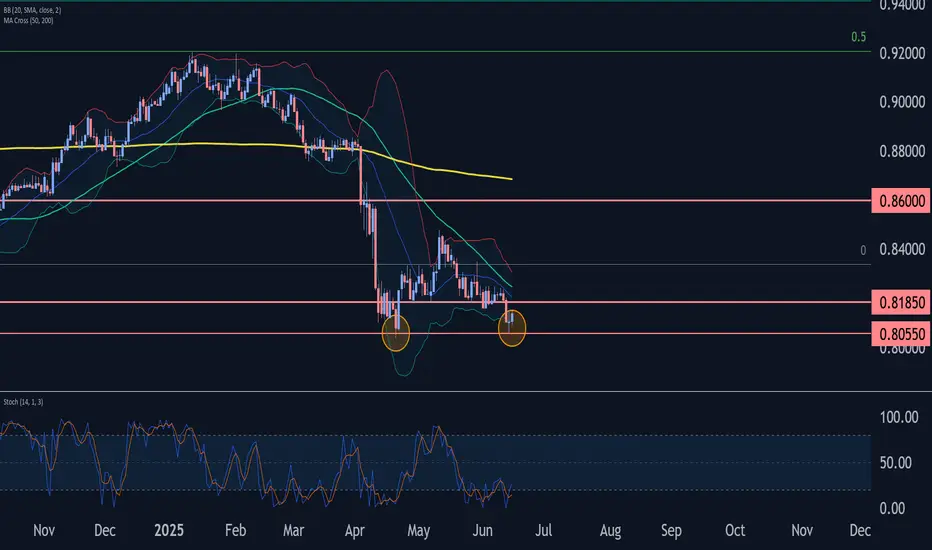
USDCHF Wave Analysis – 16 June 2025
- USDCHF reversed from key support level 0.8055
- Likely to rise to resistance level 0.8185
USDCHF currency pair recently reversed up from the key support level 0.8055, which stopped the previous impulse wave (1) at the end of April.
The support zone near the support level 0.8055 was strengthened by the lower daily Bollinger Band.
Given the oversold daily Stochastic, USDCHF currency pair can be expected to rise to the next resistance level 0.8185 (former support from May and the start of June).
USDCHF oversold rally capped by resistance at 0.8166The USD/CHF pair is currently trading with a bearish bias, aligned with the broader downward trend. Recent price action shows a corrective pullback, suggesting a temporary relief rally within the downtrend.
Key resistance is located at 0.8166, a prior consolidation zone. This level will be critical in determining the next directional move.
A bearish rejection from 0.8166 could confirm the resumption of the downtrend, targeting the next support levels at 0.8033, followed by 0.7990 and 0.7950 over a longer timeframe.
Conversely, a decisive breakout and daily close above 0.8166 would invalidate the current bearish setup, shifting sentiment to bullish and potentially triggering a move towards 0.8190, then 0.8220.
Conclusion:
The short-term outlook remains bearish unless the pair breaks and holds above 0.8166. Traders should watch for price action signals around this key level to confirm direction. A rejection favors fresh downside continuation, while a breakout signals a potential trend reversal or deeper correction.
This communication is for informational purposes only and should not be viewed as any form of recommendation as to a particular course of action or as investment advice. It is not intended as an offer or solicitation for the purchase or sale of any financial instrument or as an official confirmation of any transaction. Opinions, estimates and assumptions expressed herein are made as of the date of this communication and are subject to change without notice. This communication has been prepared based upon information, including market prices, data and other information, believed to be reliable; however, Trade Nation does not warrant its completeness or accuracy. All market prices and market data contained in or attached to this communication are indicative and subject to change without notice.

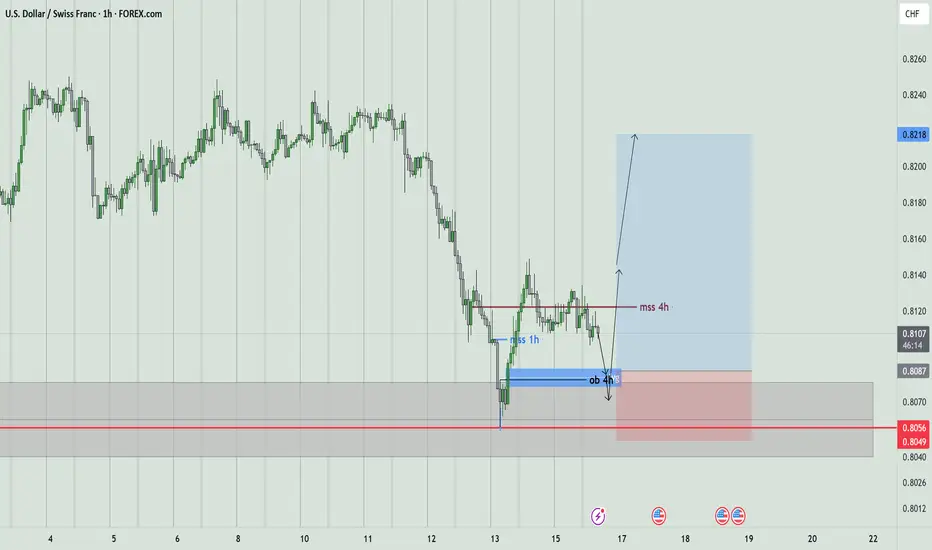
USDCHF 1:3USDCHF WAIT FOR FVG OB ENTRY 1:3.4
it's time to the buy udsdchf i think personility not for you dhe buy or sell but
i think usdchf touch last week ob HTF and market structur 4h its break and now wait for fvg or ob 4h and buy and going to tp in ob daily or 4h
USDCHF TRADE SETUPWait for retest the entry level then take a trade for Sell otherwise skip this setup

UsdchfUsdchf have been on a down trend and we are expecting a high possibility retracment to the upside probably to the measure resistance but we will be stopping at the next zone then we wait for a break out from that zone if the isnno reaction of a buy continuation we wait and continue bearish

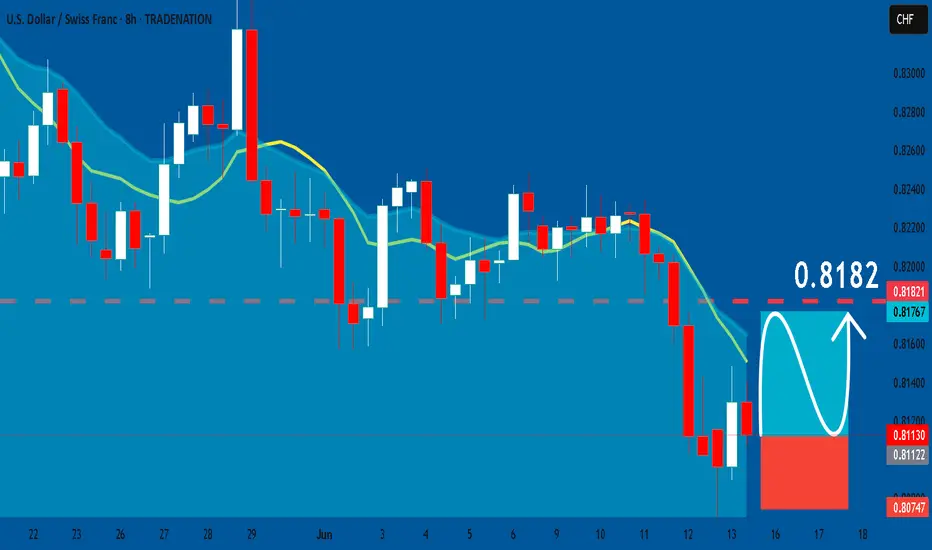
USDCHF: Bullish Continuation & Long Signal
USDCHF
- Classic bullish setup
- Our team expects bullish continuation
SUGGESTED TRADE:
Swing Trade
Long USDCHF
Entry Point - 0.8113
Stop Loss - 0.8074
Take Profit - 0.8182
Our Risk - 1%
Start protection of your profits from lower levels
Disclosure: I am part of Trade Nation's Influencer program and receive a monthly fee for using their TradingView charts in my analysis.
❤️ Please, support our work with like & comment! ❤️
USDCHF Holding Support – Eyes on Trendline RejectionUSDCHF is respecting a key 1D support zone around 0.8100, showing some reaction after a strong downtrend.
• 1D Chart: Testing horizontal support and trendline from Jan-May range.
• 4H Chart: Weak reaction so far – no strong bullish candles yet.
• 1H & 23m Chart: Retesting small 1H order block structure.
Key Zones:
• Support: 0.8080–0.8100
• Resistance: 0.8160 / 0.8210
Bias: Watching for bullish reversal signals. Otherwise, continuation lower below 0.8080.

USDCHF long ideaUSDCHF long idea flag pattern and support zone retest h1 IM expecting to price go up and retest resistance area if resistance area will break succesefully then it can continue to go up to marked zones

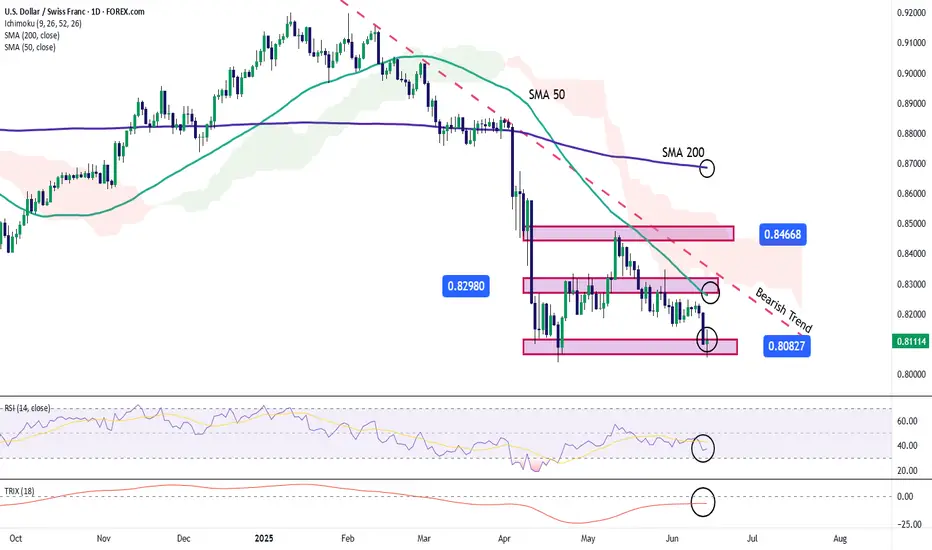
USD/CHF Hits Critical Support LevelsOver the last three trading sessions, USD/CHF has declined more than 1.5%, as a consistent bearish bias persists, pushing the pair back to multi-month lows. Selling pressure has remained firm amid uncertainty surrounding the escalation of political and military tensions in the Middle East. So far, the U.S. dollar has failed to act as a safe haven, while the Swiss franc has maintained its strength, reinforcing the current bearish trend. If this downward momentum continues, the selling trend could become even more dominant.
Consistent Bearish Trend
Since the beginning of the year, USD/CHF has shown consistent selling swings, leading to the formation of a strong downtrend in recent weeks. Currently, the selling pressure has been strong enough to drive the pair back to recent lows, and if the bearish momentum continues below this level, the downward trend may gain further relevance. In the absence of any significant bullish corrections, the bearish trend remains the dominant pattern in the short term.
RSI
The RSI line continues to move below the 50 level, indicating that selling impulses remain dominant in recent sessions. As long as RSI remains below the neutral zone, the bearish momentum is likely to persist.
TRIX
The TRIX line has been oscillating below the neutral level of 0, suggesting that the average strength of the exponential moving averages still reflects a bearish market bias. This may indicate that the current downtrend still has room to continue in the near term.
However, it is important to note that the price is currently sitting at a key support zone, which could serve as a launch point for potential bullish corrections in the upcoming sessions.
Key Levels to Watch:
0.84668 – Major Resistance: This level marks the recent high reached in past months. If buying momentum pushes the pair back up to this level, it may pose a threat to the current downtrend and trigger a more relevant bullish move.
0.82980 – Short-Term Barrier: This level aligns with the 50-period moving average. Bullish moves above this point could challenge the current bearish formation and introduce a neutral short-term bias.
0.80827 – Key Support: This level aligns with the chart’s recent lows. While it may trigger upside corrections, a break below it could reactivate significant selling pressure in upcoming sessions.
Written by Julian Pineda, CFA – Market Analyst
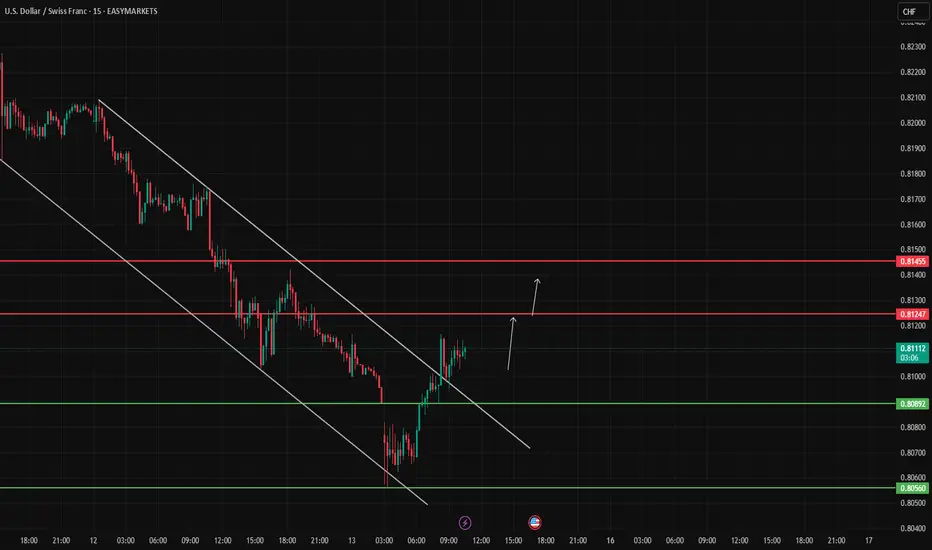
USD/CHF TrendUSD/CHF has successfully broken out of the descending channel on the 15-minute timeframe, signaling a potential short-term trend reversal. The price is now consolidating above the broken channel, showing early signs of bullish momentum. As long as the price remains above 0.8110, further upside toward the resistance levels at 0.8125 and 0.8145 is expected. A break below 0.8089 would invalidate this bullish scenario and suggest a return to the previous downtrend.
USD/CHF H1 | Pullback resistance at 38.2% Fibonacci retracementUSD/CHF is rising towards a pullback resistance and could potentially reverse off this level to drop lower.
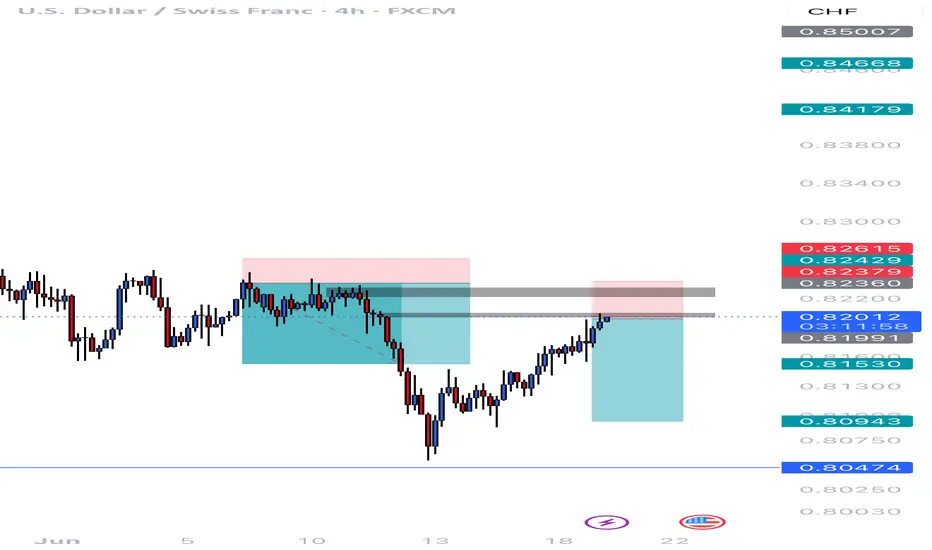
Sell entry is at 0.8189 which is a pullback resistance that aligns with the 38.2% Fibonacci retracement.
Stop loss is at 0.8212 which is a level that sits above the 61.8% Fibonacci retracement and an overlap resistance.
Take profit is at 0.8156 which is a multi-swing-low support.
High Risk Investment Warning
Trading Forex/CFDs on margin carries a high level of risk and may not be suitable for all investors. Leverage can work against you.
Stratos Markets Limited (tradu.com ):
CFDs are complex instruments and come with a high risk of losing money rapidly due to leverage. 63% of retail investor accounts lose money when trading CFDs with this provider. You should consider whether you understand how CFDs work and whether you can afford to take the high risk of losing your money.
Stratos Europe Ltd (tradu.com ):
CFDs are complex instruments and come with a high risk of losing money rapidly due to leverage. 63% of retail investor accounts lose money when trading CFDs with this provider. You should consider whether you understand how CFDs work and whether you can afford to take the high risk of losing your money.
Stratos Global LLC (tradu.com ):
Losses can exceed deposits.
Please be advised that the information presented on TradingView is provided to Tradu (‘Company’, ‘we’) by a third-party provider (‘TFA Global Pte Ltd’). Please be reminded that you are solely responsible for the trading decisions on your account. There is a very high degree of risk involved in trading. Any information and/or content is intended entirely for research, educational and informational purposes only and does not constitute investment or consultation advice or investment strategy. The information is not tailored to the investment needs of any specific person and therefore does not involve a consideration of any of the investment objectives, financial situation or needs of any viewer that may receive it. Kindly also note that past performance is not a reliable indicator of future results. Actual results may differ materially from those anticipated in forward-looking or past performance statements. We assume no liability as to the accuracy or completeness of any of the information and/or content provided herein and the Company cannot be held responsible for any omission, mistake nor for any loss or damage including without limitation to any loss of profit which may arise from reliance on any information supplied by TFA Global Pte Ltd.
The speaker(s) is neither an employee, agent nor representative of Tradu and is therefore acting independently. The opinions given are their own, constitute general market commentary, and do not constitute the opinion or advice of Tradu or any form of personal or investment advice. Tradu neither endorses nor guarantees offerings of third-party speakers, nor is Tradu responsible for the content, veracity or opinions of third-party speakers, presenters or participants.

