CHFUSD trade ideas

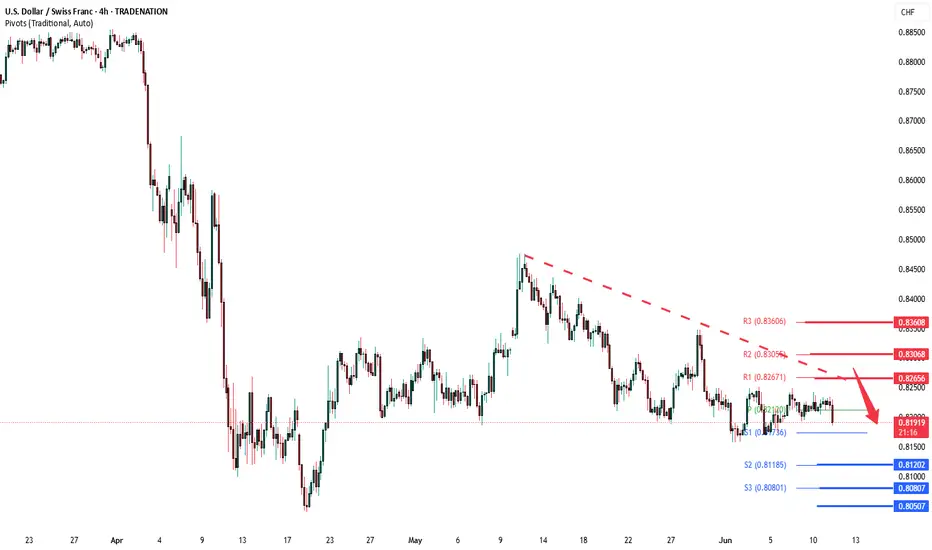
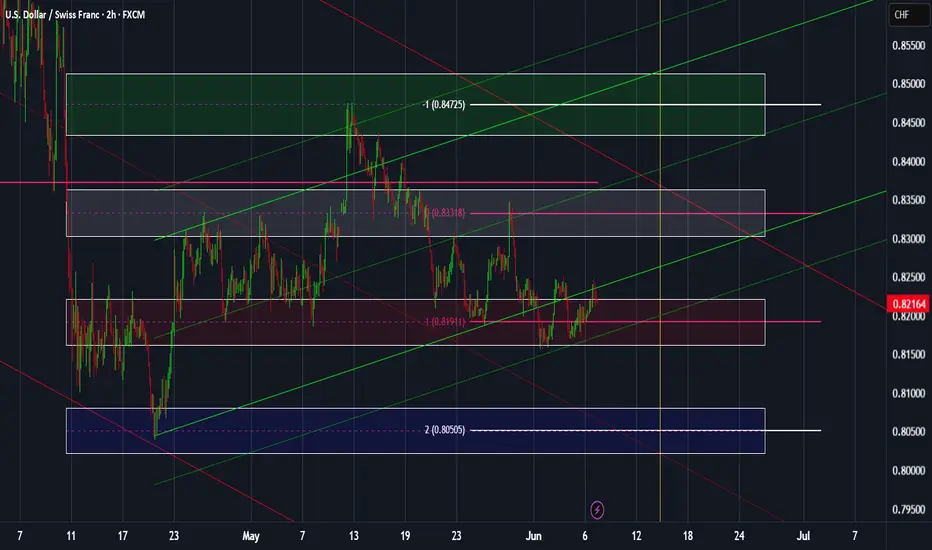
USDCHF INTRADAY Bearish bias supported below 0.8265The USDCHF currency pair maintains a bearish bias, consistent with the prevailing downtrend. Current price action is showing signs of sideways consolidation, suggesting temporary indecision before a potential continuation move.
Key Resistance Level: 0.8265 — This marks a crucial intraday consolidation zone. A failure to break above this level may reinforce bearish sentiment.
Support Targets: If price rallies toward 0.8265 and is rejected:
0.8120 (primary support)
0.8080 (intermediate support)
0.8050 (long-term target)
On the bullish side, a confirmed breakout and daily close above 0.8265 would shift sentiment, potentially initiating a bullish reversal. In that case, watch for:
0.8300 (initial resistance)
0.8360 (extended resistance target)
Conclusion:
USDCHF remains in a bearish structure, with consolidation suggesting a possible continuation to the downside if 0.8265 holds as resistance. A clear breakout and daily close above this level would invalidate the bearish outlook and open the path to higher levels. Traders should monitor price behavior around 0.8265 for directional confirmation.
USD/CHF ShortUSD/CHF Short
Minimum entry requirements:
- Corrective tap into area of value.
- 4H risk entry or 1H risk entry after 2 x 1H rejection candles.
Minimum entry requirements:
- Tap into area of value.
- 1H impulse down below area of value.
- If tight non-structured 5 min continuation follows, reduced risk entry on the break of it.
- If tight structured 5 min continuation follows, reduced risk entry on the break of it or 5 min risk entry within it.
- If tight non-structured 15 min continuation follows, 5 min risk entry within it if the continuation is structured on the 5 min chart or reduced risk entry on the break of it.
- If tight structured 15 min continuation follows, reduced risk entry on the break of it or 15 min risk entry within it.

Analysis on some of the 10 Elite PairVery long video but Educative.. You can follow us for more Analysis(Images and Videos) with Precise definition of the Financial Market.ENJOY!!!

USDCHF Buy analysis/ideaThis trade and analysis is mainly based on the Daily and 4-hour charts and executed using reversal trading and trend formation. Complete explanation in the video!

USD/CHF H1 | Falling toward a swing-low supportUSD/CHF is falling towards a swing-low support and could potentially bounce off this level to climb higher.
Buy entry is at 0.8189 which is swing-low support that aligns with the 78.6% Fibonacci retracement.
Stop loss is at 0.8159 which is a level that lies underneath a multi-swing-low support.
Take profit is at 0.8244 which is a multi-swing-high resistance that aligns closely with the 50.0% Fibonacci retracement.
High Risk Investment Warning
Trading Forex/CFDs on margin carries a high level of risk and may not be suitable for all investors. Leverage can work against you.
Stratos Markets Limited (tradu.com ):
CFDs are complex instruments and come with a high risk of losing money rapidly due to leverage. 63% of retail investor accounts lose money when trading CFDs with this provider. You should consider whether you understand how CFDs work and whether you can afford to take the high risk of losing your money.
Stratos Europe Ltd (tradu.com ):
CFDs are complex instruments and come with a high risk of losing money rapidly due to leverage. 63% of retail investor accounts lose money when trading CFDs with this provider. You should consider whether you understand how CFDs work and whether you can afford to take the high risk of losing your money.
Stratos Global LLC (tradu.com ):
Losses can exceed deposits.
Please be advised that the information presented on TradingView is provided to Tradu (‘Company’, ‘we’) by a third-party provider (‘TFA Global Pte Ltd’). Please be reminded that you are solely responsible for the trading decisions on your account. There is a very high degree of risk involved in trading. Any information and/or content is intended entirely for research, educational and informational purposes only and does not constitute investment or consultation advice or investment strategy. The information is not tailored to the investment needs of any specific person and therefore does not involve a consideration of any of the investment objectives, financial situation or needs of any viewer that may receive it. Kindly also note that past performance is not a reliable indicator of future results. Actual results may differ materially from those anticipated in forward-looking or past performance statements. We assume no liability as to the accuracy or completeness of any of the information and/or content provided herein and the Company cannot be held responsible for any omission, mistake nor for any loss or damage including without limitation to any loss of profit which may arise from reliance on any information supplied by TFA Global Pte Ltd.
The speaker(s) is neither an employee, agent nor representative of Tradu and is therefore acting independently. The opinions given are their own, constitute general market commentary, and do not constitute the opinion or advice of Tradu or any form of personal or investment advice. Tradu neither endorses nor guarantees offerings of third-party speakers, nor is Tradu responsible for the content, veracity or opinions of third-party speakers, presenters or participants.

USDCHF - Bullish Ideathe currency pair is in downttrend for most of the sessions. But seem like bullsh have started to step in and the price is taking some support at current price level.
Bullish divergence have formed in 4H TF can indicate reversal . At the break of lower TF resestance entry can be placed with SL below the previous low
USDCHF: weekly overviewHello Traders,
In long-term, we anticipate a bearish move to 0.76500 for this pair. but for this week, our most important zone is the 0.81911
**********************************************************
The indicated levels are determined based on the most reaction points and the assumption of approximately equal distance between the zones.
Some of these points can also be confirmed by the mathematical intervals of Murray.
You can enter with/without confirmation. IF you want to take confirmation you can use LTF analysis, Spike move confirmation, Trend Strength confirmation and ETC.
SL could be placed below the zone or regarding the LTF swings.
TP is the next zone or the nearest moving S&R, which are median and borders of the drawn channels.
*******************************************************************
Role of different zones:
GREEN: Just long trades allowed on them.
RED: Just Short trades allowed on them.
BLUE: both long and short trades allowed on them.
WHITE: No trades allowed on them! just use them as TP points
USD/CHFSmart money trap is set,
Looks like we are now in the manipulation faze.
I am now waiting for the early buyer liquidity to be swept and then look for bullish entry areas targeting the major high.
Why You Should Avoid Safe-Haven Shorts Next WeekTraders, don’t walk into next week blind.
The U.S. and China are set to hold official trade talks in London on June 9, and the market is already shifting in anticipation.
This video breaks down exactly how the process works — from Trump’s surprise phone call, to tariff de-escalation, to what happens when global tensions ease.
If you're planning to short USD/JPY, USD/CHF, or any safe-haven pairs next week, you need to watch this first.
Because a positive trade outcome = risk-on sentiment, and that means JPY and CHF will likely weaken fast.
I explain:
Why optimism crushes safe-haven setups
What smart money is watching
How to align your trades with the macro narrative
And how not to get trapped like most retail traders will
📉 This is how real traders position ahead of a global sentiment shift.
Drop a comment if you’re preparing the same way, and follow for more macro-driven trade insights.

Usdchf Am expecting a bearish continuation because we have price moving bearish we have a clear head and shoulders on de 1 day we have a break and retest so we are expecting weak out on the resistance zone then we sell or a positive candle den we sell
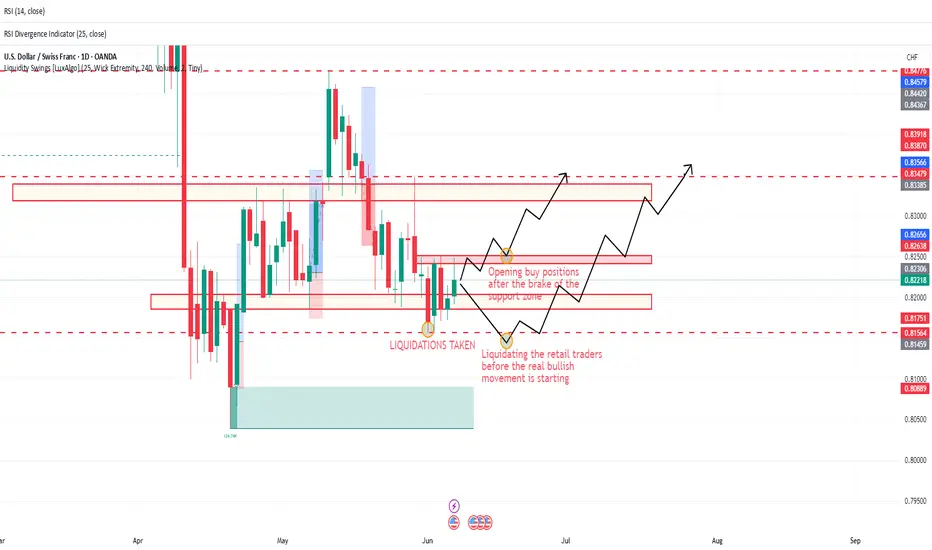
USD/CHF – BULLISH Plan for Next WeekThe battlefield is set.
The market has spoken — now it’s our turn to act.
This is my two-scenario strategy for USD/CHF going into next week, built around institutional behavior, liquidity grabs, and market structure.
📍 Zone Recap:
Liquidity Taken – Price swept below key support zones, triggering stop-losses and clearing out retail longs.
Support Levels – Minor zones were broken on the lower timeframes (LTF), but these are not structurally strong.
Institutional Setup – Smart money often manipulates these levels before initiating the true directional move.
🧭 SCENARIO 1 – The Bullish Continuation (More Likely)
The most probable outcome based on structure and liquidity behavior:
Price opens bullish.
Retests the broken minor support (now acting as demand).
Buys triggered after confirmation.
Targets:
First TP: 0.82650
Second TP: 0.83500+
Break above = room for explosive movement toward 0.84000–0.84500
This aligns with the concept of liquidity engineering, where the market takes the weak hands out before the real move starts.
⚔️ SCENARIO 2 – The Last Sweep Before the Climb (Less Likely but Possible)
If price opens bearish, we must remain vigilant:
A final push lower could target the same liquidity zone again,
further liquidating retail traders who jumped in early.
If this occurs, the real bullish move would follow, catching everyone off guard.
Entry would then be taken after a deeper retest + bullish market structure shift.
🧠 STRATEGY MINDSET:
This isn’t guesswork — this is preparation.
Retail sees chaos. Smart traders see order in manipulation.
We don’t chase moves. We understand them.
“The market punishes the impulsive and rewards the prepared.”
I stand with patience. I wait for confirmation.
I strike when the weak are removed and the zone is clean.
🔐 Remember:
No confirmation = no entry.
Adapt to the narrative the market gives you.
If 0.81750 breaks down with strength → pause. Reevaluate. No ego.
📈 USD/CHF outlook: Bullish bias, smart entry only.
Drop your thoughts, setups, or if you’re preparing for the same war.
Let’s grow and conquer — one level at a time.
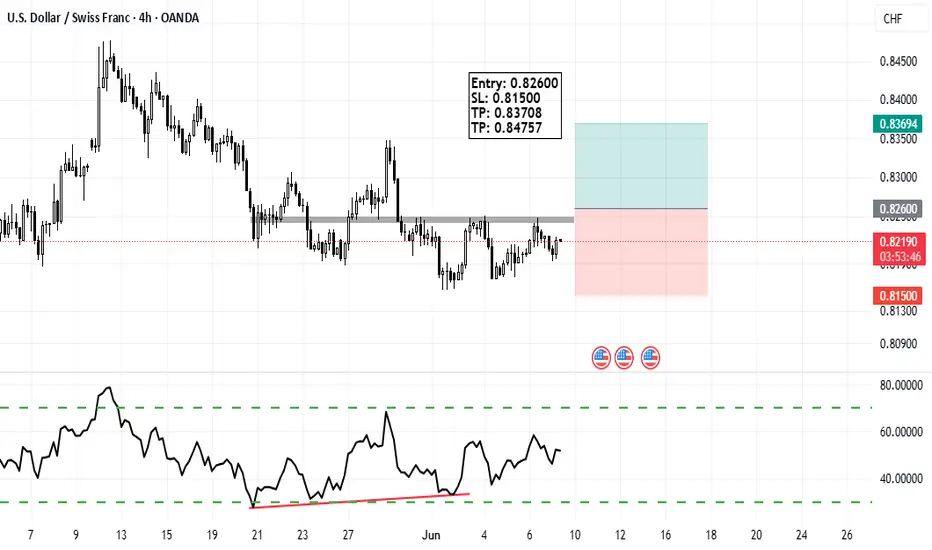
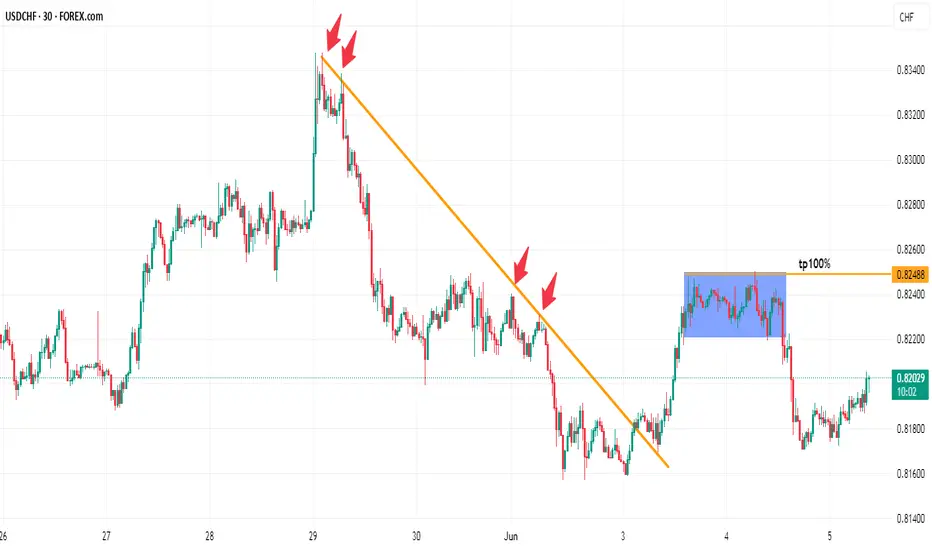
Buy !target is 0.8248
As we know trading against the overall prevailing trend comes with some risk which is why we need to take extra precautions when we look to buy into this market.
USDCHF SHORT Market structure bearish on HTFs 3
Entry at Daily AOi
Weekly Rejection at AOi
Daily Rejection at AOi
Previous Structure point Daily
Around Psychological Level 0.83000
H4 EMA retest
H4 Candlestick rejection
Rejection from Previous structure
Levels 3.99
Entry 100%
REMEMBER : Trading is a Game Of Probability
: Manage Your Risk
: Be Patient
: Every Moment Is Unique
: Rinse, Wash, Repeat!
: Christ is King.

USD/CHF..30M chart pattern.Here’s the breakdown of MY USD/CHF Long Trade Setup:
📈 Trade Idea (Long USD/CHF)
Entry: 0.82140
1st Target: 0.82400
2nd Target: 0.82650
Stop Loss: Not specified ⚠️
🧮 Trade Metrics
Target Pips Gain % Gain (Approx)
1st Target +26 pips +0.32%
2nd Target +51 pips +0.62%
⚠️ Risk Consideration:
No stop loss provided — without it, risk/reward can’t be calculated.
A stop loss around 0.8180–0.8190 might make sense depending on recent support levels.
✅ Summary:
Clean setup with small but realistic targets.
Reward-to-risk will likely be favorable if you use a stop below 0.8190.
Would you like help identifying a technical stop loss or creating a table of your full trade plan (including BTC, gold, and USDCHF)?
USD/CHF 1-Hour Timeframe – Short Position Setup
Entry Point: Consider initiating a short position slightly above 0.82224.
Stop-Loss: Place at 0.82548 to limit potential losses.
Break-Even Adjustment: Move stop-loss to break-even once the price tests 0.81936.
Target Levels:
Primary Target: A breakdown toward the 0.81598–0.81558 zone.
Secondary Target: A potential retest of 0.80947.
Important Note:
Avoid entering a short position if the price rises above 0.82489, as this may signal bullish momentum.
Tags: OANDA:USDCHF
USDCHF Primed for Monster Move to 0.92? Here's Why!In today’s video, I break down a potentially strong bullish opportunity on USDCHF and why, with the right entry signal, we might see a solid push up towards 0.88 and eventually 0.92 in the weeks and months ahead.
First off, let's check the monthly chart. In April, price finally broke and closed below the major 0.84 support, a level that held firm since 2011. Below, I've marked the massive buy zone created around the 2011 lows—interestingly, depending on your broker, you’ll notice this zone was tested during the dramatic Swiss franc unpegging event back in 2015 as well.
But here's why I don’t think we’re headed down to retest that monthly zone anytime soon. Zooming into the weekly charts, we clearly see a key weekly buy zone. This was actually the origin point for the massive move up from the 2011 lows to 0.95. This exact weekly level is already proving its significance again, given the strong buying reaction we saw here in May.
Now, zooming further into the daily charts, we had a nice bounce at that weekly buy zone, pushing price back up to retest the previous support at 0.84. If the market truly wanted lower prices, we would've seen a sharp sell-off from there. Instead, price has slowly been grinding lower, forming a clear W double-bottom pattern—a powerful reversal signal.
This all points to higher prices ahead, especially considering USDCHF currently offers one of the most attractive swap carry opportunities due to the interest rate differentials and the SNB’s hints about possibly returning to negative rates to weaken the franc.
Here's my game plan:
Wait patiently for the next bullish daily candle with a clear close above 0.83.
My first target will be the 0.88 area (previous strong resistance and weekly sell zone).
The longer-term target will be around the 0.92 resistance zone.
My stop loss will be placed comfortably below 0.80. Should we spike lower to that level, I'll remain alert for another high-probability bullish entry signal.
Let me know your thoughts below!

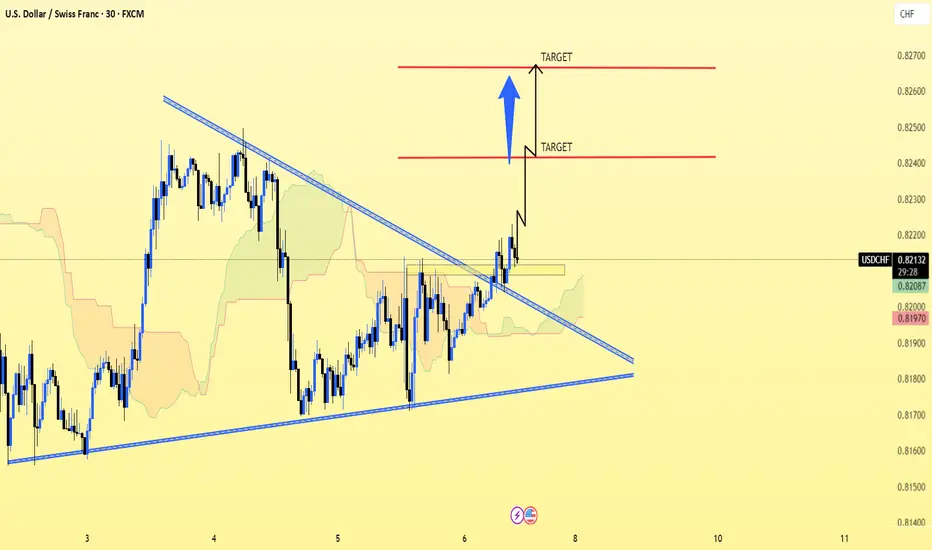
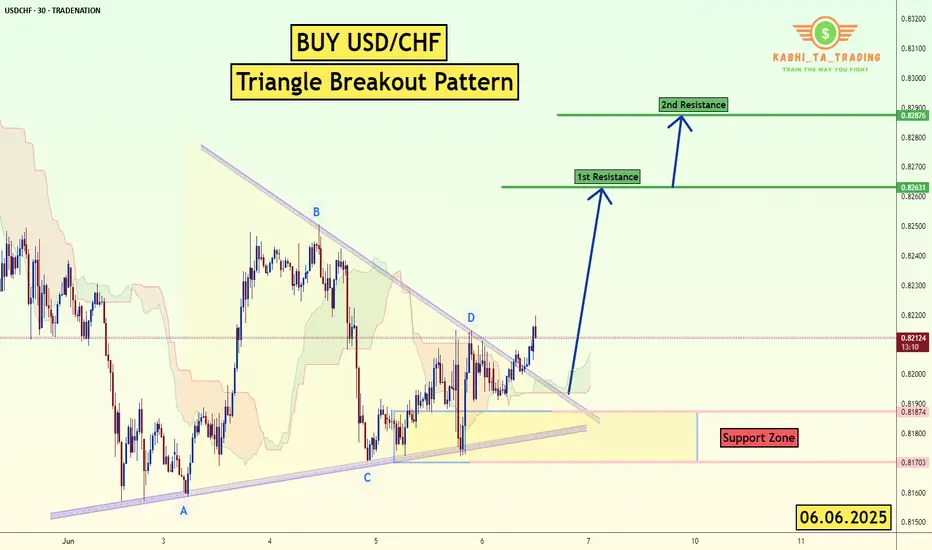
USD/CHF - Triangle Breakout (06.06.2025)The USD/CHF pair on the M30 timeframe presents a Potential Buying Opportunity due to a recent Formation of a Triangle Pattern. This suggests a shift in momentum towards the upside and a higher likelihood of further advances in the coming hours.
Possible Long Trade:
Entry: Consider Entering A Long Position around Trendline Of The Pattern.
Target Levels:
1st Resistance – 0.8263
2nd Resistance – 0.8227
🎁 Please hit the like button and
🎁 Leave a comment to support for My Post !
Your likes and comments are incredibly motivating and will encourage me to share more analysis with you.
Best Regards, KABHI_TA_TRADING
Thank you.
Disclosure: I am part of Trade Nation's Influencer program and receive a monthly fee for using their TradingView charts in my analysis.
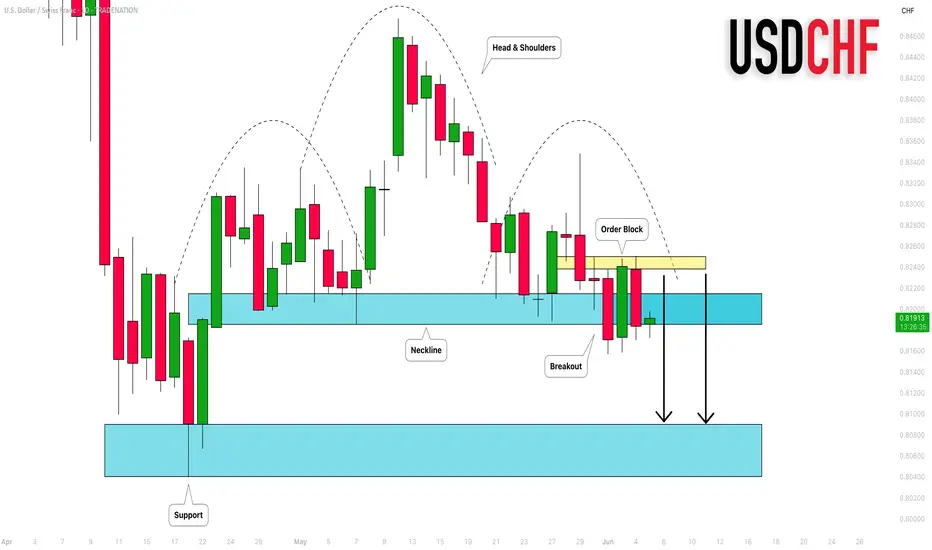
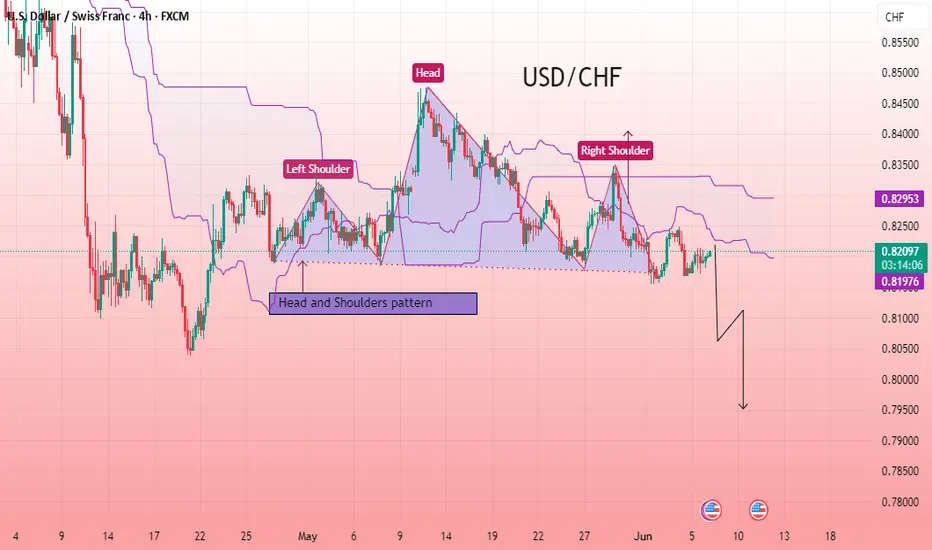
USD/CHF Head and Shoulders Pattern Signals Bearish ReversalThe USD/CHF 4-hour chart shows a clear Head and Shoulders pattern, a classic reversal signal. The Left Shoulder, Head, and Right Shoulder are well-formed, suggesting bearish momentum. The price is currently consolidating below the neckline, indicating a potential breakout to the downside. The Ichimoku cloud confirms resistance above the current price level, adding further bearish bias. If the price breaks below the neckline decisively, a significant downward move is expected.
Entry point: 0.82080
First target: 0.80638
Second target: 0.79500
If you found this analysis helpful, don’t forget to drop a like and comment . Your support keeps quality ideas flowing—let’s grow and win together! 💪📈
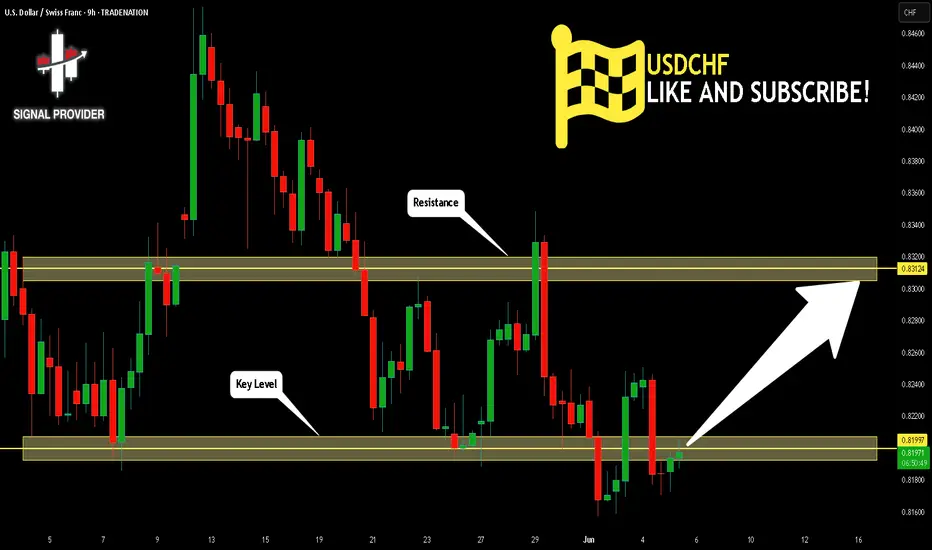
USDCHF Will Go Higher! Long!
Here is our detailed technical review for USDCHF.
Time Frame: 9h
Current Trend: Bullish
Sentiment: Oversold (based on 7-period RSI)
Forecast: Bullish
The market is approaching a significant support area 0.819.
The underlined horizontal cluster clearly indicates a highly probable bullish movement with target 0.831 level.
P.S
Overbought describes a period of time where there has been a significant and consistent upward move in price over a period of time without much pullback.
Disclosure: I am part of Trade Nation's Influencer program and receive a monthly fee for using their TradingView charts in my analysis.
Like and subscribe and comment my ideas if you enjoy them!
USDCHF: Bearish Wave Ahead 🇺🇸🇨🇭
Quick update for USDCHF.
Earlier on Monday, I shared a bearish forecast based on a
confirmed violation of a neckline of a head and shoulders pattern on a daily.
We got quite a deep retest of that and bears finally showed their presence.
I remain bearish bias and expect a bearish continuation soon.
❤️Please, support my work with like, thank you!❤️
I am part of Trade Nation's Influencer program and receive a monthly fee for using their TradingView charts in my analysis.