USDCHF - Predictive Analysis & Forecasting USDCHF
Scales
- S: 0.8485 pending
- M: 0.8460 activated, triggers 0.8138 pivot
- L: 0.8457 activated, triggers 0.8258 pivot
Forecast & Targets
- ST: Limited upside to 0.8485 min, 0.8584 max
- MT: bearish; eyeing reversal conditions
#USDCHF #Forex #CROW2.0
4xForecaster
------
Originally published on BlueSky
CHFUSD trade ideas

USD/CHF Weekly Swing Long – Targeting Long-Term Reversal I'm entering a long swing trade on USD/CHF off the weekly timeframe, aiming for a strong upside move over the coming months/years.
🔍 Entry Zone: 0.82xx (current region)
🎯 Target: 1.01585
🛑 Stop Loss: Below 0.80188
⚖️ Risk-Reward: Over 4:1
⏳ Time Horizon: Long-term swing (1–3 years)
Technical Justification:
Major Weekly Support: Price has bounced off a strong historical demand zone dating back to 2014–2015 levels.
Long Wicks + Rejection Candles: Bullish price action showing exhaustion of sellers.
Potential Double Bottom Structure: Early signs of trend reversal forming.
MACRO Opportunity: USD is historically resilient, and CHF may weaken on any shift away from risk aversion or SNB policy changes.

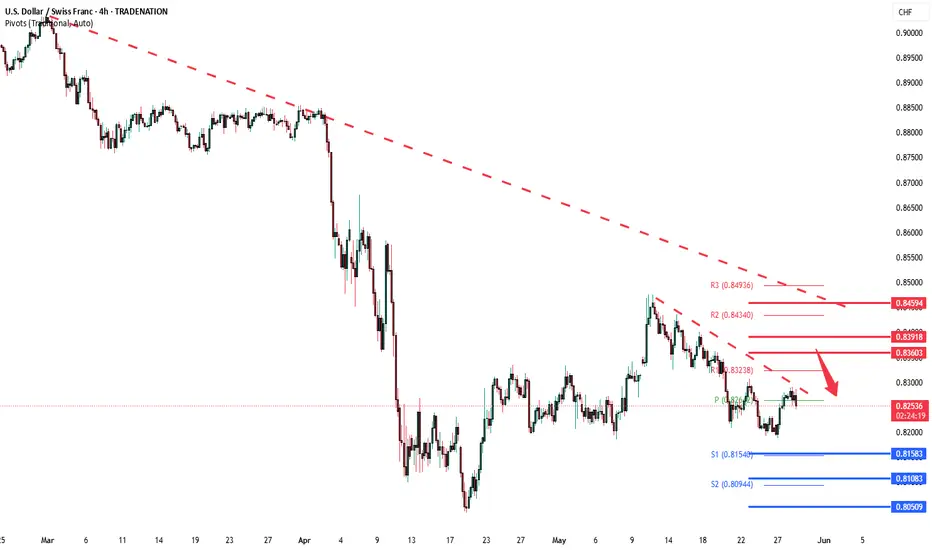
TrendIn the following down trend there is a constant resistance to the upside until it was broken and now it has been retested meaning now it's converted to an up trend

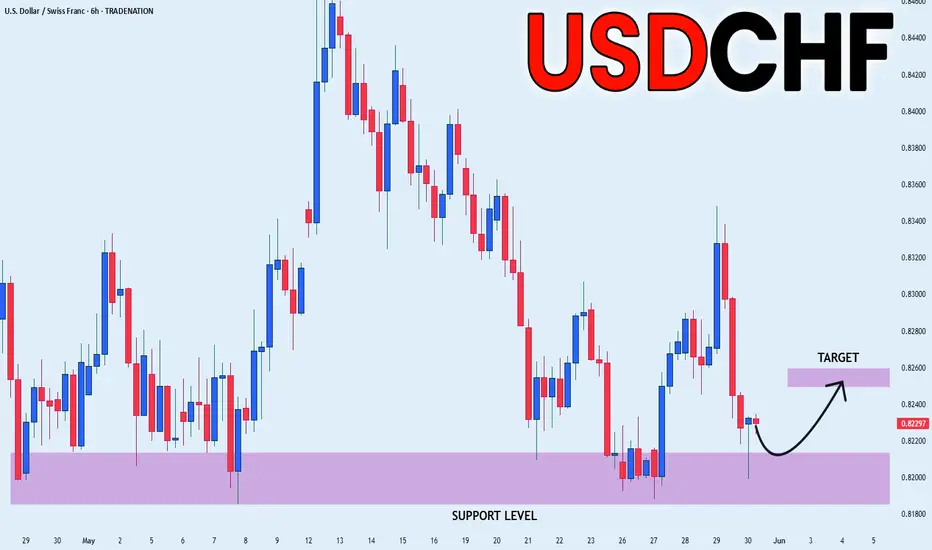
USD_CHF WILL GROW|LONG|
✅USD_CHF is falling down
And will soon retest
A horizontal demand level of 0.8190
So I think that we will see a rebound
And a move up from the level
Towards the target above at 0.8253
LONG🚀
✅Like and subscribe to never miss a new idea!✅
Disclosure: I am part of Trade Nation's Influencer program and receive a monthly fee for using their TradingView charts in my analysis.
USDCHF Technical Analysis! BUY!
My dear subscribers,
My technical analysis for USDCHF is below:
The price is coiling around a solid key level - 0.8202
Bias - Bullish
Technical Indicators: Pivot Points Low anticipates a potential price reversal.
Super trend shows a clear buy, giving a perfect indicators' convergence.
Goal - 0.8285
My Stop Loss - 0.8166
About Used Indicators:
By the very nature of the supertrend indicator, it offers firm support and resistance levels for traders to enter and exit trades. Additionally, it also provides signals for setting stop losses
Disclosure: I am part of Trade Nation's Influencer program and receive a monthly fee for using their TradingView charts in my analysis.
———————————
WISH YOU ALL LUCK
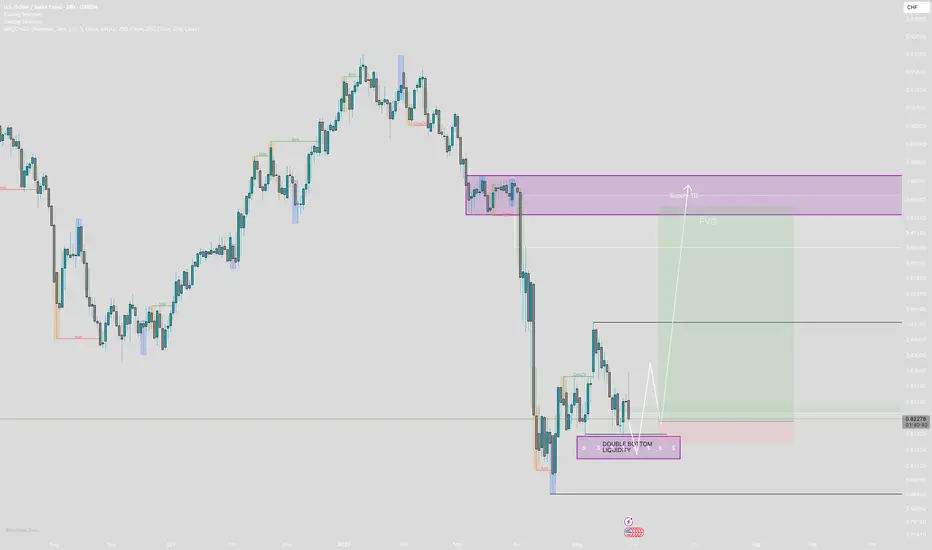
USDCHF LONG Looking at the daily chart we have a Double bottom formed after a change of character.
There will be liquidity below this double bottom so I am expecting a Liquidity sweep into this area below and then a drive to the upside.
Target being this area of Supply above marked.
Plan will be once liquidity swept wait for break of structure to the upside on the 1H minimum. (Anything lower time frame than this will not be valid for me)
In line with bullish momentum I will look to find a Demand zone formed on the 60minute or potentially the 15min to refine.
Trade will likely look like the chart but entry and SL will be determined by movement between now and my Entry criteria being met.
Early days but a nice LONG setting up.
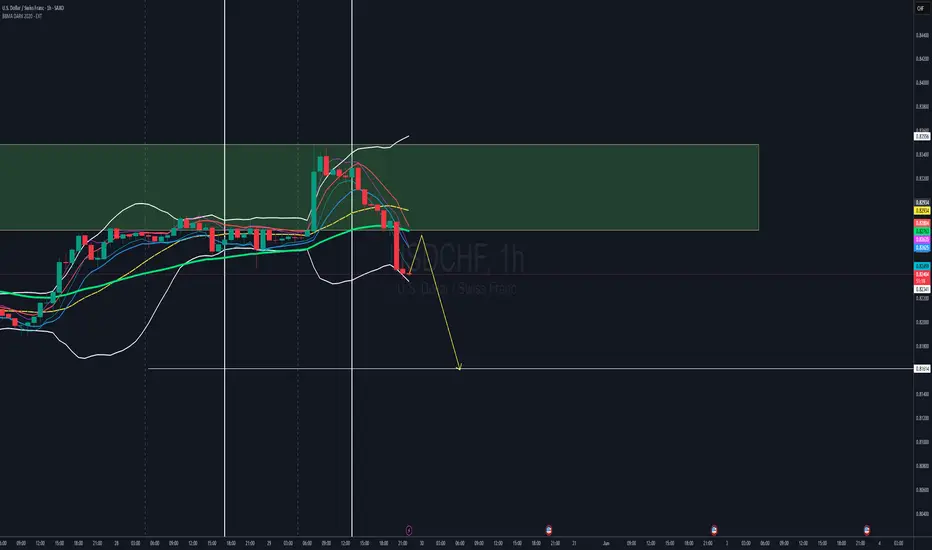
USDCHF BBMA OMA ALLYAnalysis based on BBMA oma ally,
This analysis uses the BBMA OMA ALLY indicator
tf 1 is D1 showing RE after CSAK
on tf 2, namely H4, it has shown a power candle in the form of pressure by the seller
on tf 3 ta
that H1 already has CSAK Sell and has crossed Ema 50
our task is to wait for Re to occur on H1 and wait for other confirmations
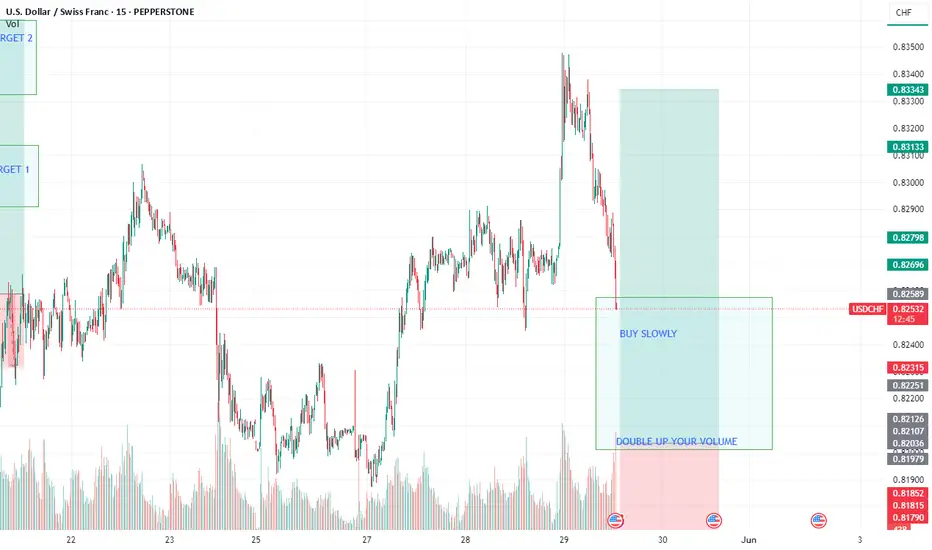
USDCHF - LET MAKE ANOTHER MILLIONS TONIGHTTeam,
Today GOLD was perfectly hit target
we short DOW/US30 earlier both target hit
NAS 1st target hit
DAX/GER another 2 target hit on short..
almost a perfect day 4/4 wins
Lets look at USDCHF right now, buy slowly, do not be aggressive..
WILL DOUBLE up at the price range given in the chart.
Hold this till tomorrow OR next week, will definitely reward ourselves
US Federal Court Rules Trump Tariffs UnconstitutionalUS Federal Court Rules Trump Tariffs Unconstitutional
According to media reports, the US Court of International Trade has:
- declared the tariffs imposed by President Donald Trump illegal;
- ruled that the President exceeded his authority;
- blocked the tariffs, emphasising that under the US Constitution, only Congress has the power to impose tariffs.
The decision was made unanimously by a panel of three judges. Financial markets reacted with:
- a rise in US stock indices;
- strengthening of the US dollar — most notably seen today on the USD/CHF chart, as demand for so-called safe-haven assets declined in light of the tariff reversal.
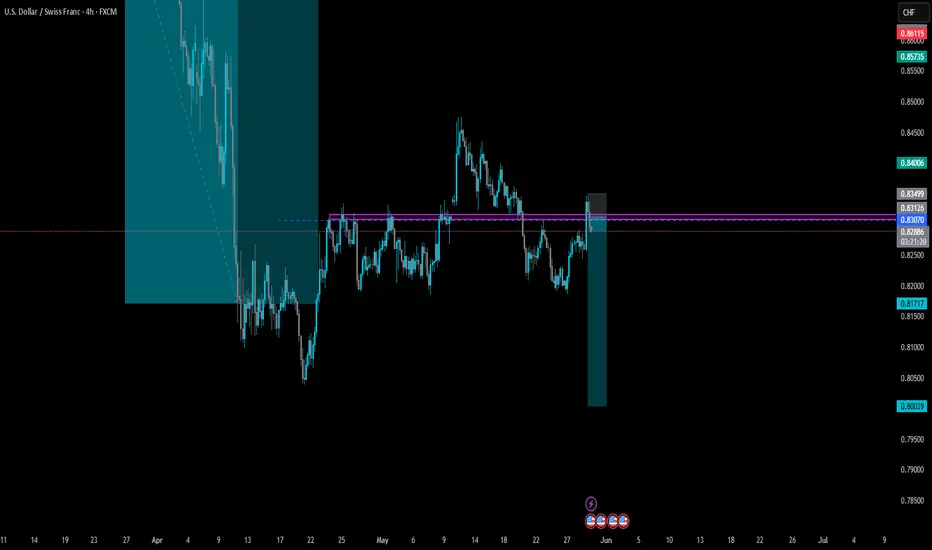
Technical Analysis of the USD/CHF Chart
The bullish momentum has broken upward through:
- a local downward trendline (shown in red);
- resistance at the 0.8300 level, near the May 22 high.
Additionally:
- the RSI indicator on the 4-hour chart has moved upwards to the overbought territory;
- the area highlighted with a purple rectangle resembles a bullish Fair Value Gap.
Could this upward momentum lead to a sustained uptrend? There is reason for doubt.
Consider the steep decline in USD/CHF in early April (driven mainly by the introduction of Trump's tariffs) and the relatively small size of today's bullish candle compared to that prior drop.
Price action seems to suggest that market participants are skeptical about any lasting change in the situation. The Trump administration has already filed an appeal, and it’s possible the White House could succeed in defending its position.
This article represents the opinion of the Companies operating under the FXOpen brand only. It is not to be construed as an offer, solicitation, or recommendation with respect to products and services provided by the Companies operating under the FXOpen brand, nor is it to be considered financial advice.

USDCHF ON BEARISHHead and Shoulders spotted on USDCHF. Analyzing , check the chart USDCHF is pushing to the target, no drawdown is expected. Stack and also manage your risk.
USD/CHF – Pull-Back to the Launchpad 0.8340Price has now punched through the old 0.8292 lid, turning it into a support “buy-zone.”
the burst of USD strength over the last 48 hours has been driven by an unexpected round of tariff-related headlines. I’m factoring that news flow into all current setups and shifting focus to pairs that aren’t riding the same dollar surge.

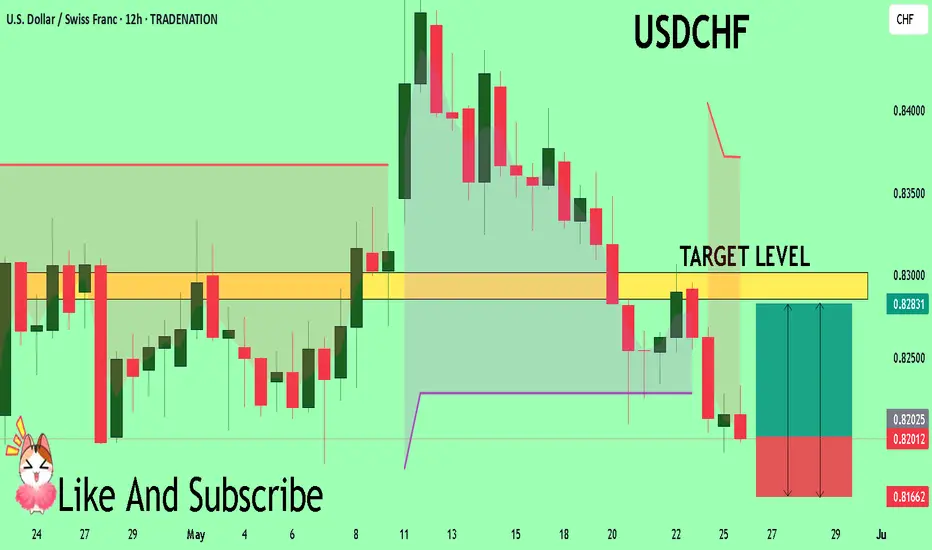
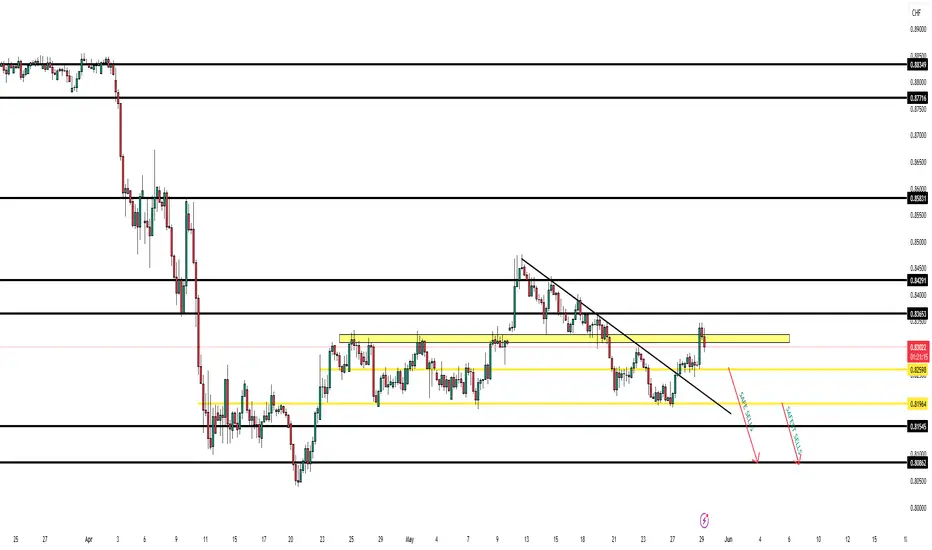
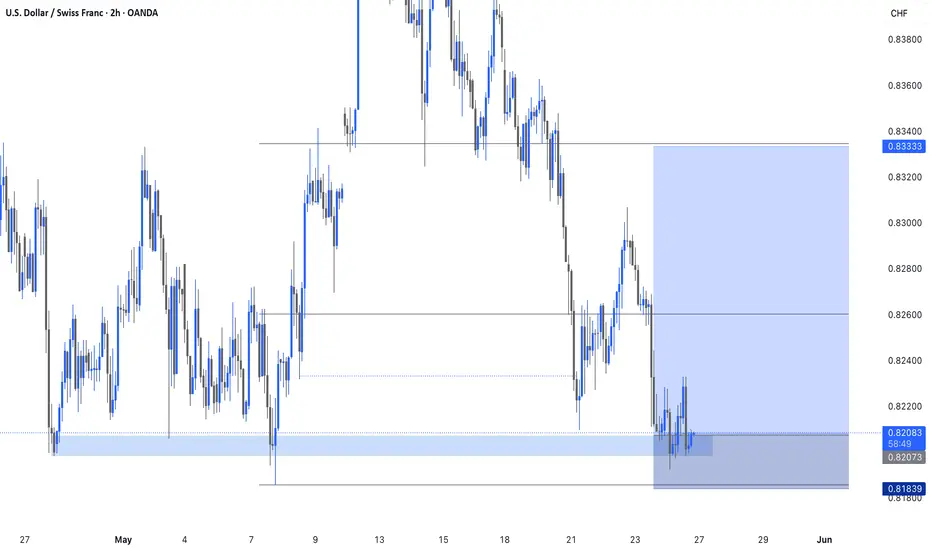
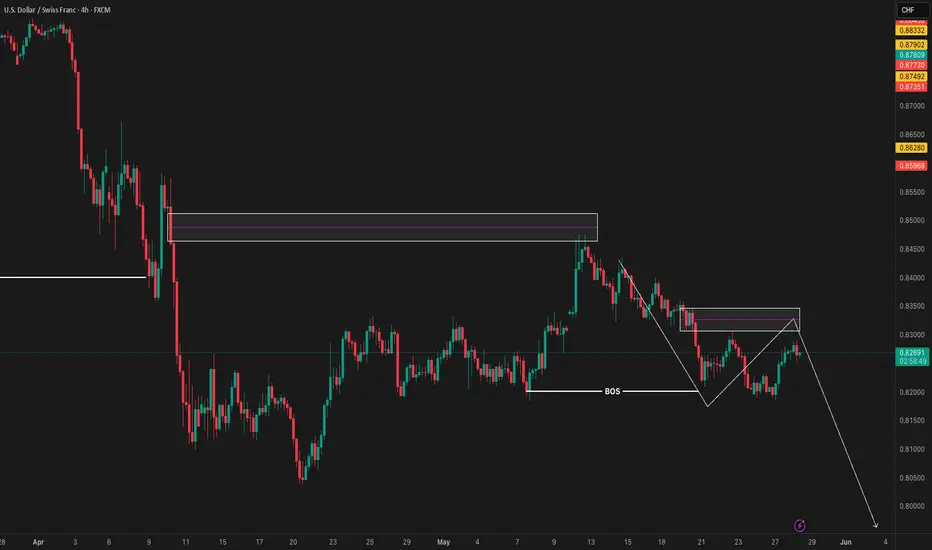
USDCHF – Bearish Setup UpdateFollowing the structure break earlier this week, USDCHF pulled back to retest the broken trendline and the key resistance level around 0.82598. This aligns perfectly with our yellow sell zone of interest. Price has since rejected this area and resumed a bearish move.
We’re now looking for clean breakdowns to re-enter:
🔑 Break below 0.82598 will confirm continuation
🛡️ Break below 0.81964 is our safest sell zone with the clearest structure shift
No buy setups are in focus unless we see a major structural reversal above 0.82960, which currently looks unlikely.
USDCHF: A SHORT BUY OPPORTUNITY IS POSSIBLEThis satisfy all the elements of my trade system, I'm buying because I'll like see price push higher. A break of structure to the upside and an engineered liquidity before price broke structure. Price has returned to grab liquidity, we should see it push to our target.
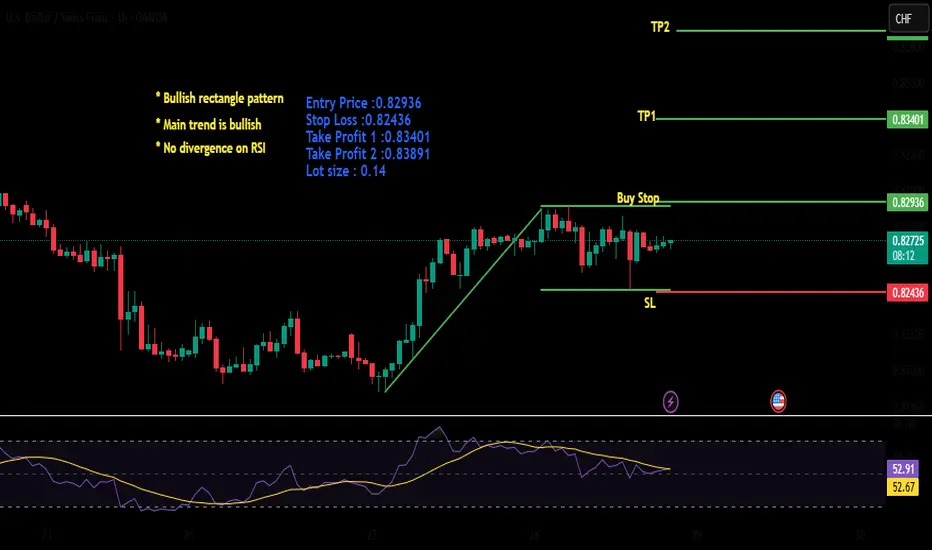
USDCHF | Bullish Rectangle | LongUSDCHF is printing bullish rectangle pattern on hourly chart.It indicates that it will most probably continue its bullish momentum after getting a bullish breakout.
USDCHF 1DThis currency pair looks very promising, and we just need to wait for the price to reach our target zone—then we can take a solid swing trade from it.

USDCHF INTRADAY resistance at 0.8300Recent price action in USDCHF suggests an oversold bounce, with resistance capping gains at the 0.8300 level.
The continuation of selling pressure could extend the downside move, with key support levels at 0.8130, followed by 0.8090 and 0.8050.
Alternatively, a confirmed breakout above 0.8300, accompanied by a daily close higher, would invalidate the bearish outlook. In this scenario, USDCHF could target 0.8365, with further resistance at 0.8400 and 0.8470.
Conclusion:
The price remains below pivotal level, with 0.8300 acting as a key resistance. Failure to break above this level could reinforce downside risks, while a breakout could shift momentum back in favour of bulls. Traders should watch for confirmation signals before positioning for the next move.
This communication is for informational purposes only and should not be viewed as any form of recommendation as to a particular course of action or as investment advice. It is not intended as an offer or solicitation for the purchase or sale of any financial instrument or as an official confirmation of any transaction. Opinions, estimates and assumptions expressed herein are made as of the date of this communication and are subject to change without notice. This communication has been prepared based upon information, including market prices, data and other information, believed to be reliable; however, Trade Nation does not warrant its completeness or accuracy. All market prices and market data contained in or attached to this communication are indicative and subject to change without notice.
Price action Liquidity was always sitting at the green line had to go back it the chart and try and figure out why is it not going according to plan
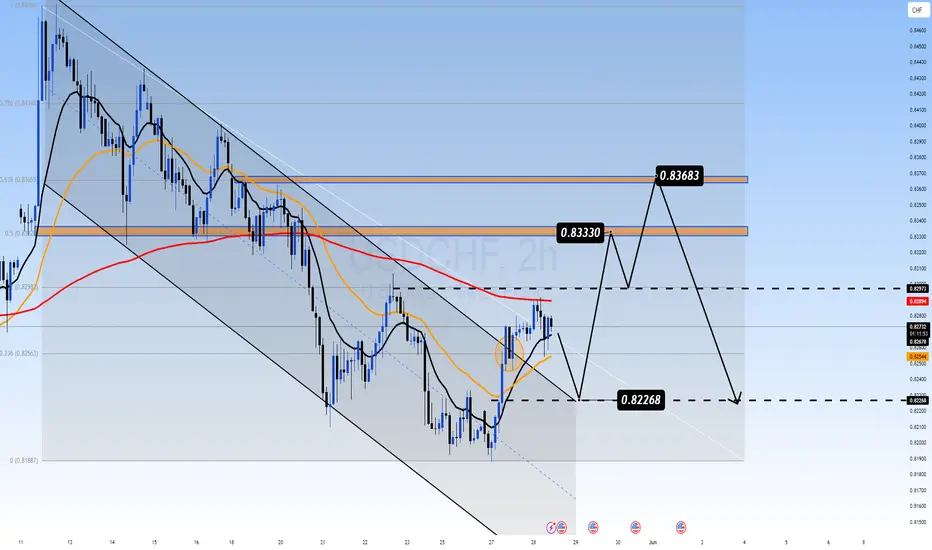
USDCHF – Awaiting Breakout Ahead of FOMC: Key Levels in Focus USDCHF – Awaiting Breakout Ahead of FOMC: Key Levels in Focus
📌 MARKET OVERVIEW
USDCHF is currently consolidating within a tight range after a technical rebound from the 0.8226 support zone. The price is testing a confluence area at the descending trendline and the 200 EMA on the H2 chart, indicating indecision between bulls and bears as we head into the high-impact FOMC event.
🔍 TECHNICAL ANALYSIS – H2 CHART
Overall Trend: Sideways corrective move within a broader downtrend channel. Price is approaching critical resistance at the EMA200 and the channel’s upper boundary.
EMAs in focus: EMA13 (black), EMA34 (orange), EMA89 (red).
Fibonacci Retracement: Price is hovering around the 0.5 fib zone (0.8298), a neutral level for potential reaction.
🎯 Key Levels & Trade Scenarios:
Major Resistance Zone: 0.8330 – 0.8368 → aligned with the 0.618 Fibonacci retracement and previous structural high.
Key Support Zone: 0.8226 → strong demand area. A break below this could expose deeper downside or set up a false break trap.
📌 Most Likely Path:
Price could dip back to 0.8226 before launching a bullish recovery targeting 0.8330 – 0.8368.
A clean breakout above 0.8368 with momentum and volume could invalidate the bearish bias and shift the trend mid-term.
🌍 MACRO & FUNDAMENTAL CONTEXT
FOMC IN FOCUS: The Federal Reserve is expected to hold rates steady at the upcoming meeting. However, market attention will be on Powell’s tone. A hawkish stance could fuel further USD strength, propelling USDCHF toward resistance zones.
SNB (Swiss National Bank) maintains a neutral tone with slight disinflationary concerns, offering limited support for the CHF and strengthening the USDCHF upside case.
US Treasury Yields are showing signs of recovery, adding bullish pressure to USD pairs.
📌 TRADING STRATEGY:
Watch for bullish reaction at 0.8226 – potential long setup if RSI divergence appears.
Short-term targets: 0.8330 → 0.8368.
Breakout Strategy: If price clears 0.8368 with conviction, shift bias to bullish continuation and monitor for FVG or trendline breakout alignment.
📣 Stay sharp for increased volatility around FOMC. Position sizing and discipline are key in macro-heavy weeks like this.

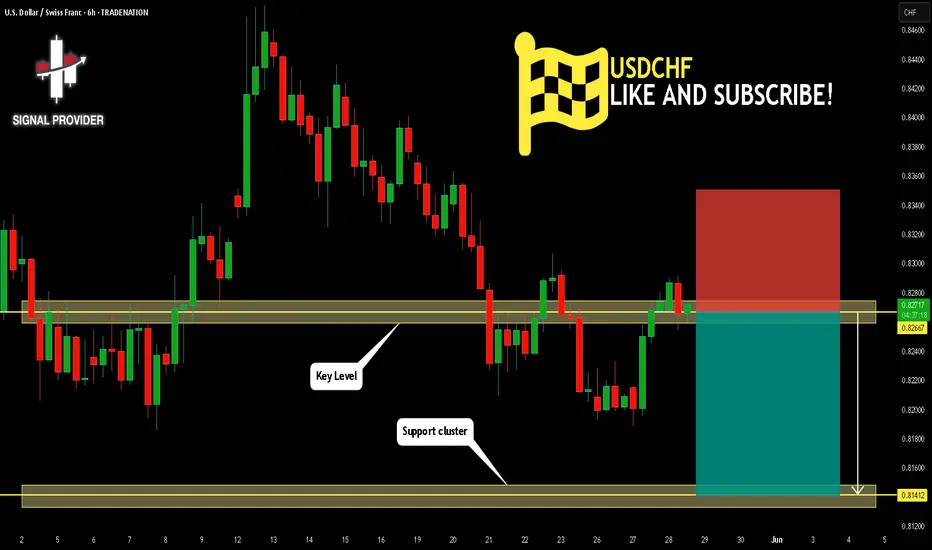
USDCHF Will Move Lower! Sell!
Take a look at our analysis for USDCHF.
Time Frame: 6h
Current Trend: Bearish
Sentiment: Overbought (based on 7-period RSI)
Forecast: Bearish
The market is on a crucial zone of supply 0.826.
The above-mentioned technicals clearly indicate the dominance of sellers on the market. I recommend shorting the instrument, aiming at 0.814 level.
P.S
Overbought describes a period of time where there has been a significant and consistent upward move in price over a period of time without much pullback.
Disclosure: I am part of Trade Nation's Influencer program and receive a monthly fee for using their TradingView charts in my analysis.
Like and subscribe and comment my ideas if you enjoy them!
USD/CHF POTENTIAL SHORTSUSD/CHF 4H - As you can see from this market, price has been continuing to trade us lower longer term, delivering us with a higher timeframe break of structure to the downside recently.
This as we know confirms an end to the corrective wave that has traded price up and into the higher timeframe Supply and confirms the start of the next impulse to trade price lower. This is a market I will be looking to take part in shortly.
As soon as price has trade into this fractal area of Supply that has been found by looking at the impulsive wave that broke structure initially we can begin looking to take the market short.
This is a case of waiting for price to trade into the area, giving us a more refined trade and one at a better price, as soon as I have something I will be sure to let you all know.
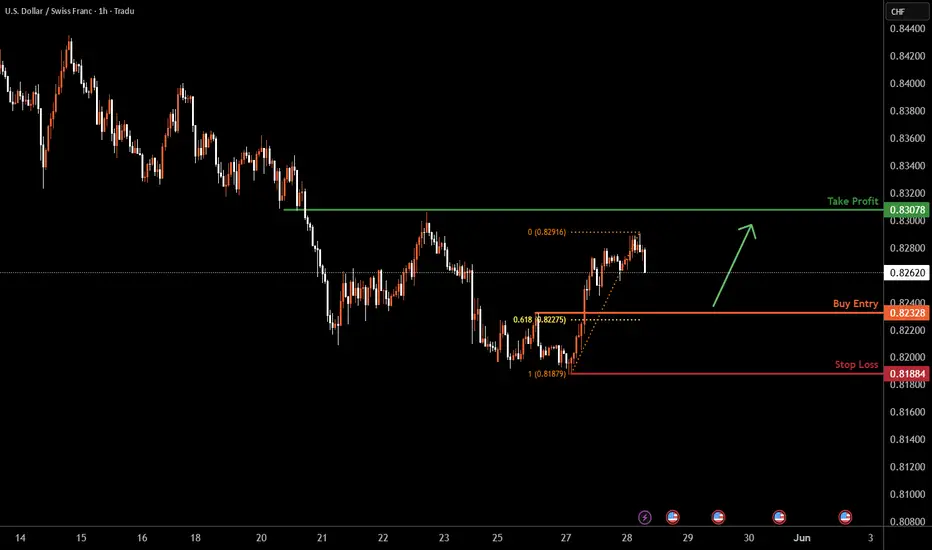
USDCHF H1 I Bullish Rise Based on the H4 chart analysis, the price is falling toward our buy entry level at 0.8232, a pullback support that aligns with the 61.8% Fibonacci retracement.
Our take profit is set at 0.8307, an overlap resistance.
The stop loss is placed at 0.8188, a swing low support level
High Risk Investment Warning
Trading Forex/CFDs on margin carries a high level of risk and may not be suitable for all investors. Leverage can work against you.
Stratos Markets Limited (tradu.com ):
CFDs are complex instruments and come with a high risk of losing money rapidly due to leverage. 63% of retail investor accounts lose money when trading CFDs with this provider. You should consider whether you understand how CFDs work and whether you can afford to take the high risk of losing your money.
Stratos Europe Ltd (tradu.com ):
CFDs are complex instruments and come with a high risk of losing money rapidly due to leverage. 63% of retail investor accounts lose money when trading CFDs with this provider. You should consider whether you understand how CFDs work and whether you can afford to take the high risk of losing your money.
Stratos Global LLC (tradu.com ):
Losses can exceed deposits.
Please be advised that the information presented on TradingView is provided to Tradu (‘Company’, ‘we’) by a third-party provider (‘TFA Global Pte Ltd’). Please be reminded that you are solely responsible for the trading decisions on your account. There is a very high degree of risk involved in trading. Any information and/or content is intended entirely for research, educational and informational purposes only and does not constitute investment or consultation advice or investment strategy. The information is not tailored to the investment needs of any specific person and therefore does not involve a consideration of any of the investment objectives, financial situation or needs of any viewer that may receive it. Kindly also note that past performance is not a reliable indicator of future results. Actual results may differ materially from those anticipated in forward-looking or past performance statements. We assume no liability as to the accuracy or completeness of any of the information and/or content provided herein and the Company cannot be held responsible for any omission, mistake nor for any loss or damage including without limitation to any loss of profit which may arise from reliance on any information supplied by TFA Global Pte Ltd.
The speaker(s) is neither an employee, agent nor representative of Tradu and is therefore acting independently. The opinions given are their own, constitute general market commentary, and do not constitute the opinion or advice of Tradu or any form of personal or investment advice. Tradu neither endorses nor guarantees offerings of third-party speakers, nor is Tradu responsible for the content, veracity or opinions of third-party speakers, presenters or participants.
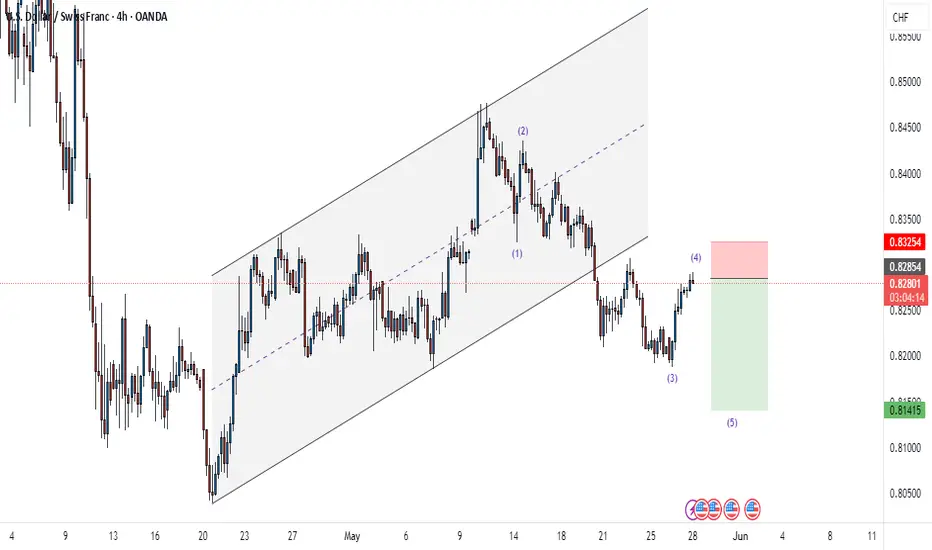
Potential BearsThe market looks to be in a wave 4 of a Submicro wave and has pulled back at a satisfying 38.2% Fib Level, the next move is downstairs to complete wave 5 of the same degree. We could catch some fish here.
This is solely our trading insight and not an investment advice.
Follow us for more Insights and Contents