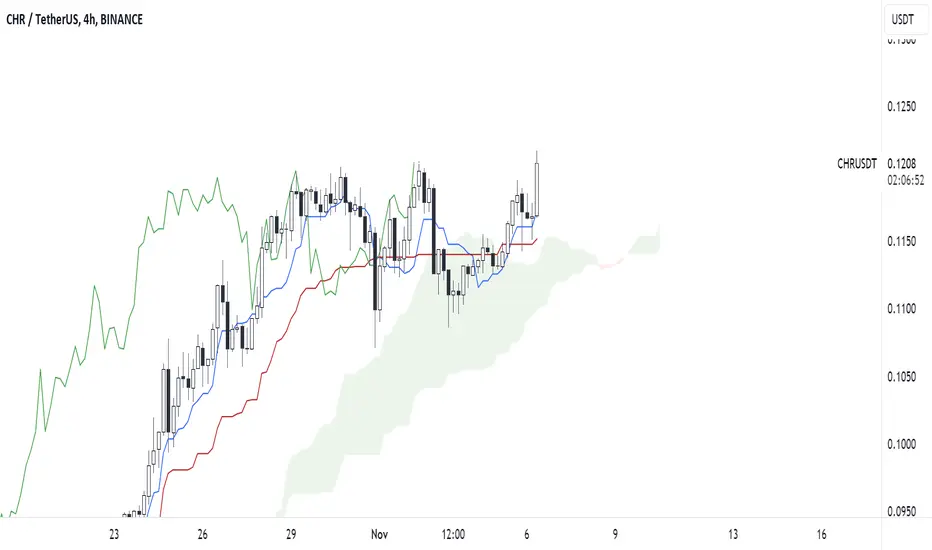
CHRUSDT OutlookTenken and kijun sen are pointing upward which indicates that there is a potential bullish bias that will be coming and it will be big while the cloud is in natal stage of green which i can assume that this is a starting of good bullish outcome
CHRUSDT.P trade ideas
#CHR/USDT is testing the resistance zone in 4-Hour TF!#CHR/USDT is testing the resistance zone in 4-Hour TF!
TSX:CHR needs to clear the resistance zone $0.1212 to gain the bullish momentum. Wait for BO/retest to open a long position.
#CHRUSDT local support level us PDL $0.112. Wait for breakdown to short it.
CHR/USDT - Chromia: Double_Bottom◳◱ We've a Double Bottom pattern on the TSX:CHR / CRYPTOCAP:USDT chart. This pattern is a bullish indication and could indicate a potential trend reversal. We may consider buying at the neckline at the current price. The next resistance key levels are at 0.0977 | 0.1025 | 0.1138 and the major support zones are respectively at 0.0864 | 0.0799 | 0.0686.
◰◲ General info :
▣ Name: Chromia
▣ Rank: 334
▣ Exchanges: Binance, Kucoin, Bybit, Huobipro, Gateio, Hitbtc
▣ Category/Sector: Infrastructure - Application Development
▣ Overview: Chromia (previously Chromapolis) is a Layer-1 blockchain that is also an Ethereum Virtual Machine (EVM) compatible Layer-2 solution for Ethereum and the Binance Smart Chain. Chromia is designed to achieve three goals: allow dApps to scale to millions of users, improve the user experience of dApps to match those of centralized applications, and create familiar paradigms that allow developers to build secure applications.
◰◲ Technical Metrics :
▣ Mrkt Price: 0.094 ₮
▣ 24HVol: 957,337.045 ₮
▣ 24H Chng: 2.285%
▣ 7-Days Chng: 1.91%
▣ 1-Month Chng: -1.45%
▣ 3-Months Chng: -12.15%
◲◰ Pivot Points - Levels :
◥ Resistance: 0.0977 | 0.1025 | 0.1138
◢ Support: 0.0864 | 0.0799 | 0.0686
◱◳ Indicators recommendation :
▣ Oscillators: NEUTRAL
▣ Moving Averages: STRONG_BUY
◰◲ Technical Indicators Summary : BUY
◲◰ Sharpe Ratios :
▣ Last 30D: -1.08
▣ Last 90D: -1.17
▣ Last 1-Y: -0.34
▣ Last 3-Y: 0.86
◲◰ Volatility :
▣ Last 30D: 0.51
▣ Last 90D: 0.72
▣ Last 1-Y: 0.82
▣ Last 3-Y: 1.56
◳◰ Market Sentiment Index :
▣ News sentiment score is N/A
▣ Twitter sentiment score is 0.49 - Bearish
▣ Reddit sentiment score is 0.42 - Bearish
▣ In-depth CHRUSDT technical analysis on Tradingview TA page
▣ What do you think of this analysis? Share your insights and let's discuss in the comments below. Your like, follow and support would be greatly appreciated!
◲ Disclaimer
Please note that the information and publications provided are for informational purposes only and should not be construed as financial, investment, trading, or any other type of advice or recommendation. We encourage you to conduct your own research and consult with a qualified professional before making any financial decisions. The use of the information provided is solely at your own risk.
▣ Welcome to the home of charting big: TradingView
Benefit from a ton of financial analysis features, instruments and data. Have a look around, and if you do choose to go with an upgraded plan, you'll get up to $30.
Discover it here - affiliate link -

CHRUSDT TRADING IDEACHRUSDT is currently displaying an extended correction pattern, with the potential formation of an ending diagonal. The Imbalance zone (IMB) highlighted on the chart holds significant importance for medium to long-term coin accumulation.
While the price remains within the confines of local resistance and support levels, the breakout direction will be a key indicator of the coin's future trajectory. In the event of a break below the local support, our IMB zone presents an ideal opportunity for substantial accumulation.
I strongly recommend setting a tight stop-loss just below this zone, providing a safeguard in case the price continues to decline, with the Optimum Demand Zone being a major focus in such a scenario. Conversely, the Optimum Supply Zone, as indicated on the chart, serves as a significant area for potential sell-offs.
If you find our analysis valuable, please show your support by leaving a like.


CHRUSDT - Time to going upDive into our September #DevEx Team Update, featuring:
📚 Enhanced documentation
🌐 On-chain package manager
📃 RellDoc Tool
🔎 MVP release of Chromia Explorer
🛠️ Rell Formatter
💡 IntelliJ Rell Plugin
Stay tuned for upcoming developments!

CHRUSDT short in polback to Orange trend line 1hLook carefully at the yellow and orange Fibo lines and trend lines. In the higher time, it could not break the price of 0.5. I am watching for it to drop to 0.5 and 0.618 in the small fibo area
you can set entry in polback to Orange trend line 1h

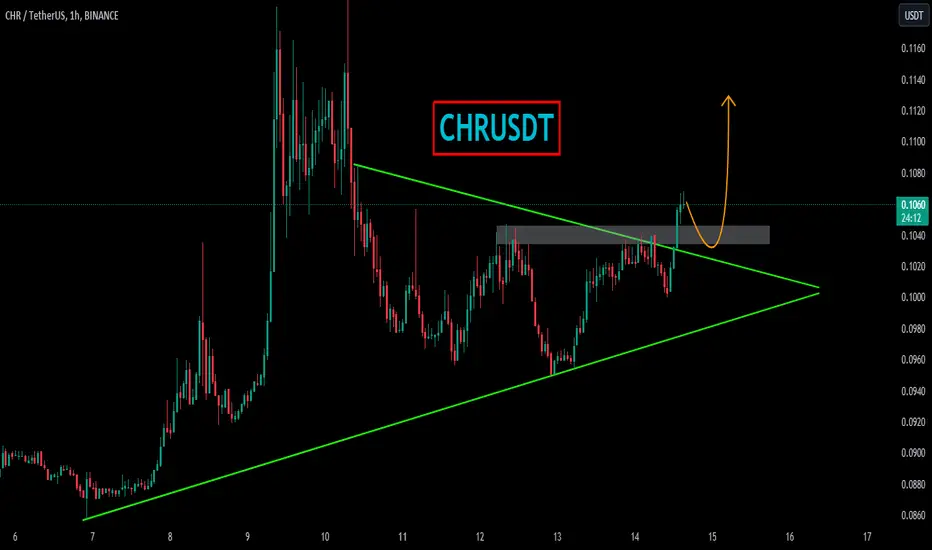
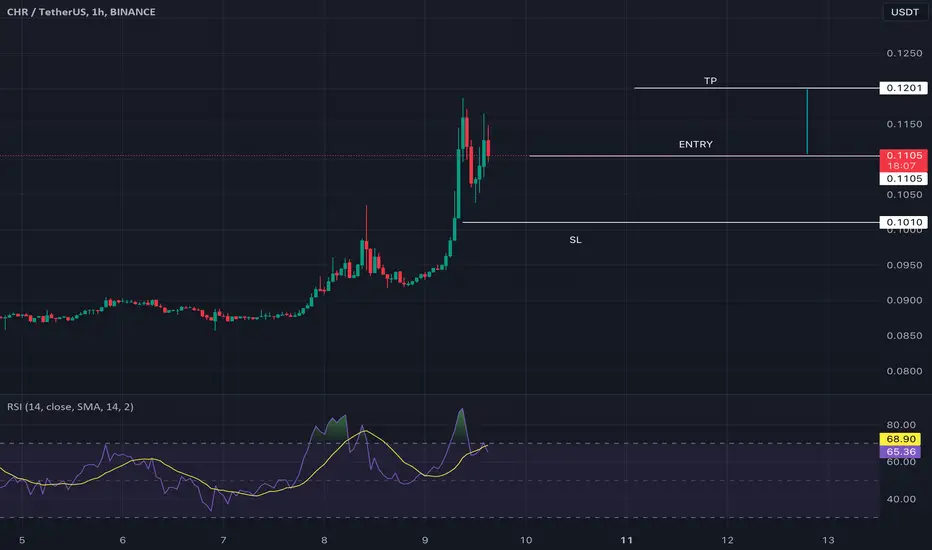
CHRUSDTCHRUSDT is in strong bullish trend and recently has given the breakout from symmetrical triangle. The price was reacting well the support and resistance of triangle.
Currently the price has break through the resistance of triangle where the buyers are showing good strength .
If the breakout sustain to upside ,the optimum target could be 0.1090 followed by 0.1140.
What you guys think of this idea?

CHRUSDT 4h and 1h with Smart money We can see that the price went up to the order block and hunted it. and could not break Then the lower trend line is broken and the price is correcting and falling
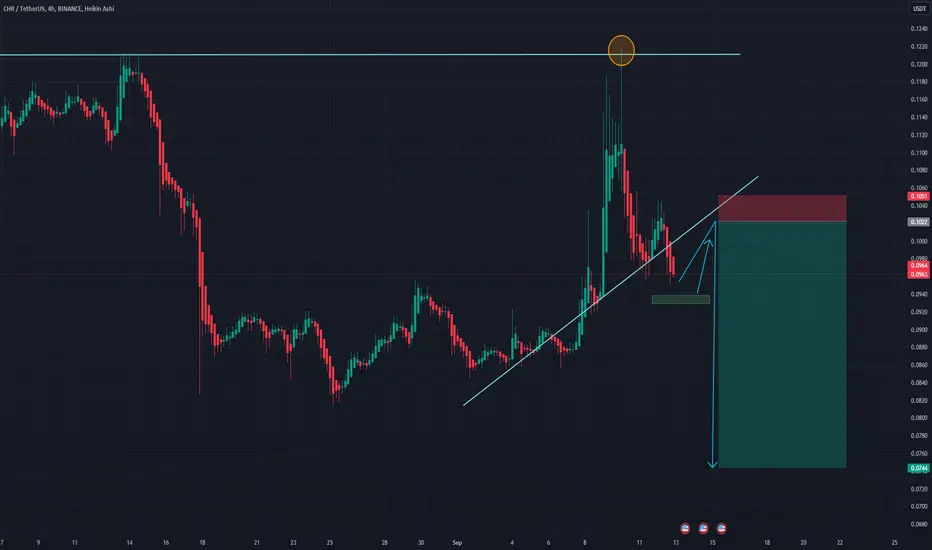
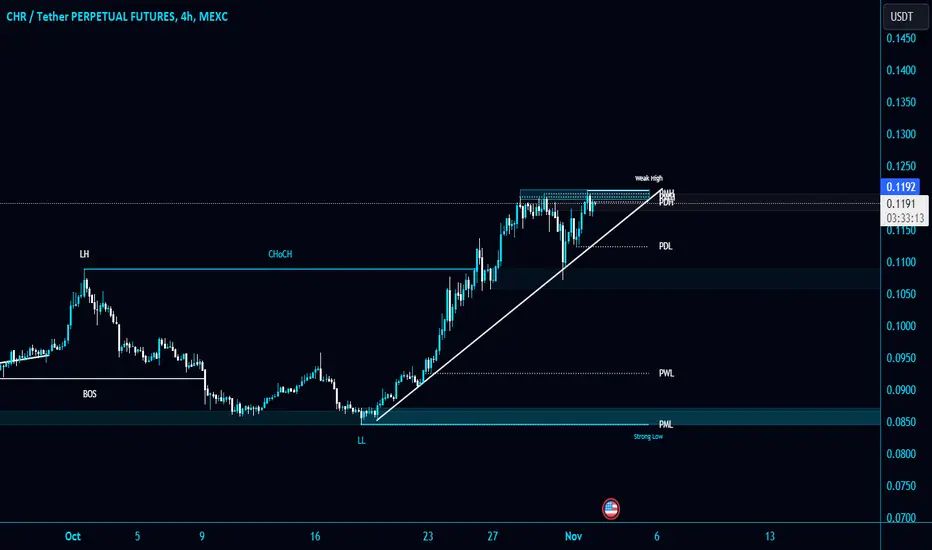
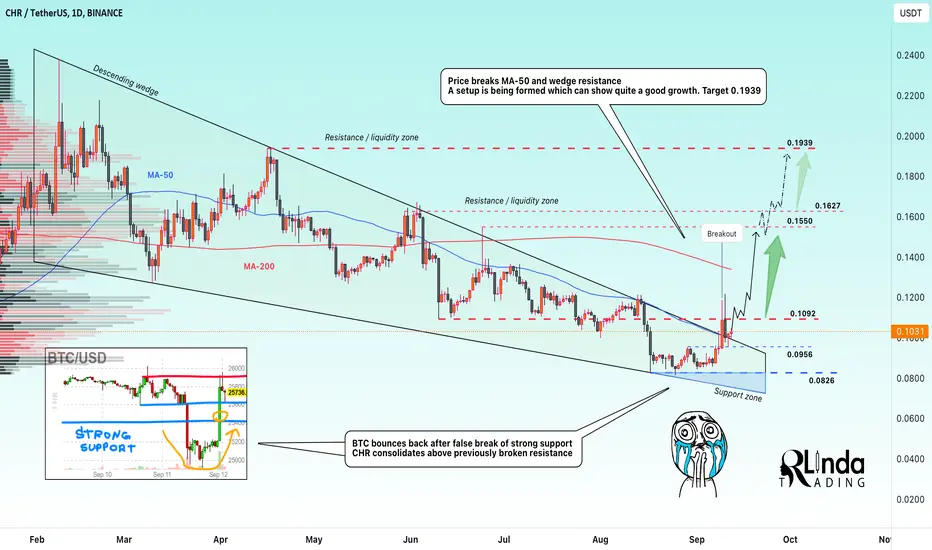
CHRUSDT → The bulls are holding the price above resistance BINANCE:CHRUSDT breaks the resistance of the wedge and gives us a good signal for a possible strengthening of the cryptocurrency pair while the market flagship - bitcoin makes a volume shakeout
On the BINANCE:CHRUSDT chart below, I have marked the strong 25400 level. We can see that price is testing this area in a false breakout format. The problem with bitcoin's weakness is that there aren't many short-term traders. Most of the volume is with medium and long term holders, hence the activity which moves in cycles over a long distance.
CHR breaks through resistance, but the moment BTC falls, the price comes back and tests the previously broken boundary. At the moment of flagging strength, CHRUSDT forms a consolidation above the line and starts to turn the price up. An important resistance for us is 0.1092, if the coin overcomes it, it will open the way to the mentioned targets
Support levels: 0.0956, 0.0826
Resistance levels: 0.1092
As the coin has strengthened above the previously broken garnet, I expect a breakout of 0.1092 and further growth
Regards R. Linda!
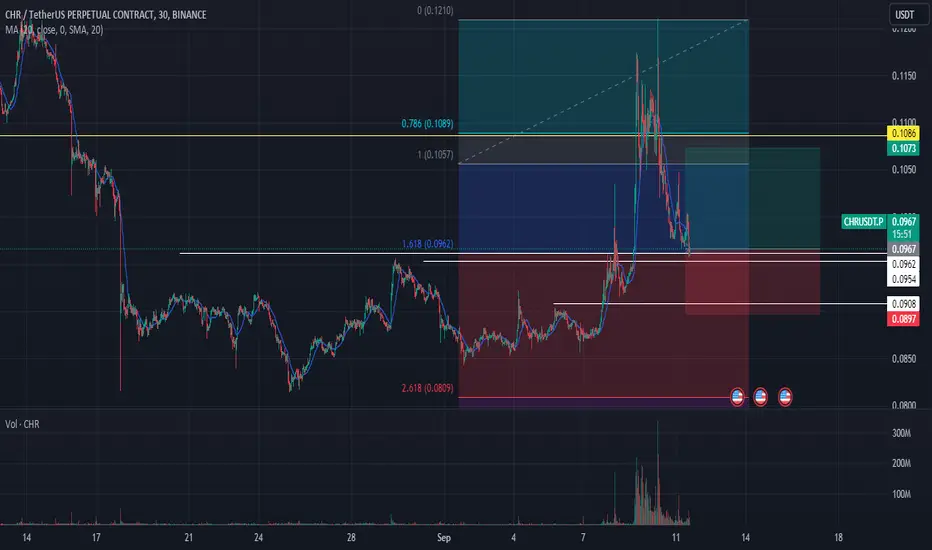
CHRUSDTIn this idea, as usually I'm using volume+Fibo to find the resistance level in the 30M+4H time frame.
I'm taking a LONG position from the white lines.
If you like my analysis don't forget to follow me for more ideas.
This is not a financial advice.
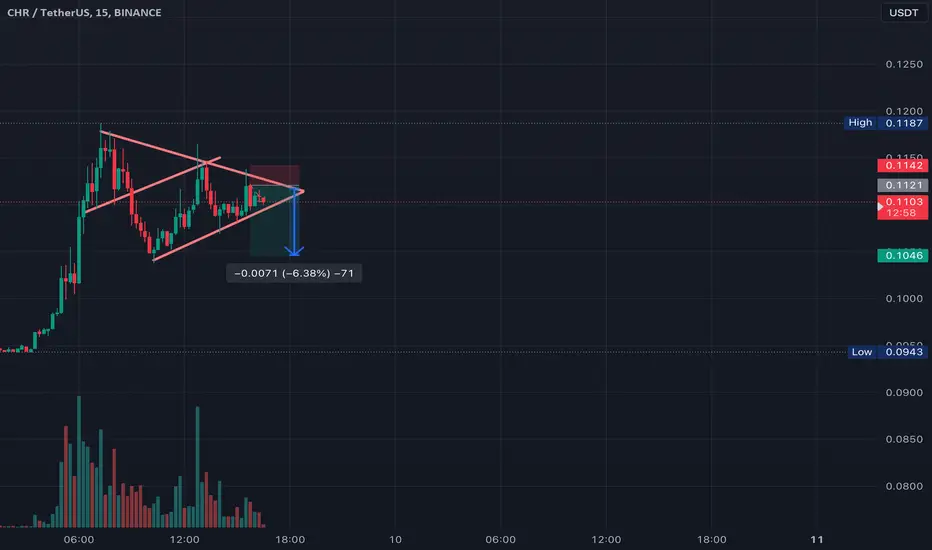
CHR shortIf the price somehow manages to hold this level for a few hours and even tries to break the trend (blue), I'm still entering short on this level

CHRUSDTHello Traders,
As we can see that after a good potensial pump we can expect a little dump in chr as it is making double top in 4hr, we can open a short position here.

just an idea watch how the price work .
im not in , I did enough trades for today
4 on profit , 1 hit entry stop loss (0 $ loss)
CHR/USDT Break the Major Descending Channel, Bullish Momentum ??Yello Paradisers, take note! #Chromia
💎 CHR has Break out its major descending channel pattern, signaling bullish momentum on the hourly timeframe and setting the stage for further upward movement.
💎 Before this pivotal moment, CHR had lost its key support area and dipped lower. However, it managed to consolidate at lower levels, successfully reclaiming the key support and breaking the pattern with significant volume. This marks a remarkable recovery for CHR.
💎 While CHR still exhibits a bearish trend—evidenced by its chart showing lower highs and lower lows—the successful breakout and reclaiming of key support suggest that CHR could potentially break past its previous lower high to establish a new higher high.
💎 Caution: This bullish outlook could be invalidated if CHR closes below the designated Bullish Invalidation level on the daily chart.
Keep your eyes on the charts and stay tuned for more updates! 🌴

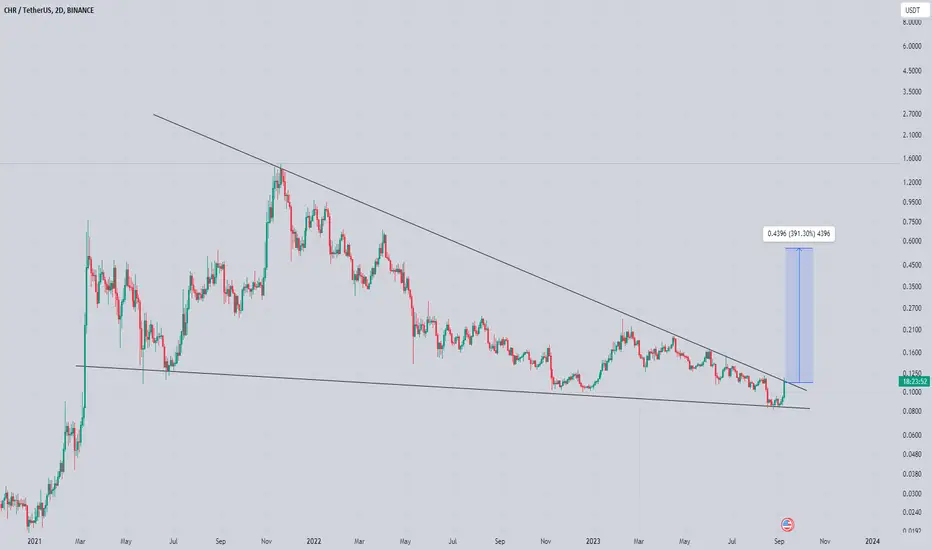
Chr Testing crucial Resistance Seems Like Getting Ready for Massive breakout
Formed falling wedge and breaking out im also expecting breakout and incase of successful breakout expecting 250% Bullisdh Rally In coming weeks keep eyes on for breakout
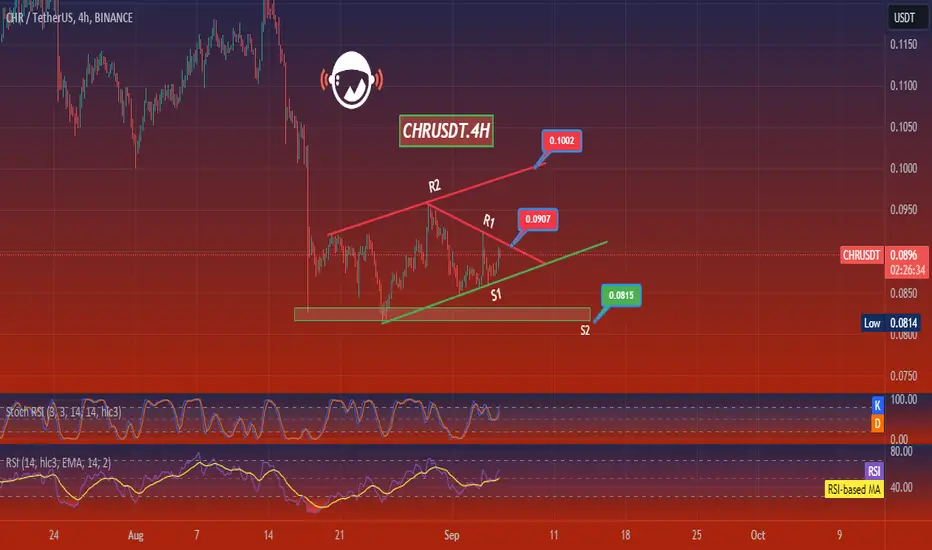
CHRUSDTThis is a 4H frame analysis for CHRUSDT Analysis of the crypto market shows that prices are in an uptrend channel and may start to move towards the second resistance line after breaking the first resistance line. However, be aware that it is close to an area where it has failed to move up after several collisions and has had price drops in advance. Suggestion: Those who have purchased this coin from lower numbers can sell in the first area if they do not want to take more risk, but it is expected that the price may move towards the second resistance line after breaking the first resistance line.

CHRUSDTHello Traders,
As we can see that CHR has made a cyber pattern as per the chart and shown us a bearish trend but currently chr has broken the resistance and now it can show us a bullish move and we can open a long position when it will retest the support zone again.

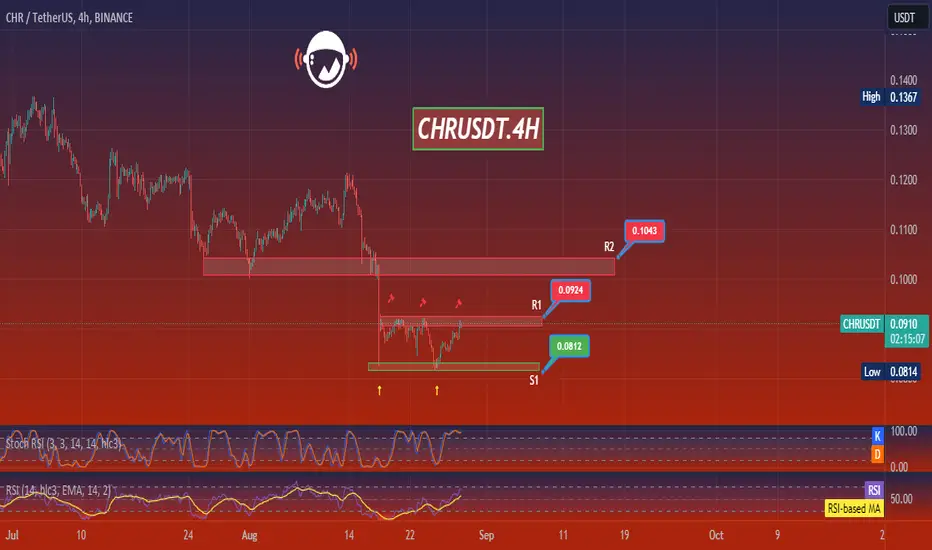
CHRUSDTThis is a 4H frame analysis for CHRUSDT As you can see, the price is in its supply zone and can show a reversal again and bring the price back to the previous support zone. However, we can see signs of upward momentum in the daily timeframe, so wait for the price to break the resistance line or the complete line and then enter the trade or wait for the price to have a pullback after the signs of decline and then enter the trade.
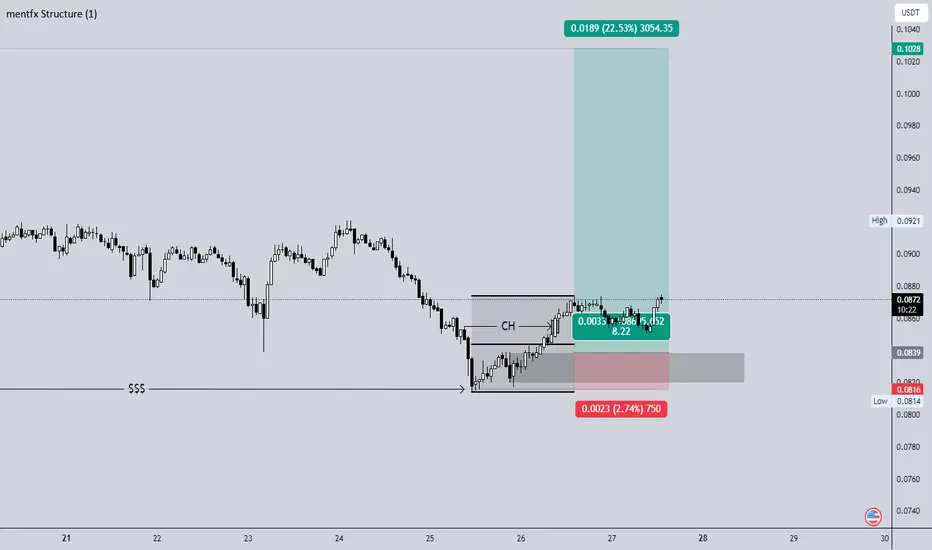
long chr## Risk & Management
- 1% capital per trade.
- Move SL to breakeven at 1:1R
## Points of Interest
- Order blocks
- Major liquidity grab
## Framework
- On the 4H timeframe, gauge overall bias & locate major points of interest.
- When price enters a point of interest, drop down to the 15M or 5M timeframe.
- Wait patiently for price to purge liquidity within the point of interest.
- Wait for price to impulsively break structure & create imbalance.
- Enter at the order block responsible for the break of structure.
## Entries
- The OB caused a BOS.
- The OB is the extreme zone.
- The OB created clear imbalance.
- Liquidity has been clearly Identified.