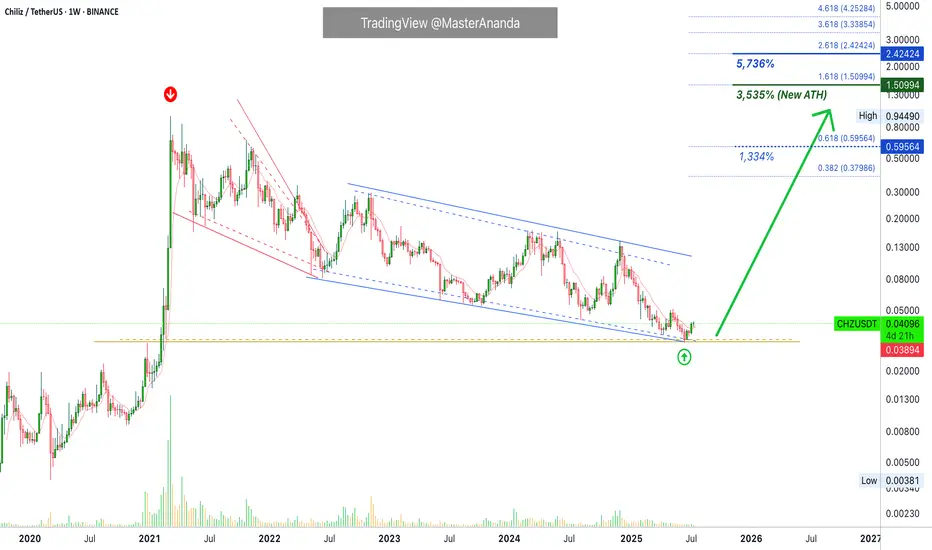
Chiliz Hitz Bottom · Opportunity Buy Zone (PP: 3,535%)Chiliz is trading at a true bottom right now after producing the lowest price in more than three years. The lowest since February 2021. No need to worry though, an early recovery is already happening and we are sure the bottom is in.
The past three weeks have been green while CHZUSDT managed to clo
CHZChiliz
Chiliz is the world’s leading blockchain fintech provider for sports & entertainment.
Everything is clear on the chart.
I wish everyone abundant profits.
Like and follow
for more.
CHILIZ CRYPTOhello. Good ?
Me no.
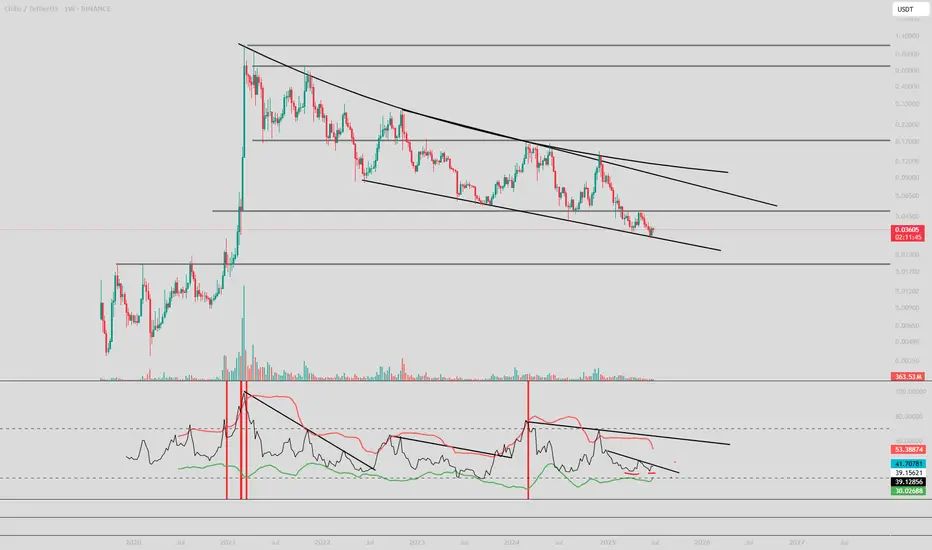
Stabilisation for Chiliz.
4 years of bears market. The bottom is probably in, because we have a bullish div in weekly...
The bottom of the canal is clear here..
Target : ATH.
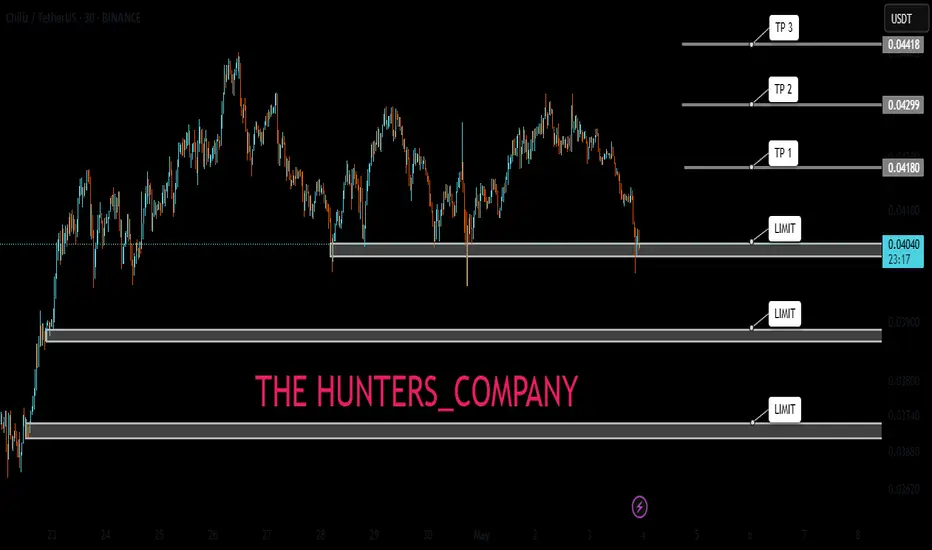
CHZ LIMIT FOR BUY(FREE)Hello friends
Due to the price drop, we can buy on the drop within the specified limits and move with it to the specified targets, of course with capital and risk management.
*Trade safely with us*
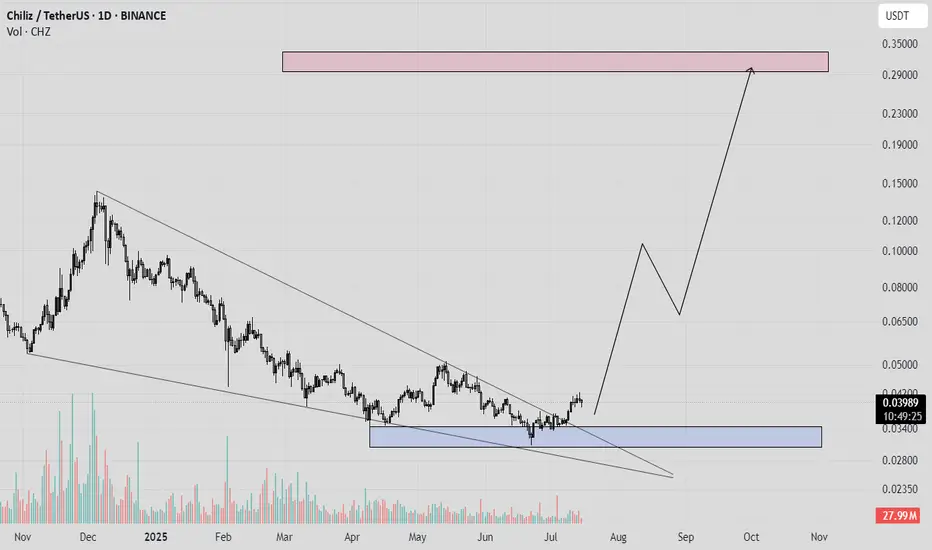
CHZ (Chiliz) Analysis – July 15, 2025 Since breaking above the $0.03 level back in 2021,
CHZ surged to nearly $0.80, recording an impressive 3,500% gain.
🧠 This move indicates that major investors entered at lower levels,
while short-term holders who bought higher have been taking profits on every price rally,
effectively capping furt

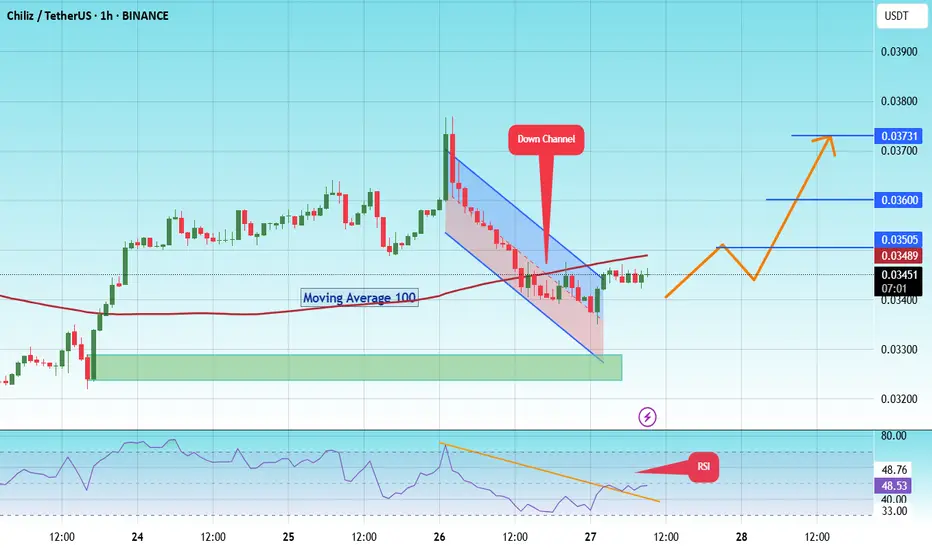
#CHZ Price is testing the Descending channel resistance #CHILIZ
The price is moving within a descending channel on the 1-hour frame and is expected to break and continue upward.
We have a trend to stabilize above the 100 moving average once again.
We have a downtrend on the RSI indicator that supports the upward break.
We have a support area at the l
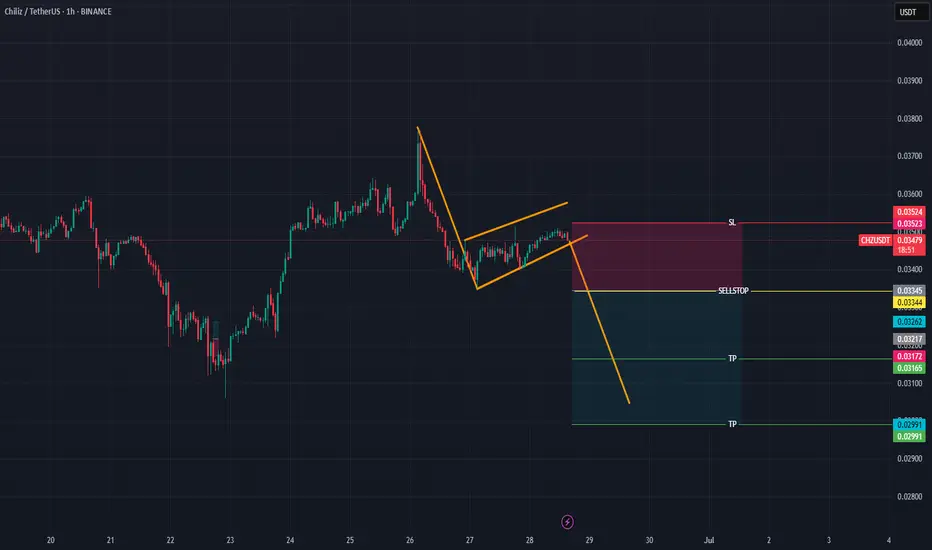
CHZUSDTBearish Trend continuation
SellStop and SL are mention on the chart
Note: Please move your SL to EP after TP1
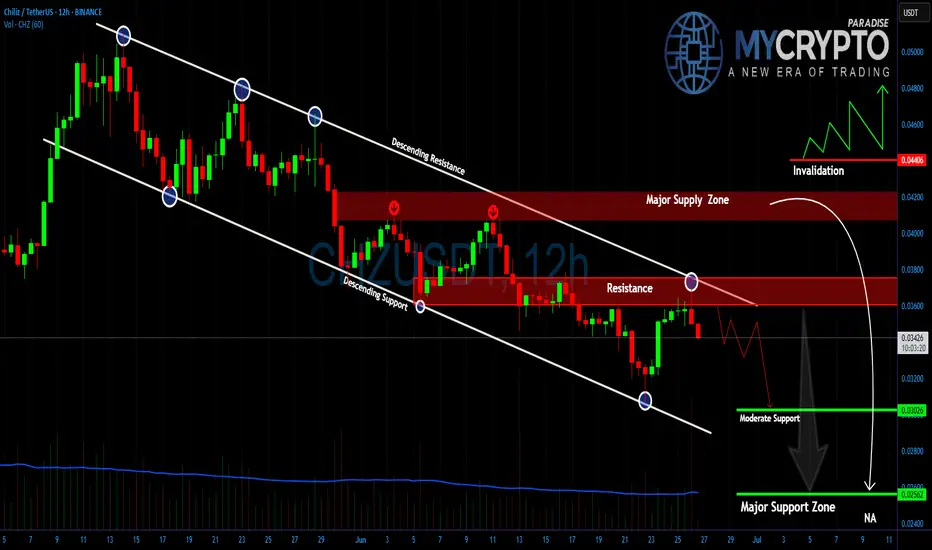
CHZ Bulls Are Getting Trapped Again —Another Nasty Drop Loading?Yello Paradisers did you notice how clean this CHZ rejection was? After a textbook touch of descending resistance, the price got slammed down again, and what comes next might catch many traders off guard. If you’re not prepared, this next leg could drain portfolios fast.
💎#CHZ/USDT continues to re
CHZ ANALYSIS📊 #CHZ Analysis
✅There is a formation of Descending triangle pattern on weekly chart 🧐
Pattern signals potential bullish movement incoming after a breakout.
👀Current Price: $0.03818
⚡️What to do ?
👀Keep an eye on #CHZ price action and volume. We can trade according to the chart and make some p

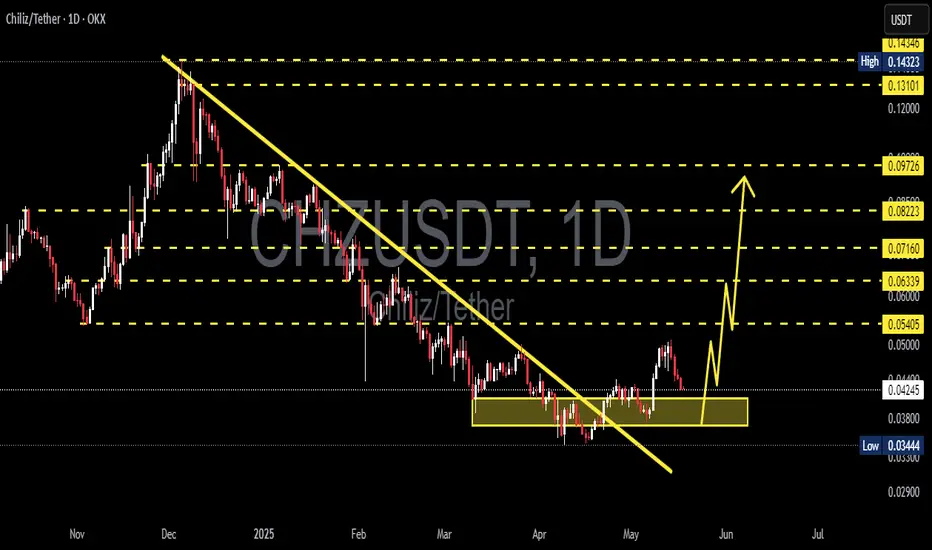
CHZUSDT 1D Analysis CHZ ~ 1D Analysis
#CHZ Buy back on retesting this support block with a short term target of at least 10%++ from here.
See all ideas
Summarizing what the indicators are suggesting.
Oscillators
Neutral
SellBuy
Strong sellStrong buy
Strong sellSellNeutralBuyStrong buy
Oscillators
Neutral
SellBuy
Strong sellStrong buy
Strong sellSellNeutralBuyStrong buy
Summary
Neutral
SellBuy
Strong sellStrong buy
Strong sellSellNeutralBuyStrong buy
Summary
Neutral
SellBuy
Strong sellStrong buy
Strong sellSellNeutralBuyStrong buy
Summary
Neutral
SellBuy
Strong sellStrong buy
Strong sellSellNeutralBuyStrong buy
Moving Averages
Neutral
SellBuy
Strong sellStrong buy
Strong sellSellNeutralBuyStrong buy
Moving Averages
Neutral
SellBuy
Strong sellStrong buy
Strong sellSellNeutralBuyStrong buy
Displays a symbol's price movements over previous years to identify recurring trends.