CHZUST trade ideas

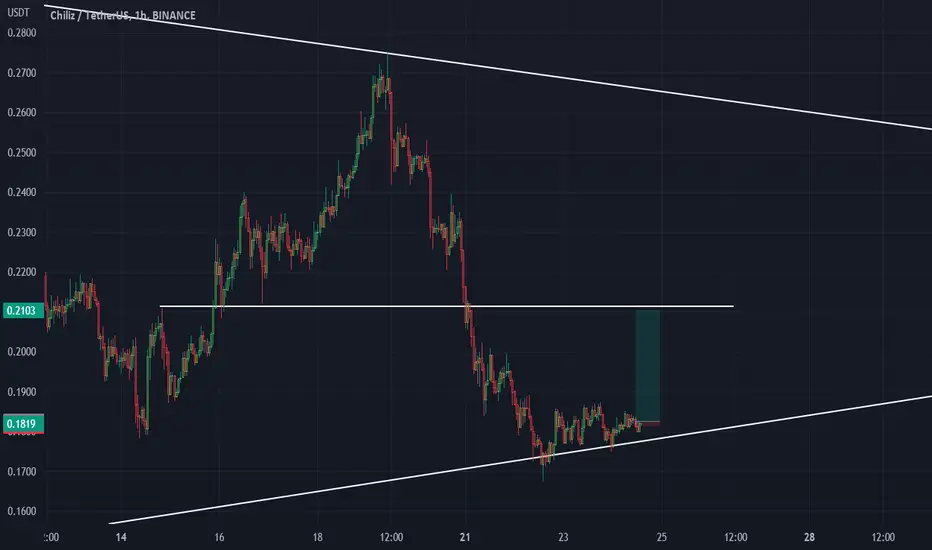
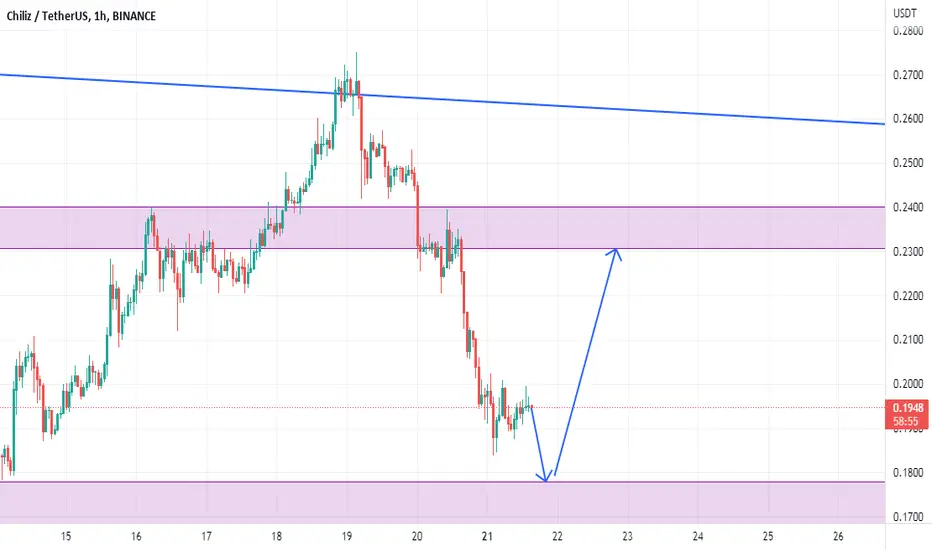
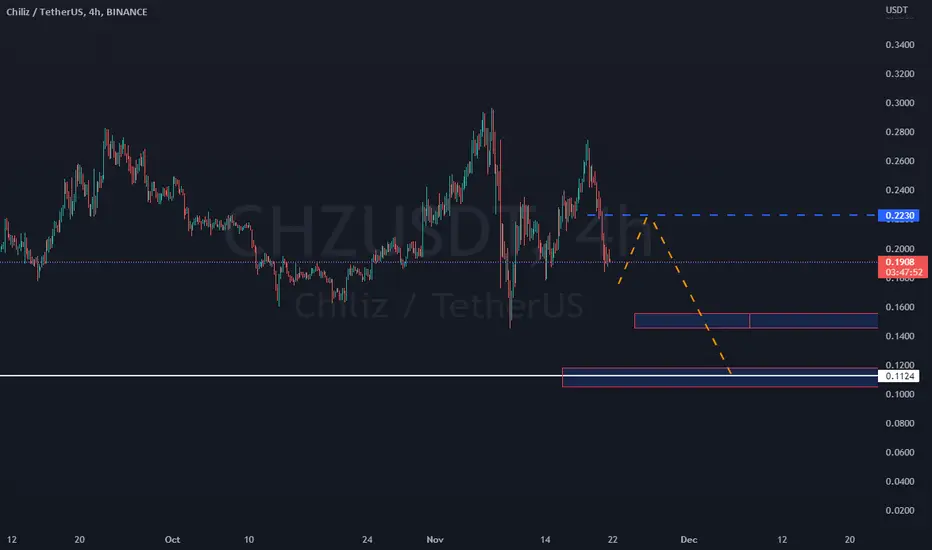
Symmetrical Triangle On CHZHello guys ,Today i saw a high risk opportunity on CHZ/USDT.
the price is on the bottom of the symmetrical triangle and if it doesn't break it you can do this scenario.
open your position after the price turn back.(wait,don't open your position fast !)
first target is about 0.205.(it's safe to close your position)
but if it's going to continue the scenario , you can close your order on 0.227.
Rsi is giving a buying signal too btw.
it's just an idea , always do your research and analysis.
don't forget to follow and boost this idea :) thank you.

CHZUSDTHuge Long Opportunity for CHZ to test previous structure
There's little sell limit orders to absorb these buys after analyzing volume.
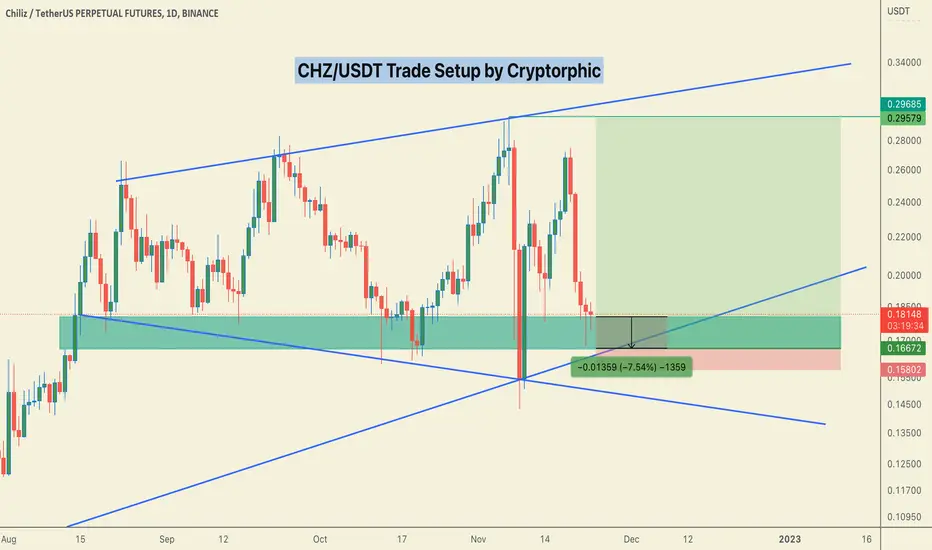
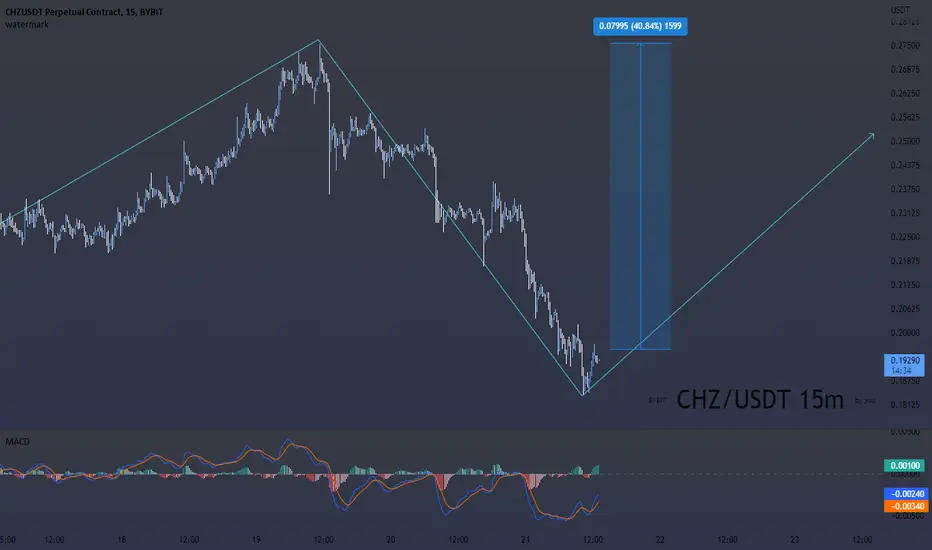
CHZ/USDT Trade Setup, 77% potential profit RR 1:14.I've already shared the reason I am opening this long in my last BTC update.
(The link is at the bottom of this update)
CHZ/USDT
Entry:- $0.17950 TO $0.16725
(7.54% is the accumulation range from CMP so plan your entry accordingly)
Stop Loss:- $0.15804
Recommended Leverage:- 3x- 5x
Target:- Open (Possibly 50% to 70%)
RR 1:14 (Highly Lucrative)
This is not financial advice. Always DYOR.
These are my trades.
Do not cry in the comments if you can't afford the Stop Loss or go for 125x gambling.
I am ready to take the SL if it gets hit.
Trade only if you can afford the SL.
Do the maths before you enter the trades and manage your risks properly.
Fund preservation is our foremost priority.
If you like me to post more. Share this idea with your friends and communities and please hit the like button.
I have been with you in the bullish days and the bearish days.
We are going to have an amazing bull run for sure.
Cheers!
Thank you
#PEACE
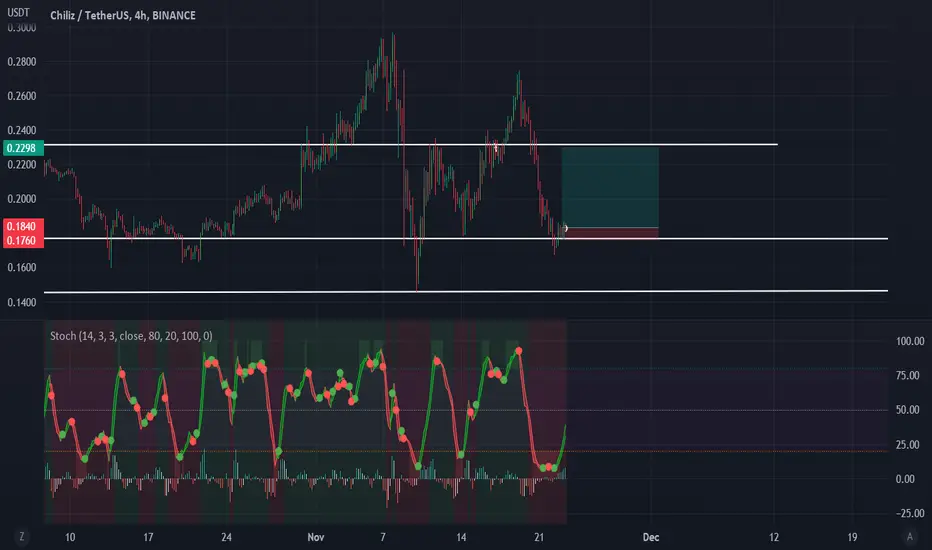
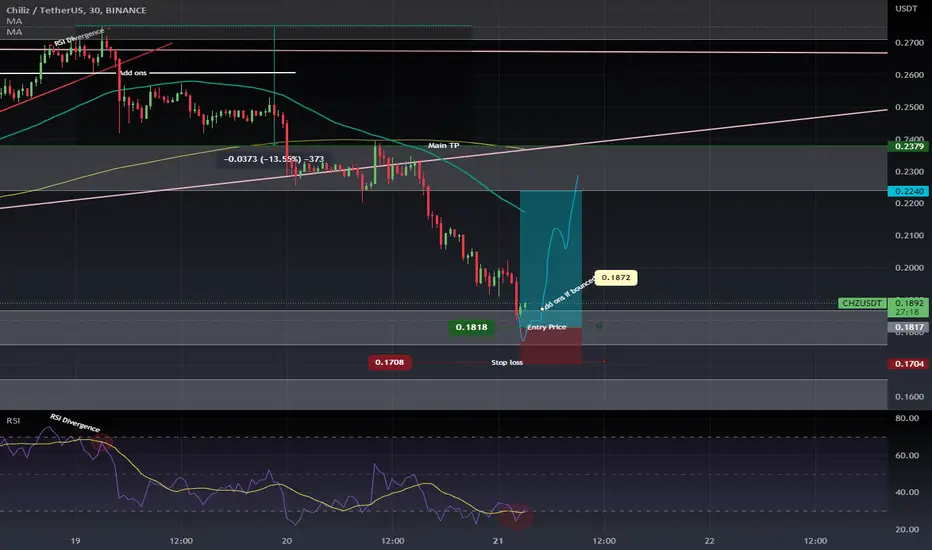
Important zone!CHZ has been re-testing the major support area of $0.158 - $0.178 and forming a triangle pattern. The price is expected to bounce off until the following resistance line. Breaking below the zone will send the price to the next support around $0.129.
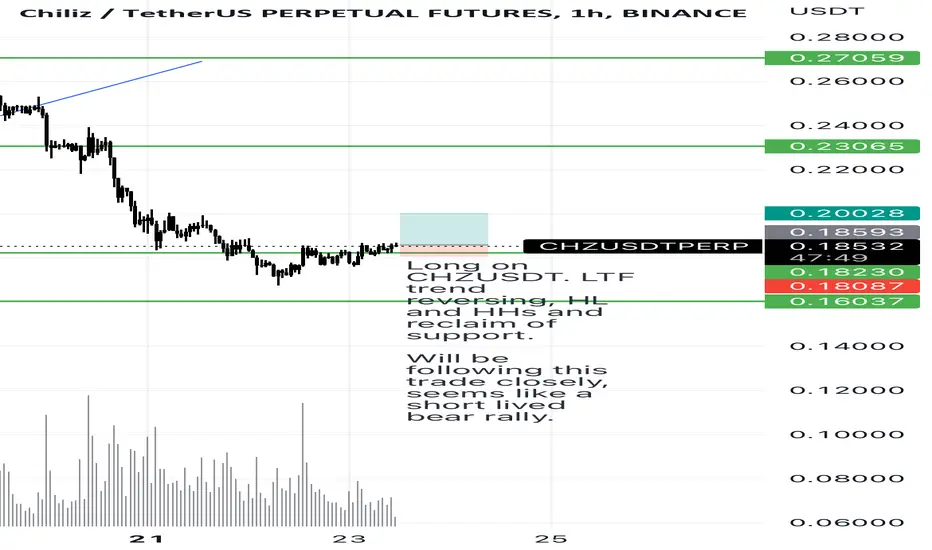
CHZUSDT - LONGLong on CHZUSDT. LTF trend reversing, HL and HHs and reclaim of support.
Will be following this trade closely, seems like a short lived bear rally.
chzusdtCHZ good to long here.
At support looking bullish
0.23 is in the Upper range and a reasonable Target
CHZUSDTHello Crypto Lovers,
Mars Signals team wishes you high profits.
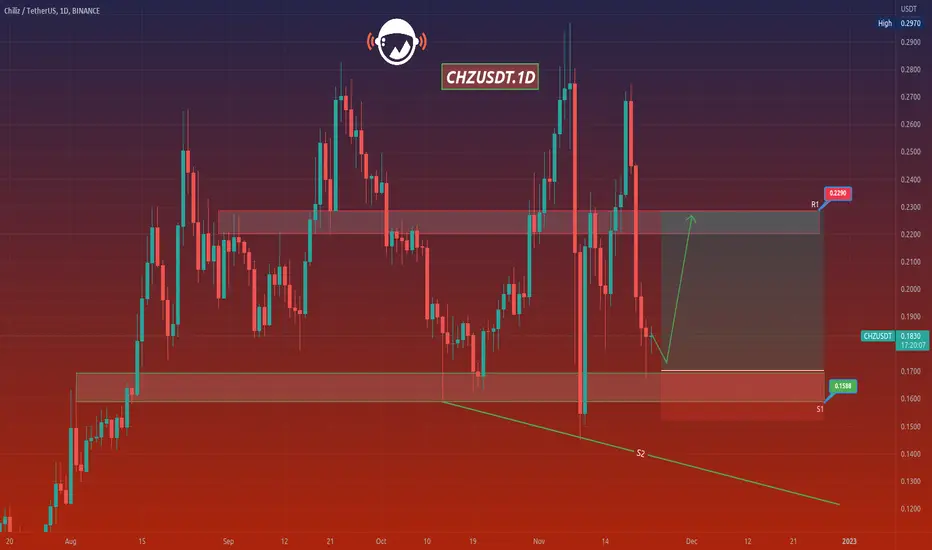
This is a one-day-time frame analysis for CHZUSDT
Here we have R1 as our resistance area which contains the disability of the price to rise. And S1 used to be another resistance area in the past. Thus, we have the fluctuation of over S1 area and our expectation would be a rise to the height of R1 after a little decline. So if we receive some confirmation candles to rise, surely the price will rise upward and the long position is activated here. Also it is probable that the price fluctuates over R1 and more increase will be there for it or even the price may fall below S1 by reaching that and face more decline to S2.
Warning: This is just a suggestion and we do not guarantee profits. We advise you to analyze the chart before opening any positions.
Wish you luck
CHILIZ will buynow the chzusdt is running near the previous low.so what we could expect??it will continue to the lower then complete the bearish move then we can see a rejection to the previous daily support.
TYORNot a advice. Up to yours. BINANCE:CHZUSDT
.50% Entry
2% Add ons (Wait til the candlestick closes and confirms.)

HZUSD | Coin overview. Detailed analysis.Hello trader Today I have prepared a new idea for you. Like and subscribe to the channel there is a lot of useful information✅
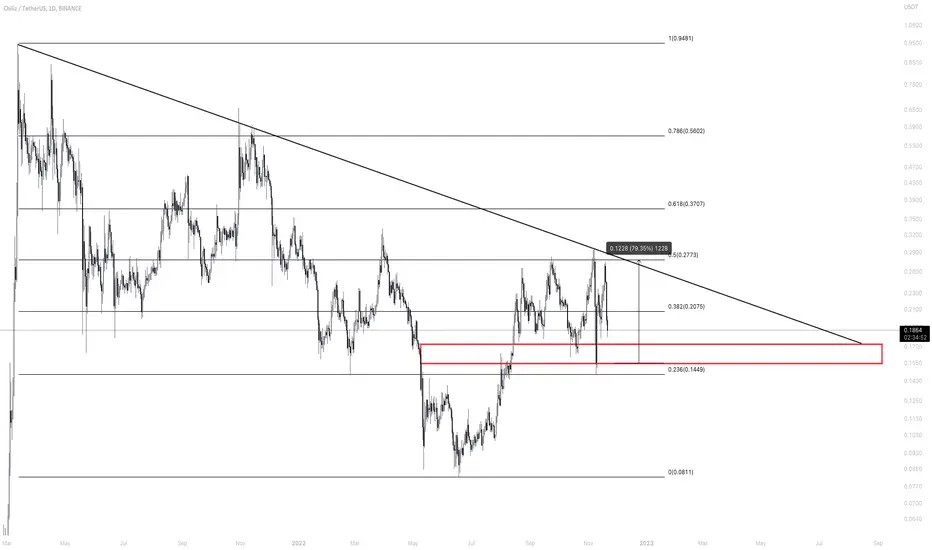
On the eve of the World Cup, the asset was trading at $0.20-$0.21, let's call it the green zone.
However, after the start of the global tournament on November 20, the Chiliz network, which allows teams to create fan tokens, lost its bullish momentum and lost more than 20% in value.
On the technical side, the graph now looks like this:
At the moment, the asset is trading at $0.1789-$0.1870
I marked the support level on the chart with a red rectangle $0.17-$0.155 as a zone of interest.
I also highlighted a countertrend line on the chart, which is resistance. If we consider growth from support, then it will be in the order of 80% profit, I think that this can happen in a short time.
While we are watching how bitcoin continues to correct, with a further recovery, the CHZ asset will go up!
short in CHZ first target 10%Warning: These trades reflect my trading history and are not investment advice and I am not your financial advisor
Trades will be updated on the same published chart such as Take Profit, Early Exit or Partial Exit..... Good luck to all

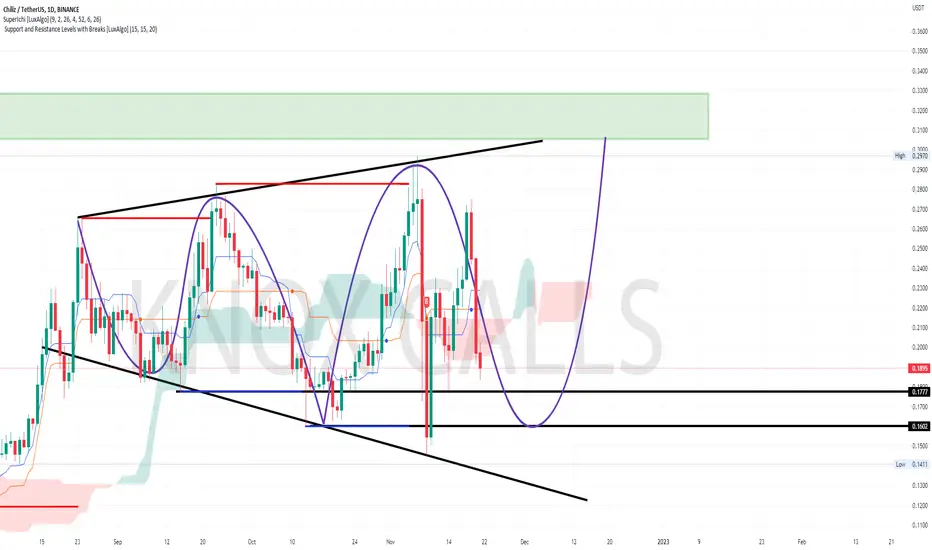
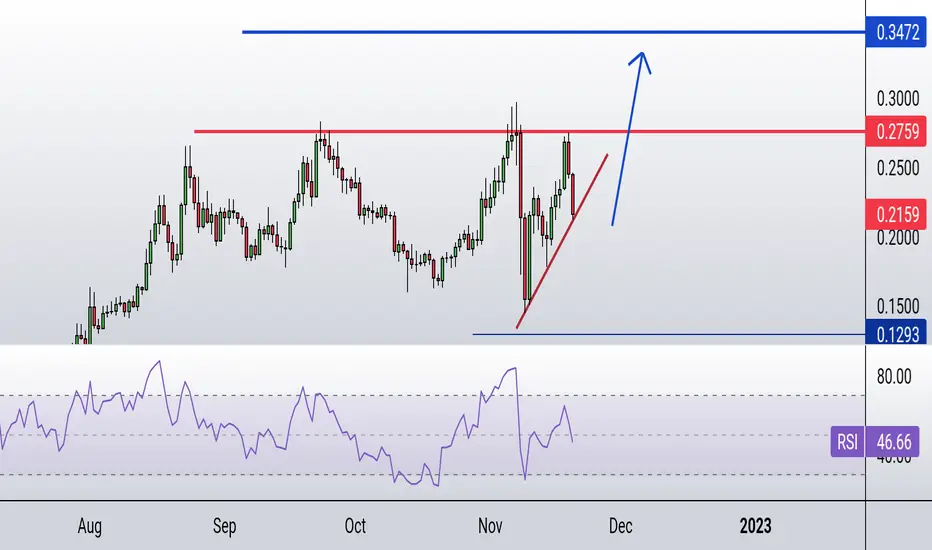
CHZUSDTHello Dear friends
If this month's candle closes positively, the situation will be very attractive, isn't it!?!?
On the weekly time frame, is it possible to complete the head and shoulder pattern at the end of the downward trend?
On the daily time frame a bullish overlapping candle has been created for us, the $0.129 support area has been maintained so far.
At the same time we have an LL. Currently, due to the type of movement, we are not in a mindset to see areas above $0.291.
The CHZ token is one of the most important sports fan tokens, which has a high probability of positive fluctuations due to the World Cup.
We would be happy to hear your comments
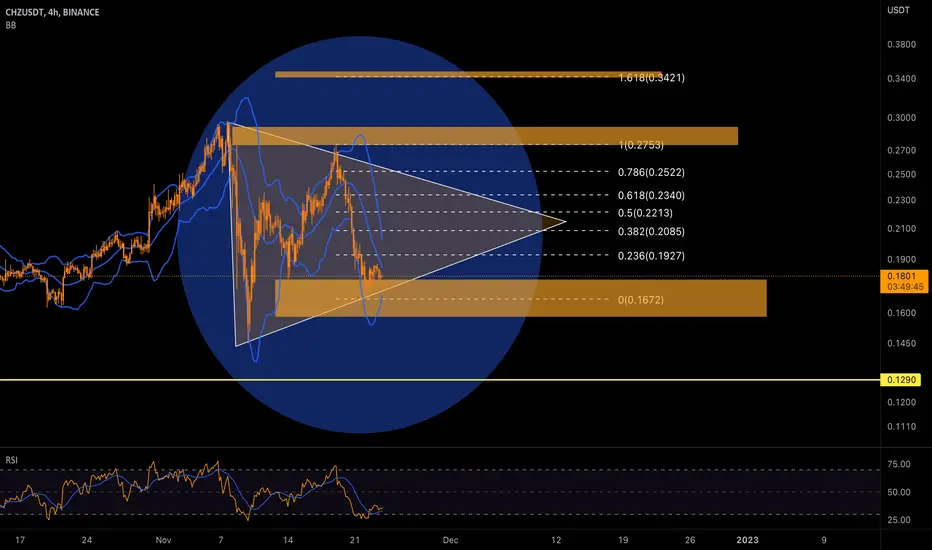
CHZ Short ScenarioAs Shown in the 4H Time Frame, There is an ABC Wace going on and now we are starting C Cycle, Here in Both Price Chart & RSI, We can See an Active Upward Trend line near its END.
So we can get in a Short Position and put our Stop Loss upper than the last Local High around 0.30 $.
Also, if the price breaks the Trend Line or If RSI Breaks the Line, a Decrease in CHZ Price will get more acceleration.
Follow The Trends

UPDATE FOR LAST TRADE STILL SHORT THERE WILL BE BLOOD IN CHZWarning: These trades reflect my trading history and are not investment advice and I am not your financial advisor
Trades will be updated on the same published chart such as Take Profit, Early Exit or Partial Exit..... Good luck to all

CHZ LONGING ON THE RECENT LOWpossible new accumulation .. specially we have new high on CHZ
already long at the newly low
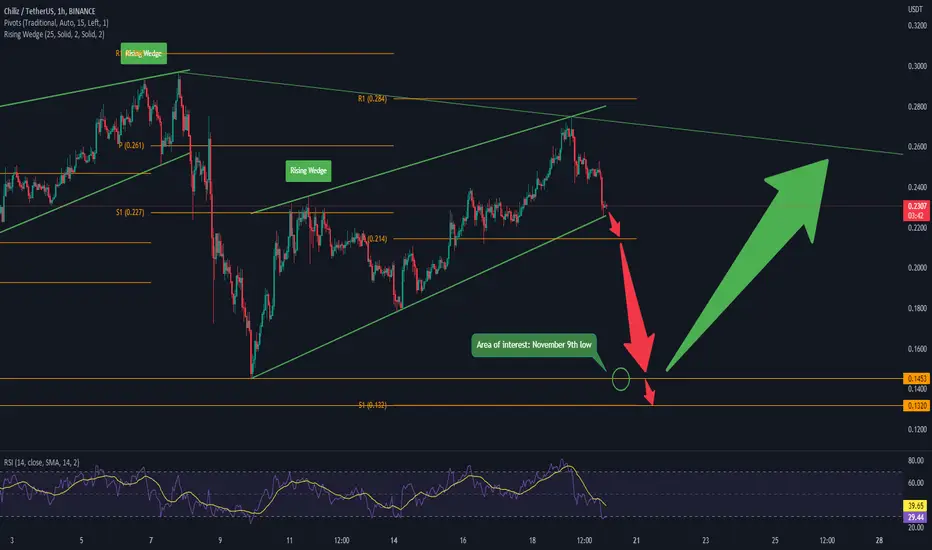
CHZ 24 hour outlookHello. CHZ is currently trading at the price of 22 cents. Our rising wedge indicator indicates that there is a rising wedge pattern on the hourly chart, so we may expect a trend to the downside within the coming days. Following this outlook, we can see that the RSI is getting ready to touch oversold positions with the RSI line, and our moving average touching below 30. One of our key levels to watch very closely is at 14 cents where we could be testing our November 9th low, which if the price reverses, could cause a trend to the upside, if done successfully. So expect some short term dips within the coming days, and keep an eye out on CHZ.
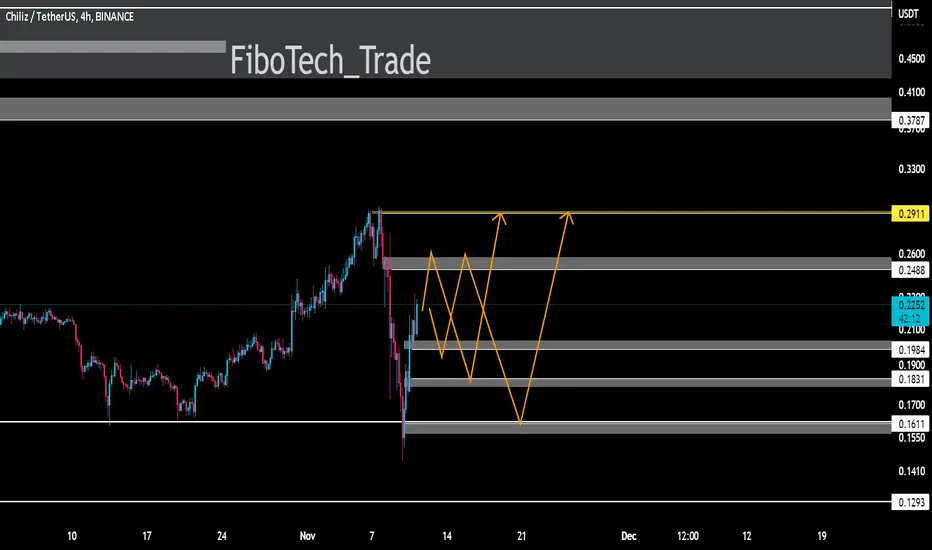
CHZ - Chiliz: Possible Price Increase Near 0.180000CHZ - Chiliz: Possible Price Increase Near 0.180000
The price is creating a megaphone pattern on the daily time frame.
Immediate support will be found near 0.180000 and this is a zone
that I am paying a lot of attention to.
From that area, we can see the price reach up to the top of the
megaphone pattern and after that, we should see if the price will rise further.
Thanks and good luck!

CHZUSDT - 1DIn the daily time frame, it is in an upward trend, this currency is responsible for part of the players' expenses in the 2023 World Cup, and the target of 35 cents for this currency is not out of mind.
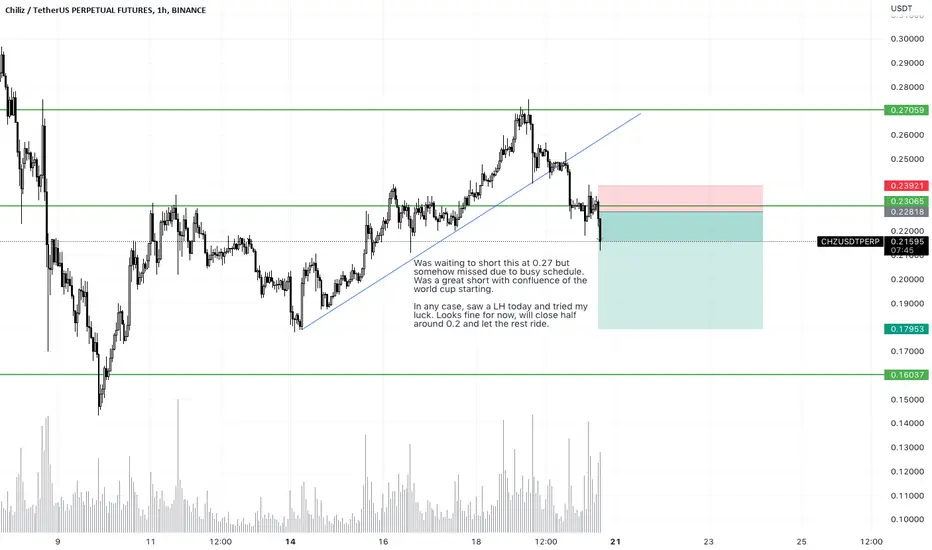
CHZUSDT - SHORTWas waiting to short this at 0.27 but somehow missed due to busy schedule. Was a great short with confluence of the world cup starting.
In any case, saw a LH today and tried my luck. Looks fine for now, will close half around 0.2 and let the rest ride.