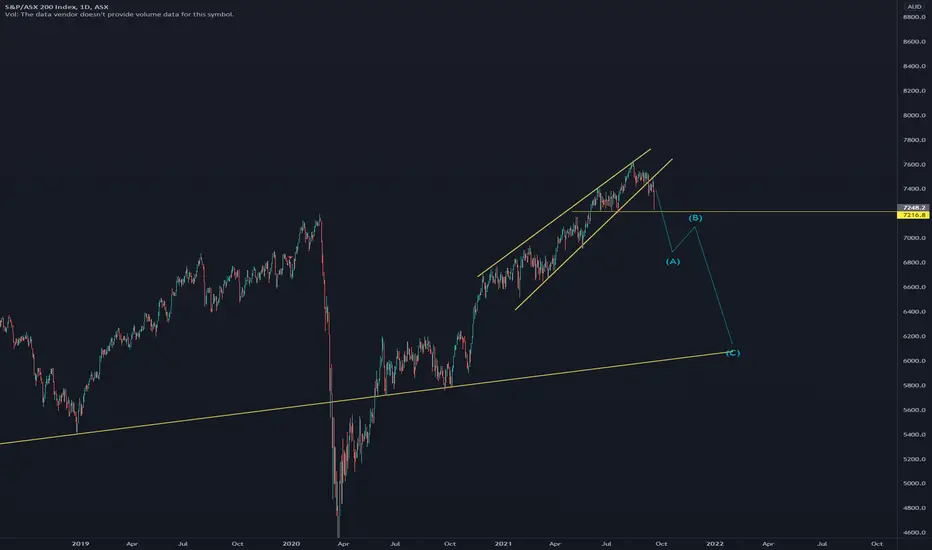
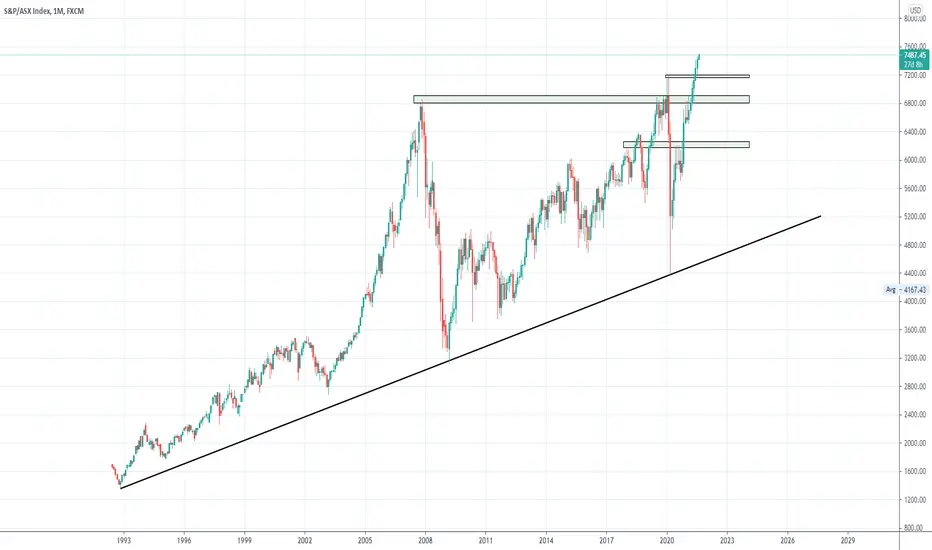
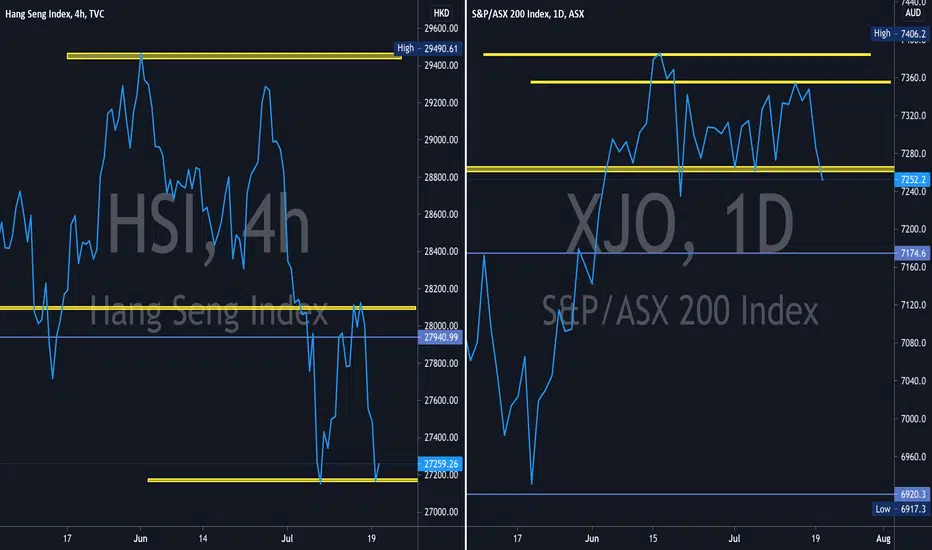
XJO breakdown** daily chart break down for XJO
** time to buy more BBOZ etf
expect XJO to reach circa 6000 points level
game is almost over.
AUSTRALIA200CFD trade ideas
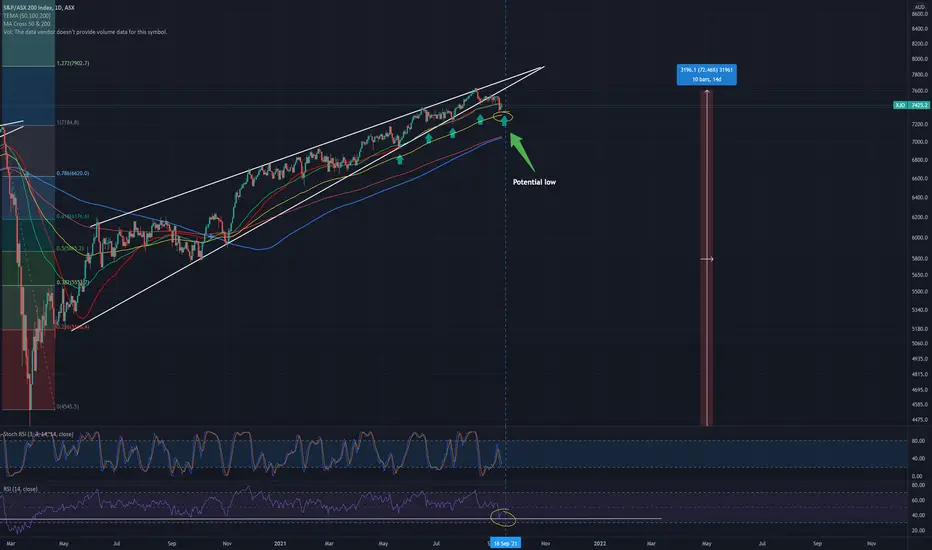
ASX 200 Long - Bounce off the 100 EMA SUMMARY: Long, dip plus buy with potential low around the 17th Sept.
Broken out of a multi-year falling wedge. Likely to see continuation of the trend as monetary policy supports asset price inflation.
S&P/ASX 200 Index - Aug / Sep Turn of the Month EffectNo evidence of an August / September Turn of the Month Effect for the S&P ASX 200 Index (ASX:XJO). Since 2000, the last 2 days of August & first 2 days of September reveals a slight upward bias. Albeit, noise dominates the data. 4-day average return of 0.35%, win rate 12 from 21, standard deviation of 1.67%.

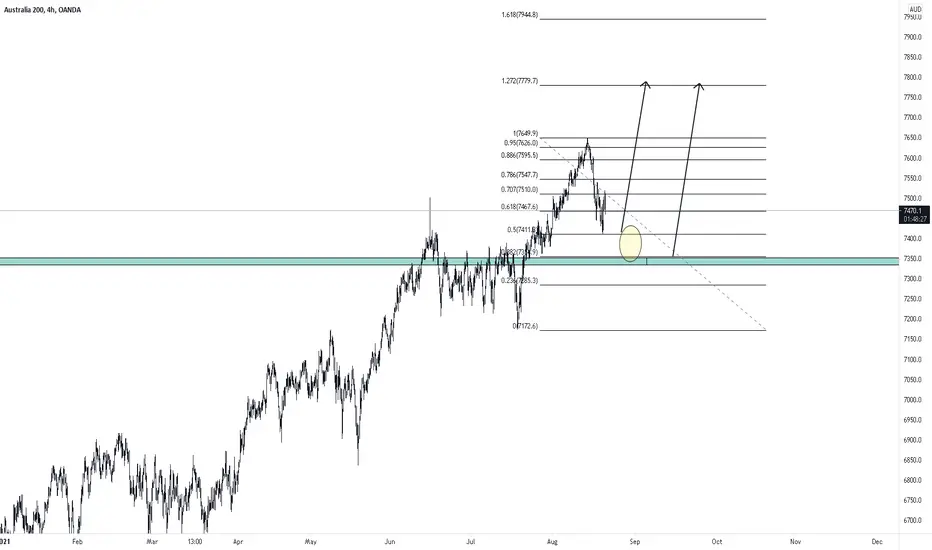
asx will see 8000 soon we predict main trend + up to 8000
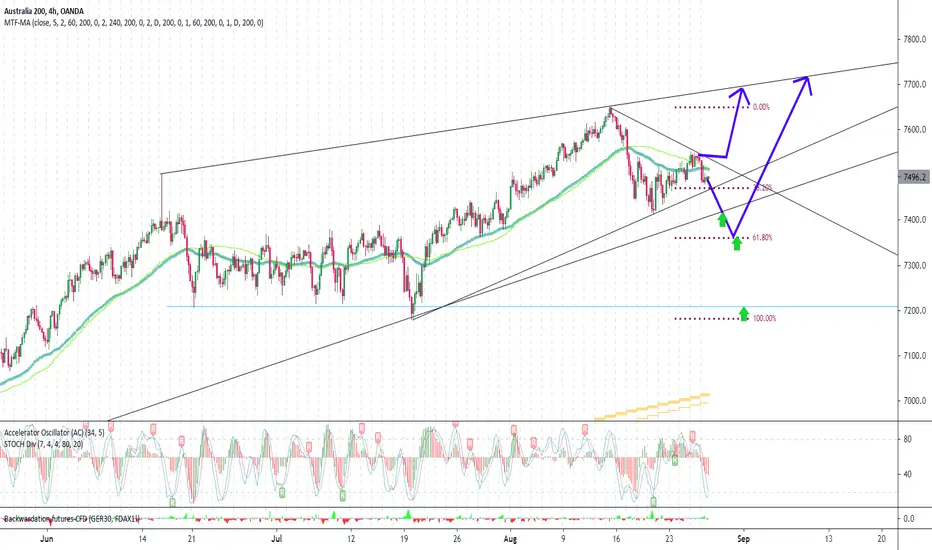
green arrow=next low ,,powerfull buylimit place for hold 20 day to new high 7700
we advice trade germany dax FDAX1! ,not asx ,it is world no1 high voltile index
AUS200 preparing for Selllet's see the chart plays out, as the analysis shown in the chart and fundamental Australia country still cont to taking care covid cases
AUS200 create bearish continuationlooking at the chart shown this index on falling wedge, preparing for SELL

XJO - Historical Performance - Last 5 trading days of AugustSince 2000, the historical performance of the S&P ASX 200 Index XJO for the last 5 trading days of August reveals a slight upward bias. Albeit, noise dominates the data. 5-day average return of 0.51%, win rate 13 from 21, standard deviation 1.98%.

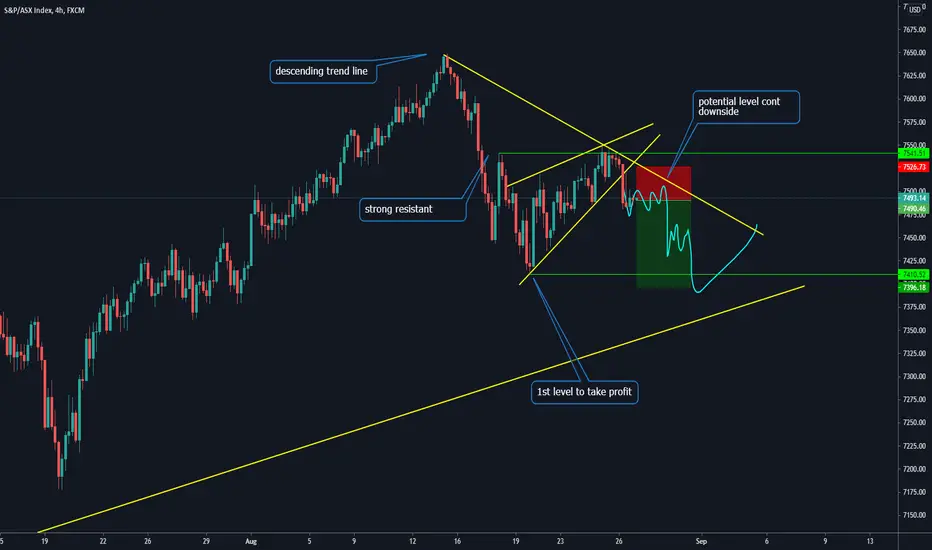
Asx short at highso a very special divergence has formed and from our top down analysis we can see a rejection creating a retracement which has led to a somewhat change in structure and the formation of a dropping wedge
Such a Textbook setup is always bound to betray u keep ur guard up

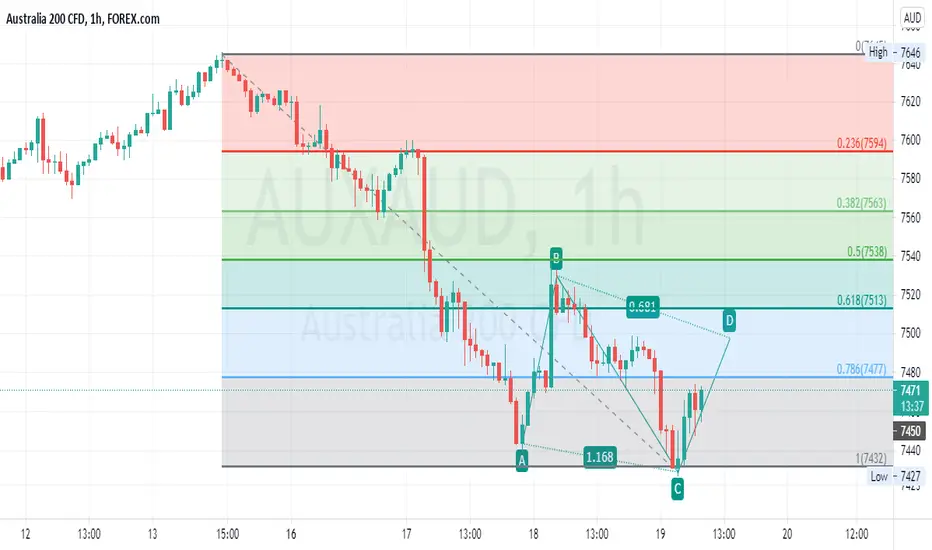
AU200 OpportunitiesAU200 managed to reject the 50 percent very nicely. Structure remains bullish. As long as price does not break the level marked with the rectangle and closes below, the structure will remain bullish and long opportunities could be taken.
AUS200 SHORT and double channel AUS200 SHORT and double channel . stop abv last week high target 50-100dma
XJO - Technicals are saying a bearish move could be on the wayThe XJO chart has a bearish rising wedge formation that is coming to a cross roads. Looks like a break to the downside is highly probable leading into the end of the 20/21 financial year.

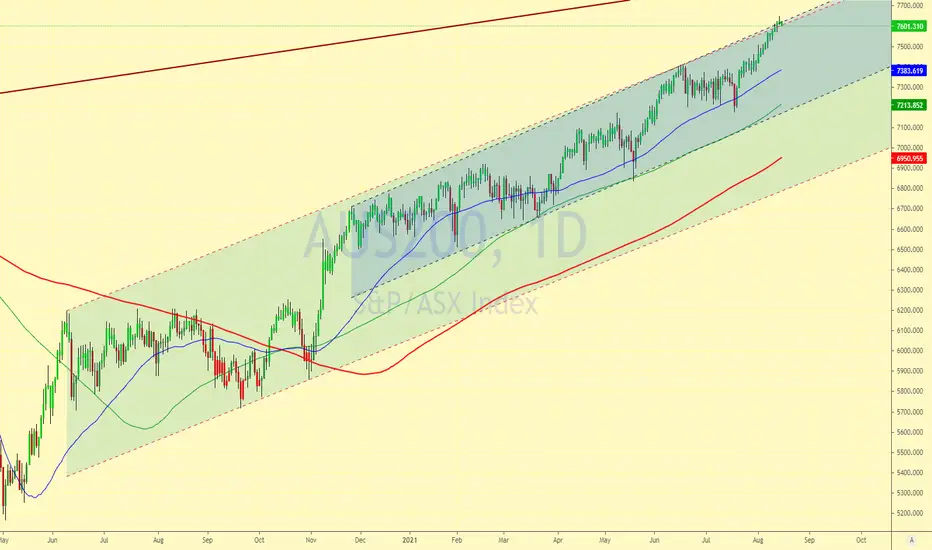
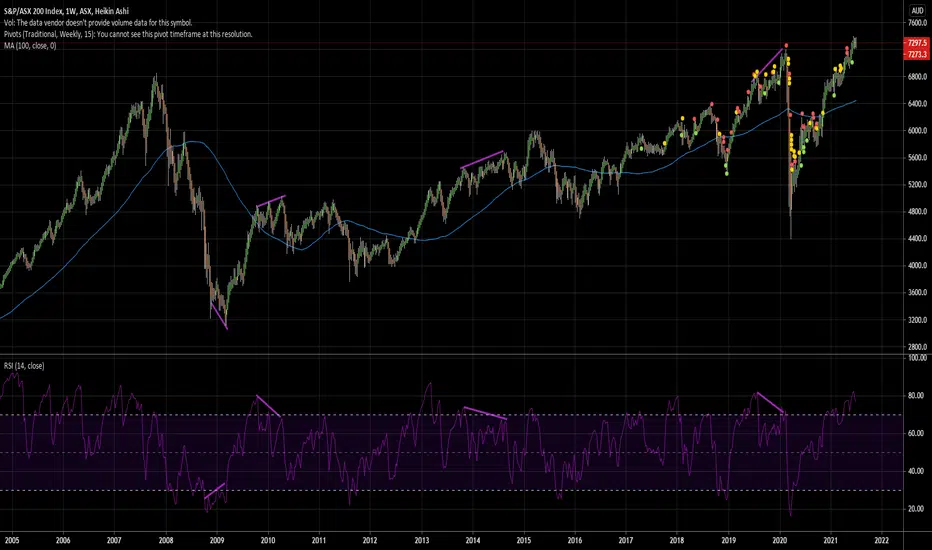
Australian stocks looking pretty goodAfter more than a decade of poor performance relative to other markets, the Australian stock market has clearly broken out. At least it has broken out in AUD terms, not USD terms (not yet). It's looking pretty strong and in my opinion it could continue much higher. Definitely one market that makes me have a more bullish outlook on stocks in general.
At some point it could return to 6300, but for now I can easily see it go to 10000 over the next 12-18 months.
LONG ASX - Rising Wedge and Bearish RSI Divergence RiskSUMMARY: Long, expect to see continued fiscal and monetary support pushing asset prices higher
ASX200 is highly correlated to the S&P500. Correction in the SPX will cause one in the ASX.
-- Technical --
It is a bearish and the price action is way above the EMAs , a correction is due.
--Fundamentals --
However, because of the government support, anticipate further upside.
Please HIT the --->>> "LIKE" and "FOLLOW" button. <<<----
*Not financial advice and is for educational purposes only. Always DYOR.
SO: What do you think, i? Let me know below.

AU200 No clear direction yet. Overall trend remains bullish.No clear direction yet for the Au200 although Higher time frame trend remains bullish but price is trapped into a consolidation phase. Needs to break to either side in order for a possible trade opportunity to be given.

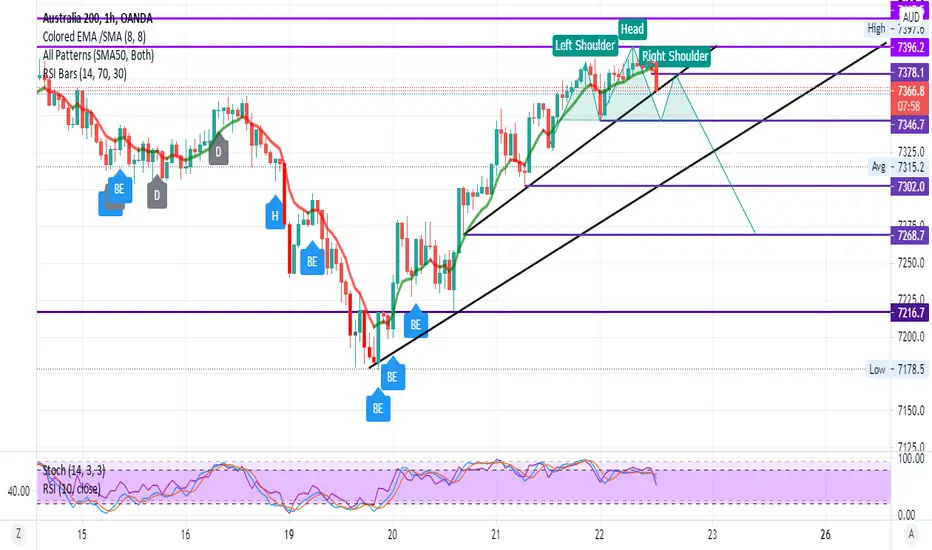
AU200 H1 POSSIBLE H & S PatternAU200 H1 possible head and shoulders pattern forming where price may move downwards. keep an eye out for sell positions. apply necessary risk management.
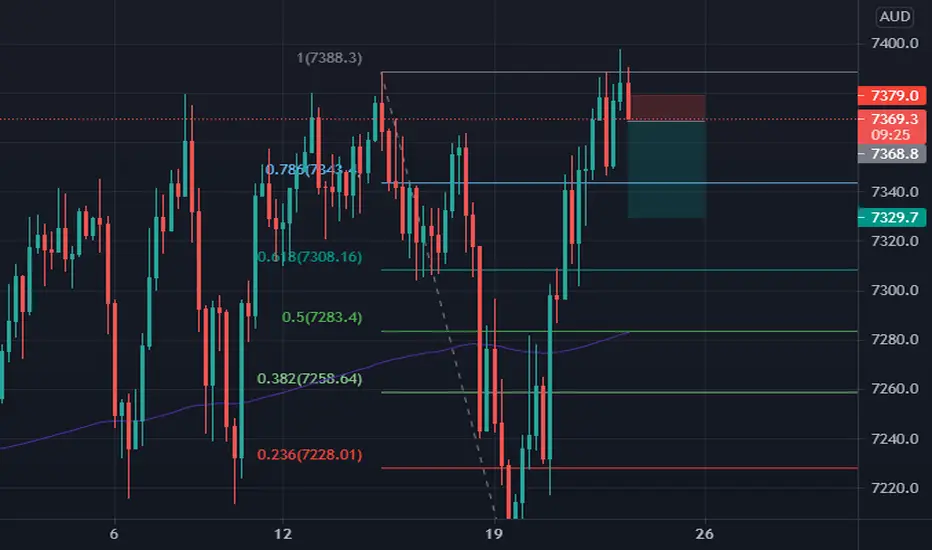
200AUD Short Positions Target 7329.00i am shorting aussie index due to covid if you wanna make it simple
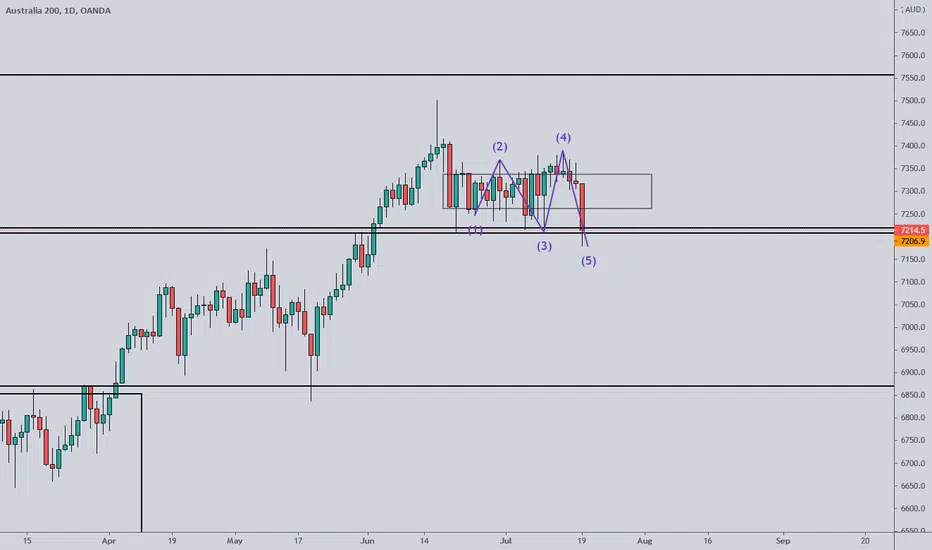
AU200 - 5 COUNT REVERSALAU200 has just completed a 5 count reversal on the daily.
Market has just taken out all new stops in June/July.
This is an indication to go Long
First target would be in the top third of the box
Thank you
Expected Breakout Higher in AUS200Disclaimer
The views expressed are mine and do not represent the views of my employers and business partners. Persons acting on these recommendations are doing so at their own risk. These recommendations are not a solicitation to buy or to sell but are for purely discussion purposes. At the time publishing, I have a position in AUS200.
Trend Analysis
The main view of this trade idea is on the 1-Hour chart. AUS200 has been in a rangebound move and is expected to breakout in the short to medium term. Based on the market profile, the range is between 7255 and 7325.
Technical Indicators
AUS200 recently crossed above its short (25-SMA), medium (75-SMA) and fractal moving averages and it is currently at the middle of the range. The RSI is above 50 and is heading higher. Moreover, the KST confirmed bullish move with a positive crossover.
Recommendation
The recommendation will be to go long at market. At the time of publishing AUS200 is trading around 7293. The medium-term target price is observed around the 7400 price level. A stop loss is set at 7200.

XJO in overbought territory but still tracking okI wonder if a sentiment change is coming. No indications yet.

Risk Management - Tom DeMark TD 9 Still in Play ASX200 $XJO Was 7406 the top for the short term?
Was the breakout this week a bull trap?
Technical indicators such as the MACD and RSI are still with the bears.
If we close below the 21 daily moving average, time to reduce position size and risk until we can close above 7406 again.
