Short HK50 27 Jun'23Trap was there
Key lesson: Degree of sharpness of consolidation moves in and around trap structure affects pullback depth. More sharp reactions --> less pullback depth and vice versa
Ok location
HTF flow didn't align as well
Micro trade management could have been better
Need to get into high confidence backed by reasoning and data mode.
HONGKONG50CFD trade ideas

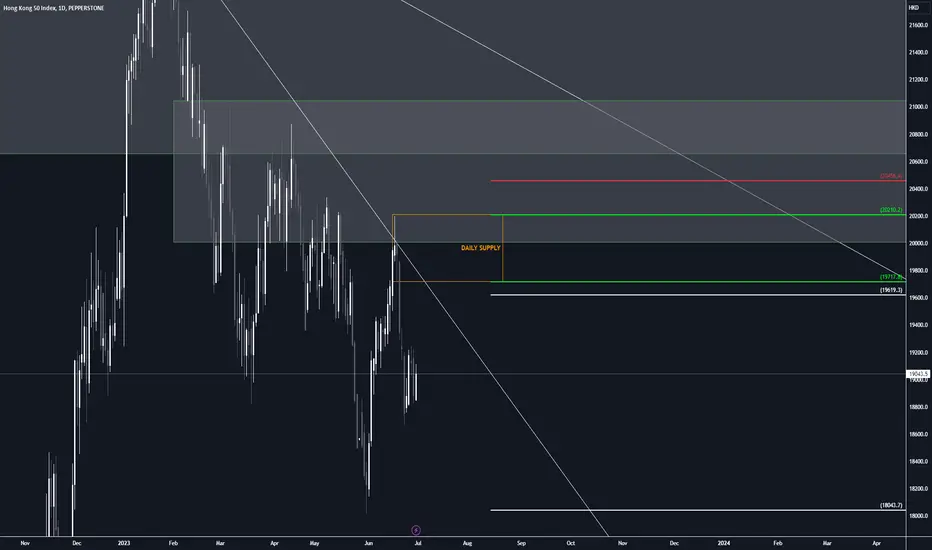
SHORT - HK50 (2 Jul 2023)Position Trade - HK50
Monthly:
- MN supply is in control, thus we will look for selling opportunities
Daily:
- A fresh area of supply is found within the monthly supply. Wait for price to retrace to continue to sell
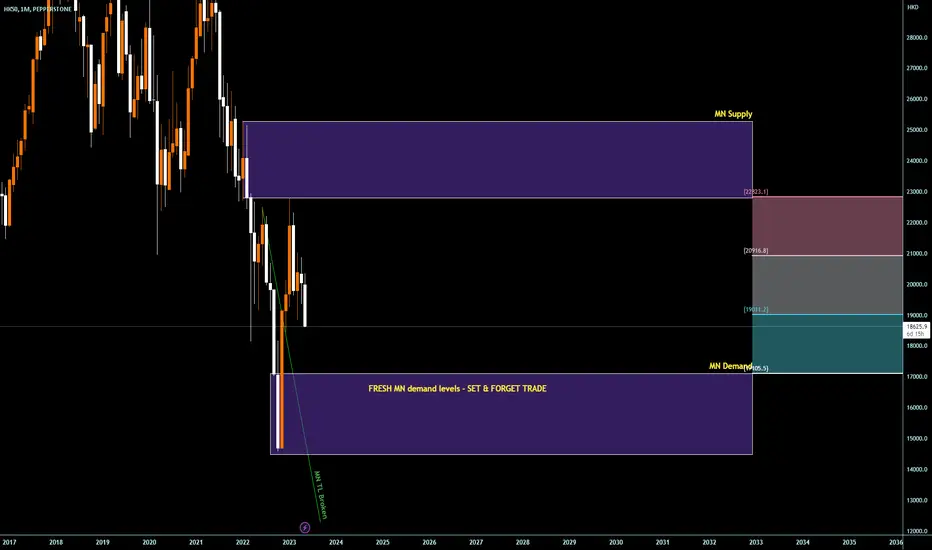
LONG - HK50 (WK and D) (25 May 2023)P osition Trade - HK50
- MN TL is broken and is low in the CURVE
- Price is retracing back to MN demand zone which is FRESH; great opportunity to go LONG for swing trading with huge room for profit
However, one thing unsure is if price is strong enough to break WK CP pattern (in green), or will re-test it again before price can dive straight into MN fresh demand zone
If not, there are 2 potential long term profitable trades as the MN demand FRESH zone is too delicious to miss~
WK Demand Trade/s
- SET & FORGET at WK Demand zone
Daily Demand Trades/s
- SET & FORGET at Demand zones
---2 potential zones (1 shallower price point, 1 deeper price point)
Pending orders at WK and Daily are set
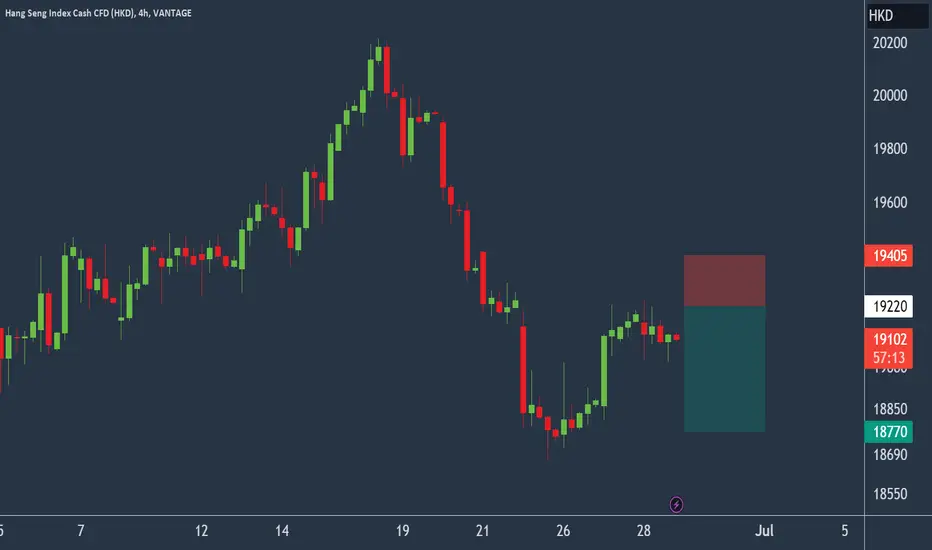
HKEX to stall at recent high?HS50 - 24h expiry - We look to Sell at 19220 (stop at 19405)
Price action looks to be forming a top.
The 200 day moving average should provide resistance at 19235.
This is negative for sentiment and the downtrend has potential to return.
Preferred trade is to sell into rallies.
Further downside is expected although we prefer to sell into rallies close to the 19220 level.
Our profit targets will be 18770 and 18670
Resistance: 19840 / 20400 / 20965
Support: 18015 / 17710 / 16320
Please be advised that the information presented on TradingView is provided to Vantage (‘Vantage Global Limited’, ‘we’) by a third-party provider (‘Everest Fortune Group’). Please be reminded that you are solely responsible for the trading decisions on your account. There is a very high degree of risk involved in trading. Any information and/or content is intended entirely for research, educational and informational purposes only and does not constitute investment or consultation advice or investment strategy. The information is not tailored to the investment needs of any specific person and therefore does not involve a consideration of any of the investment objectives, financial situation or needs of any viewer that may receive it. Kindly also note that past performance is not a reliable indicator of future results. Actual results may differ materially from those anticipated in forward-looking or past performance statements. We assume no liability as to the accuracy or completeness of any of the information and/or content provided herein and the Company cannot be held responsible for any omission, mistake nor for any loss or damage including without limitation to any loss of profit which may arise from reliance on any information supplied by Everest Fortune Group.
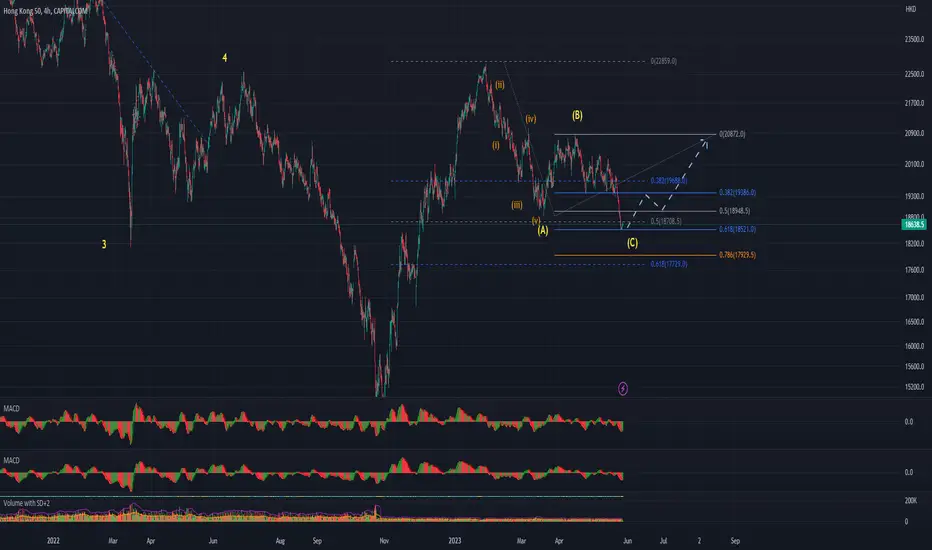
HSI need a break outFor Bulls, it needs to break out from the RED ZONE and target 22k.
RED ZONE is the accumulation part and currently stuck between Fib 0.5 and .0382

Partial probably final result for drawing freelyI like the result. Could have gone better. Doesn't seem pure random. It kind of makes sense depending from where you look. Or is it just me?

USDJPY The BreakDownAllow me to protect my reputation
by saying that you should not
--
buy what i tell you
to buy or sell what i tell you to sell
--
Am not an expert in trading
i just have a high interest
--
Please do your own research
--
Now in this video, i explain to you
why its a good time to
--
trade USDJPY
also as a BONUS
--
in the video, i show you another Forex pair you can
--
trade as a way of saying thank you
--
for the support.
Watch the video to learn more.
Regards,
LubosiForex

Drawing freely from the SubconsciousIs there any hidden message in this picture? Or is it just a pointless peace of Art?

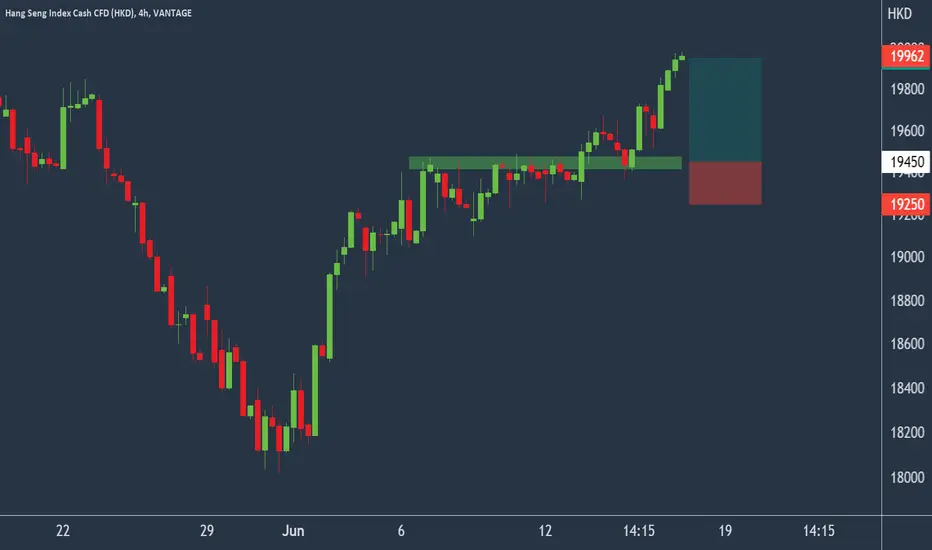
HKEX to find buyers at previous resistance?HS50 - 24h expiry - We look to Buy at 19450 (stop at 19250)
We are trading at overbought extremes.
A lower correction is expected.
Short term bias has turned positive.
We therefore, prefer to fade into the dip with a tight stop in anticipation of a move back higher.
Further upside is expected although we prefer to buy into dips close to the 19430 level.
Our profit targets will be 19950 and 20000
Resistance: 20400 / 20965 / 21770
Support: 19140 / 18015 / 16325
Long HK50 14 Jun'23Risk control mindset check
Trap evidence check
Logical buyer location
In-line with broader trend, no sign of genuine reversal, rollover of pullback and logical target

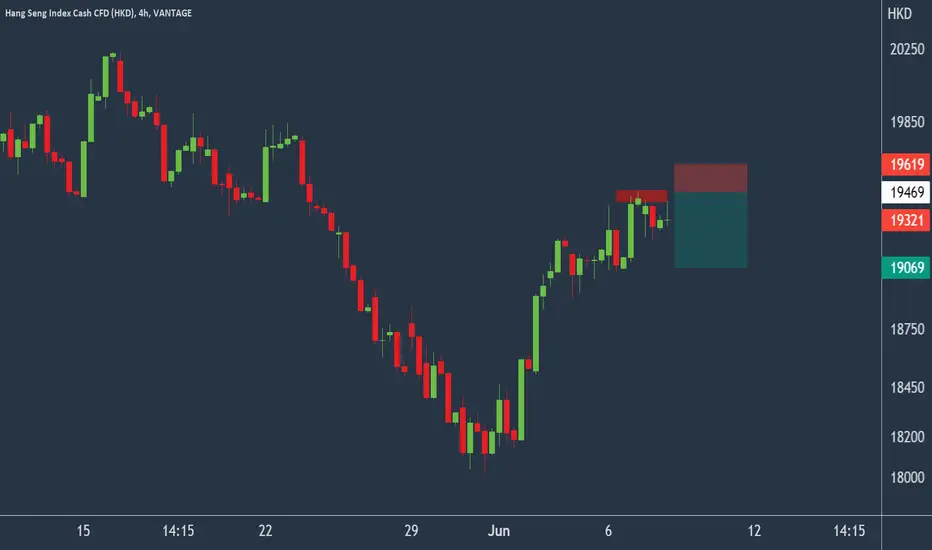
HK50 to stall at current swing high?HS50 - 24h expiry - We look to Sell at 19469 (stop at 19619)
Although the bulls are in control, the stalling positive momentum indicates a turnaround is possible.
Price action looks to be forming a top.
The 200 day moving average should provide resistance at 19458.
This is negative for short term sentiment and we look to set shorts at good risk/reward levels for a further correction lower.
Further downside is expected although we prefer to sell into rallies close to the 19485 level.
Our profit targets will be 19069 and 19009
Resistance: 19650 / 20850 / 22790
Support: 18680 / 17710 / 16320
Please be advised that the information presented on TradingView is provided to Vantage (‘Vantage Global Limited’, ‘we’) by a third-party provider (‘Signal Centre’). Please be reminded that you are solely responsible for the trading decisions on your account. There is a very high degree of risk involved in trading. Any information and/or content is intended entirely for research, educational and informational purposes only and does not constitute investment or consultation advice or investment strategy. The information is not tailored to the investment needs of any specific person and therefore does not involve a consideration of any of the investment objectives, financial situation or needs of any viewer that may receive it. Kindly also note that past performance is not a reliable indicator of future results. Actual results may differ materially from those anticipated in forward-looking or past performance statements. We assume no liability as to the accuracy or completeness of any of the information and/or content provided herein and the Company cannot be held responsible for any omission, mistake nor for any loss or damage including without limitation to any loss of profit which may arise from reliance on any information supplied by Signal Centre.
Hang Seng index has found the bottomPrevious 2-3 years China economic was very "sick", however I suppose now Hang Seng Index has found the bottom. Next year (from this moment) will be a good year for investing in China.

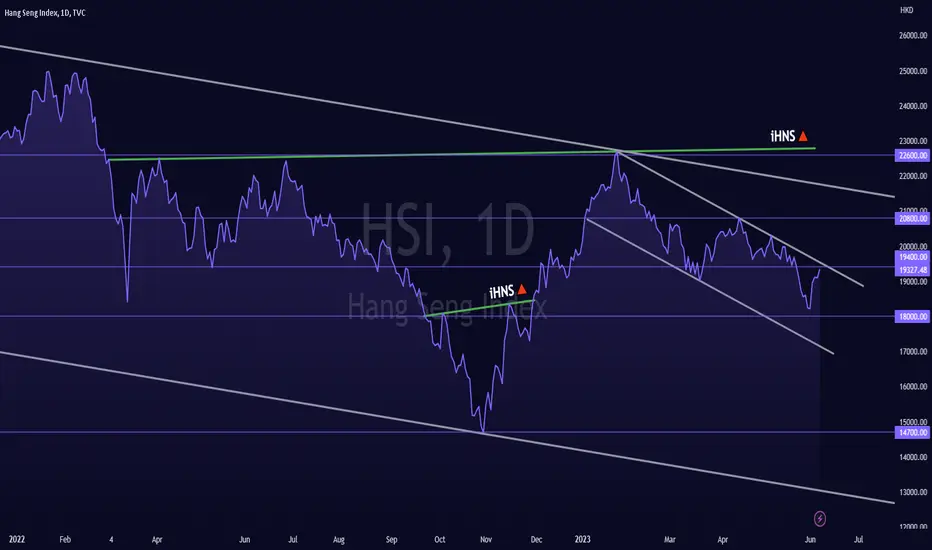
HSI - Falling Trend Channel [MID TERM]🔹HSI is in a falling trend channel in the medium long term.
🔹An inverse head and shoulders formation is under development.
🔹Break upwards through 19400 will be a positive signal.
🔹Overall assessed as technically slightly negative for the medium long term.
Chart Pattern;
🔹DT - Double Top | BEARISH | 🔴
🔹DB - Double Bottom | BULLISH | 🟢
🔹HNS - Head & Shoulder | BEARISH | 🔴
🔹REC - Rectangle | 🔵
🔹iHNS - inverse head & Shoulder | BULLISH | 🟢
Verify it first and believe later.
WavePoint ❤️
HK50, H2 viewHK50, H2 view, lets see if the BEARISH continuation plays out,
FYI, trend touch on the H4 TF, but observe price action, lets see if 3rd touch / best touch in this case are valid.
observation : RSI shows no signs of weakness

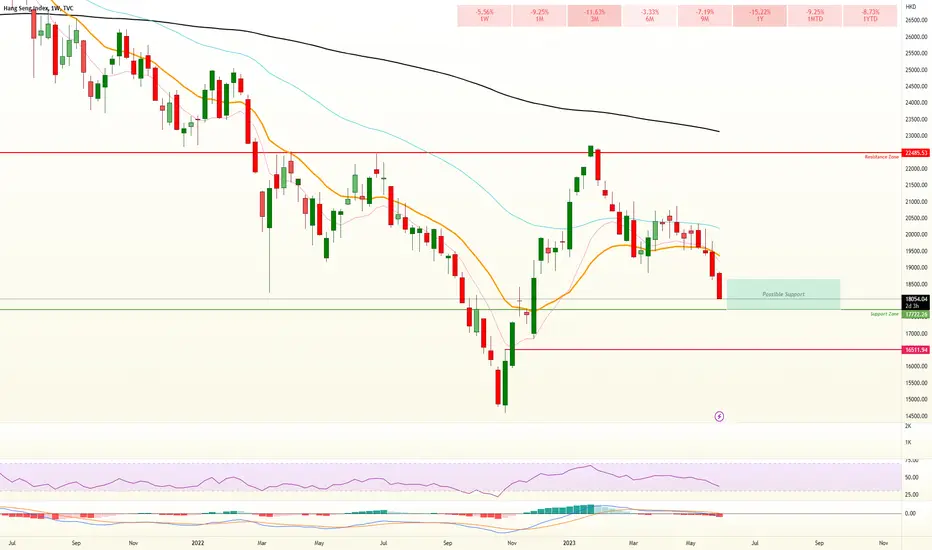
Hong Kong Index HSI is into an area of possible support 17600-118600 , minor support at 18000
Failure here will see the next level 165000 tested else we get a bounce to test the 20ema
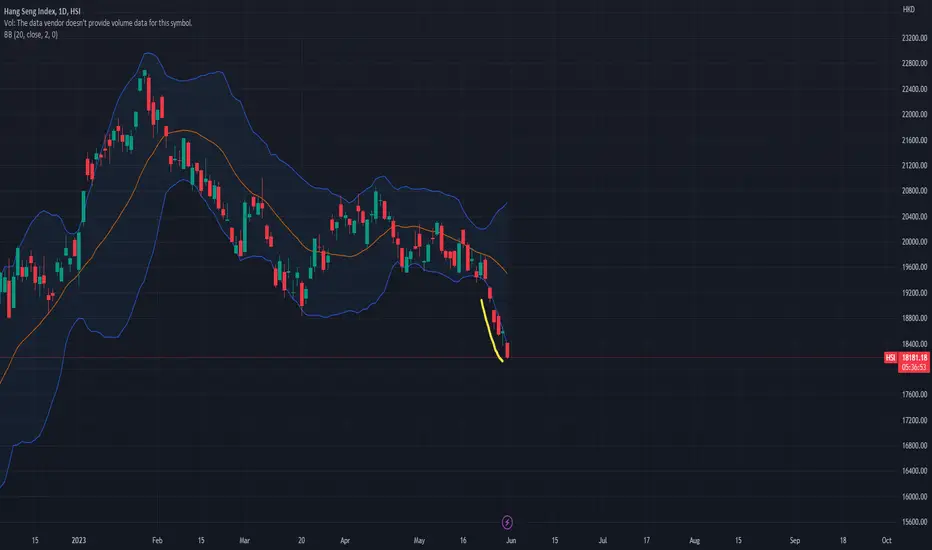
Why we don't use indicators?Many traders apply indicators for their analysis in their next trade.
However, indicators formulate with historical price movement to tell us what is happening right now. It is not so much of telling us what is going to happen.
The reason is simple, it is like economic policies, can manipulate the economy figure. But it doesn't tell us exactly the expectation of the market, such as big players or hot money flow.
If you are using bollinger band on HSI the past 1 week, you would have made huge losses. Because the indicators is just using the average of previous price to plot the possible oversold point.
HSI has been in the oversold 5 days including the moment we are posting here.
Therefore, it is less efficient in telling us what is happening right now. Which is very important for trader to know what is the current big players sentiment. Rather just based on what happened before that could affect the present.
What we eat few days back doesn't mean the output will be the same as what we had few days back. (unless is constipation)
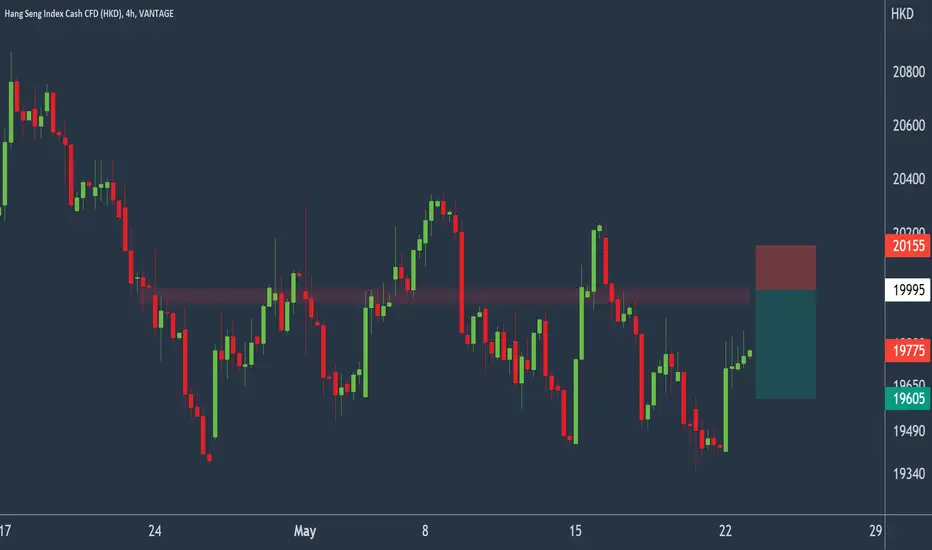
HKEX to find resistance at psychological level?HS50 - 24h expiry - We look to Sell at 19995 (stop at 20155)
Although the bulls are in control, the stalling positive momentum indicates a turnaround is possible.
The Ichimoku cloud and 200-day moving average provide further resistance and we look to set shorts in early trade to capture this selling opportunity.
The weekly pivot is at 20000.
The hourly chart technicals suggests further upside before the downtrend returns.
We therefore, prefer to fade into the rally with a tight stop in anticipation of a move back lower.
Our profit targets will be 19605 and 19525
Resistance: 20850 / 22790 / 24770
Support: 18680 / 17710 / 16330
Please be advised that the information presented on TradingView is provided to Vantage (‘Vantage Global Limited’, ‘we’) by a third-party provider (‘Signal Centre’). Please be reminded that you are solely responsible for the trading decisions on your account. There is a very high degree of risk involved in trading. Any information and/or content is intended entirely for research, educational and informational purposes only and does not constitute investment or consultation advice or investment strategy. The information is not tailored to the investment needs of any specific person and therefore does not involve a consideration of any of the investment objectives, financial situation or needs of any viewer that may receive it. Kindly also note that past performance is not a reliable indicator of future results. Actual results may differ materially from those anticipated in forward-looking or past performance statements. We assume no liability as to the accuracy or completeness of any of the information and/or content provided herein and the Company cannot be held responsible for any omission, mistake nor for any loss or damage including without limitation to any loss of profit which may arise from reliance on any information supplied by Signal Centre.
HK / HSI ?
I like this area.
previous strong spike.
I hope chart have got a fond memory here :)
Spike/rebound.
All the best

HSI - Falling Trend Channel [MID TERM]- HSI is in a falling trend channel in the medium long term.
- This shows that investors over time have sold at lower prices to get out of the index, and indicates negative development for the market.
- An inverse head and shoulders formation is under development.
- A decisive break of the resistance at 20786, ideally with an increase in volume, signals a further rise.
- HSI is between support at points 19400 and resistance at points 20800.
- Overall assessed as technically slightly negative for the medium long term
*EP: Enter Price, SL: Support, TP: Take Profit, CL: Cut Loss, TF: Time Frame, RST: Resistance, RTS: Resistance to be Support LT TP: Long Term Target Price
*Chart Pattern:
DT - Double Top | BEARISH | RED
DB - Double Bottom | BULLISH | GREEN
HNS - Head & Shoulder | BEARISH | RED
REC - Rectangle | BLUE
iHNS - inverse head & Shoulder | BULLISH | GREEN
Verify it first and believe later.
WavePoint ❤️

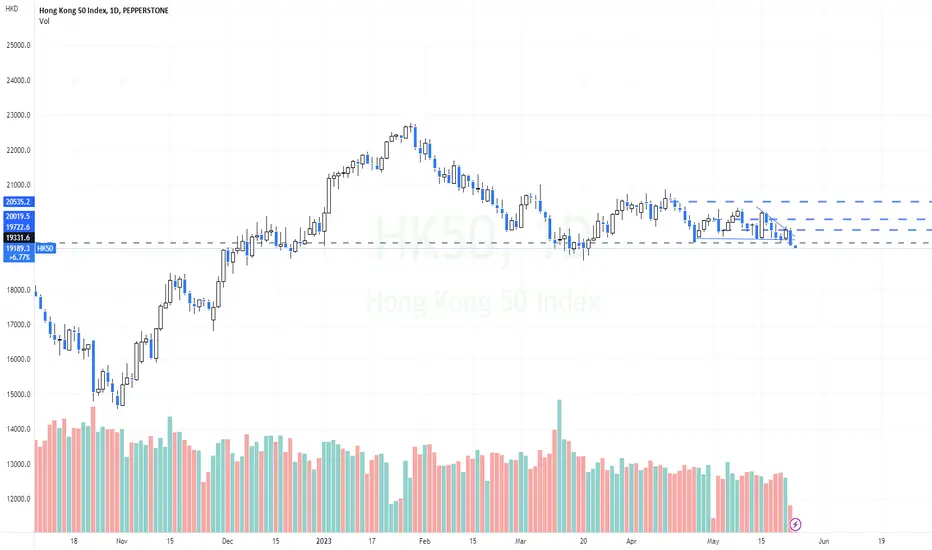
HangSeng - Observation 👲Watching this area on the HSI to see where we close....
A break here could open the gates to further downward pressure in the coming sessions.

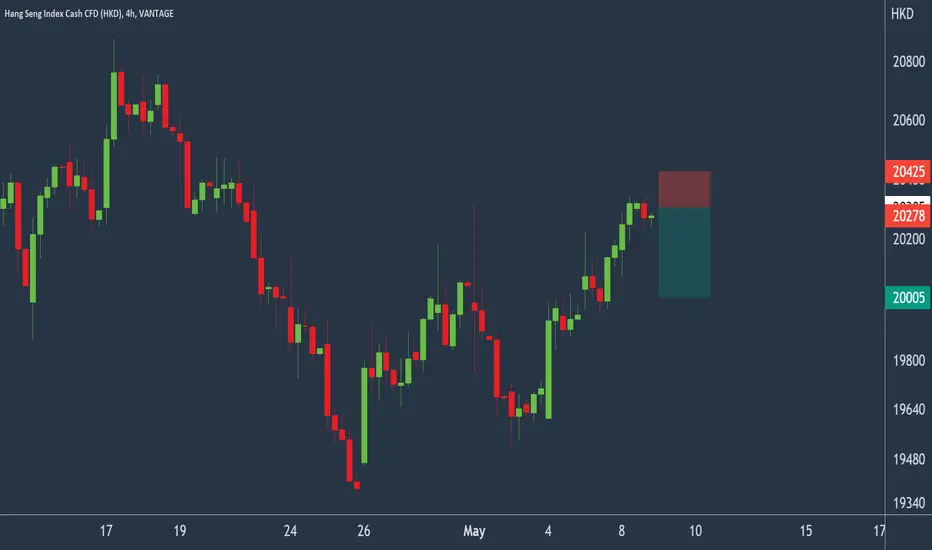
HKEX to stall at current high?HS50 - 24h expiry - We look to Sell at 20305 (stop at 20425)
We are trading at overbought extremes.
A Doji style candle has been posted from the high.
This is negative for short term sentiment and we look to set shorts at good risk/reward levels for a further correction lower.
Further downside is expected although we prefer to sell into rallies close to the 20305 level.
Although the anticipated move lower is corrective, it does offer ample risk/reward today.
Our profit targets will be 20005 and 19650
Resistance: 20850 / 22790 / 24770
Support: 19650 / 18680 / 17710
Please be advised that the information presented on TradingView is provided to Vantage (‘Vantage Global Limited’, ‘we’) by a third-party provider (‘Signal Centre’). Please be reminded that you are solely responsible for the trading decisions on your account. There is a very high degree of risk involved in trading. Any information and/or content is intended entirely for research, educational and informational purposes only and does not constitute investment or consultation advice or investment strategy. The information is not tailored to the investment needs of any specific person and therefore does not involve a consideration of any of the investment objectives, financial situation or needs of any viewer that may receive it. Kindly also note that past performance is not a reliable indicator of future results. Actual results may differ materially from those anticipated in forward-looking or past performance statements. We assume no liability as to the accuracy or completeness of any of the information and/or content provided herein and the Company cannot be held responsible for any omission, mistake nor for any loss or damage including without limitation to any loss of profit which may arise from reliance on any information supplied by Signal Centre.