shorterm retrace play for the next 10 daysbtc might touch 55k in the next 10 days specially when fomc meeting coming negatively toward lowering the interest rate " they won't"
this will impact the market negatively short term for May2024.
but by September we can see a recovery to new ATH for most coins
CKBUSDT.P trade ideas
CKB/USDT in the support area, possible to bounce and back upward💎 Paradisers, the recent market dynamics surrounding #CKB have indeed been noteworthy.
💎 Currently, CKB is hovering around the support zone area, and based on the candlestick patterns, there's potential for a bounce.
💎 If this bounce materializes, CKB could retest the resistance around the 0.0255 area. A successful breakout above this level could propel CKB towards our target strong resistance area.
💎 However, if CKB fails to bounce and breaks down below the support area, it could signal a bearish trend reversal, potentially leading the price to move downward towards the Bullish OB area.
💎 In the Bullish OB area, CKB must bounce back and reclaim the price above the support to maintain its upward momentum towards our target. Failure to do so, with a breakdown below the OB area, could lead to further downward movement.
MyCryptoParadise
iFeel the success🌴

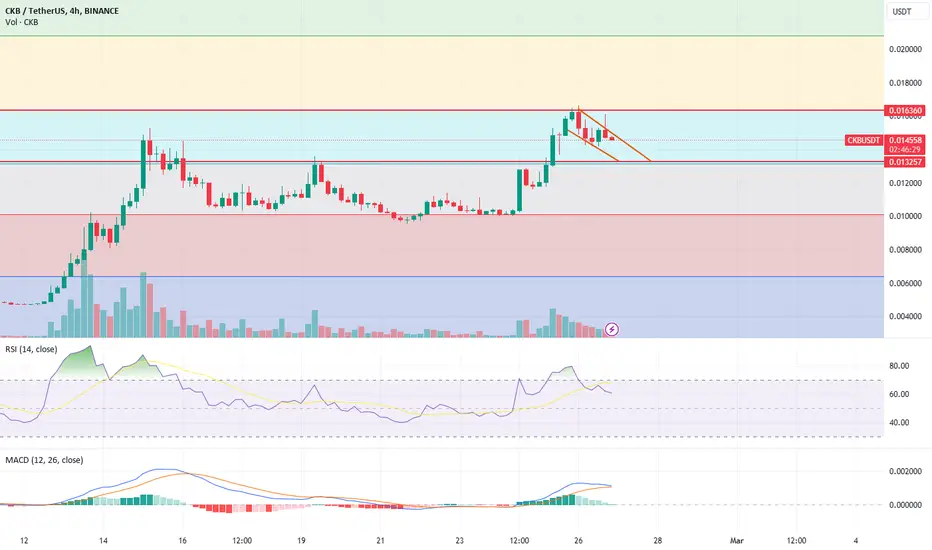
$CKB performing Falling wedge in 4hr TF Keep eyes on it Sure, here are three key points on how to trade in a falling wedge pattern:
1. **Identify the Falling Wedge:** Look for a downward sloping trendline connecting the lower highs and a second trendline connecting the lower lows, creating a wedge shape. The price should be gradually narrowing within this pattern, indicating a potential reversal.
2. **Wait for Confirmation:*
* Wait for confirmation of a bullish reversal. This can be signaled by a breakout above the upper trendline of the falling wedge pattern, accompanied by increased volume. This breakout validates the pattern and suggests that buying pressure may be overcoming selling pressure.
3. **Set Stop Loss and Target:** Set a stop-loss order below the lower trendline to limit potential losses in case the trade fails. Determine a target price based on the height of the wedge pattern, measured from the initial high to the low within the wedge, and project that distance upward from the breakout point. This provides a potential profit target.
Remember to always manage risk and be cautious of false breakouts by waiting for confirmation signals before entering a trade.

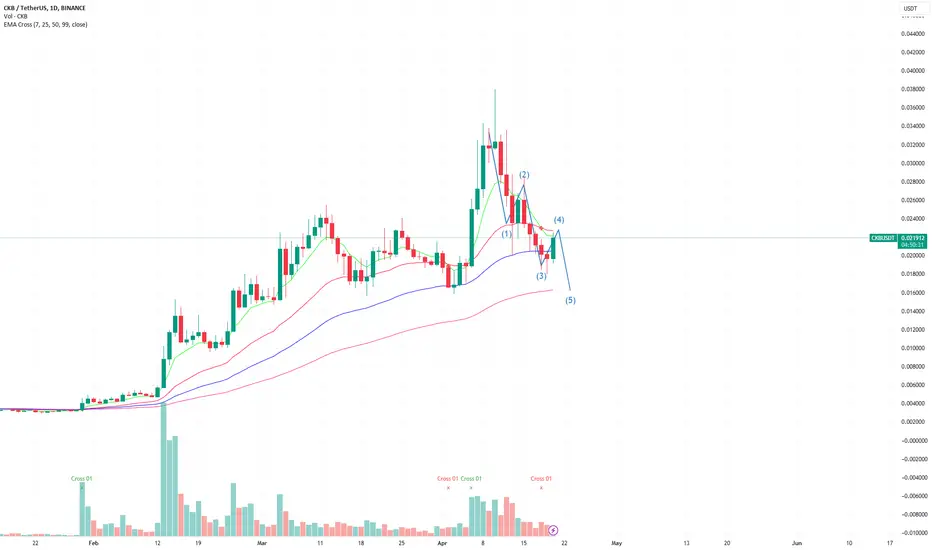
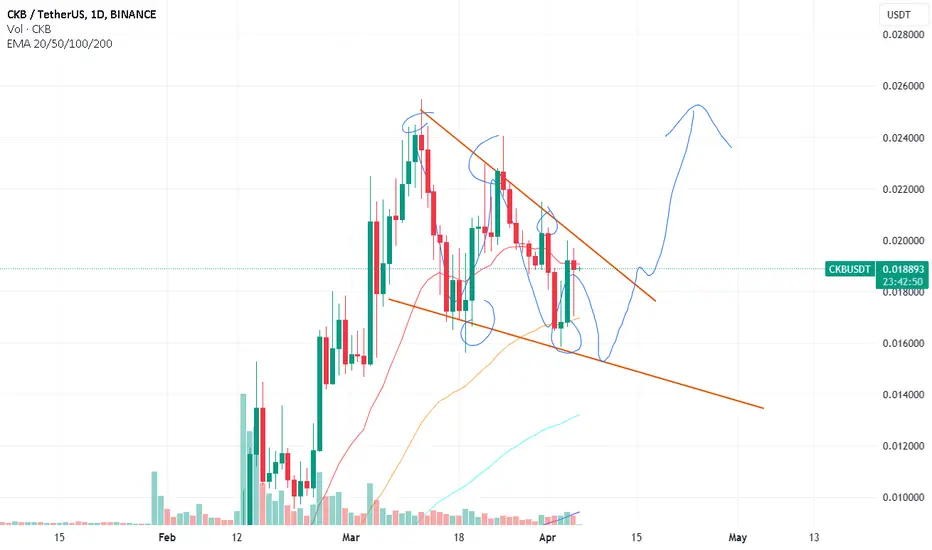
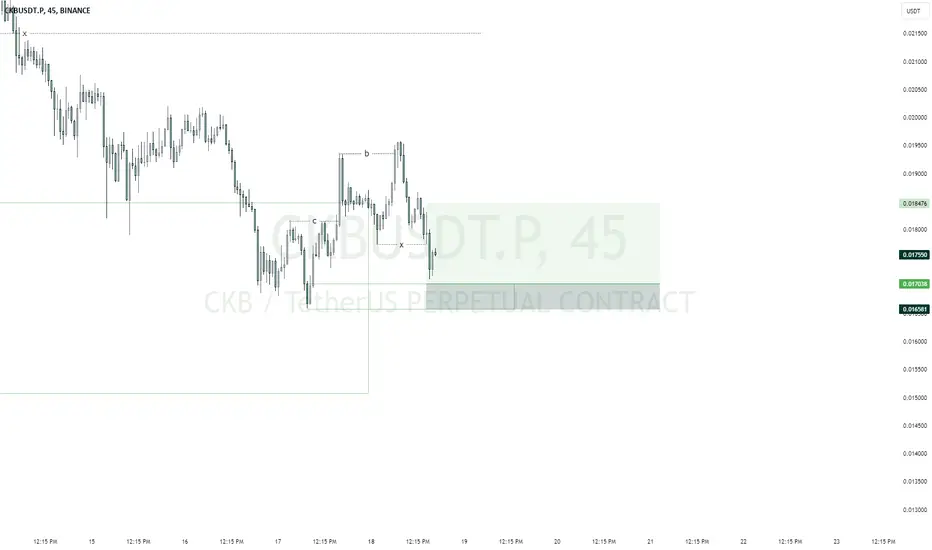
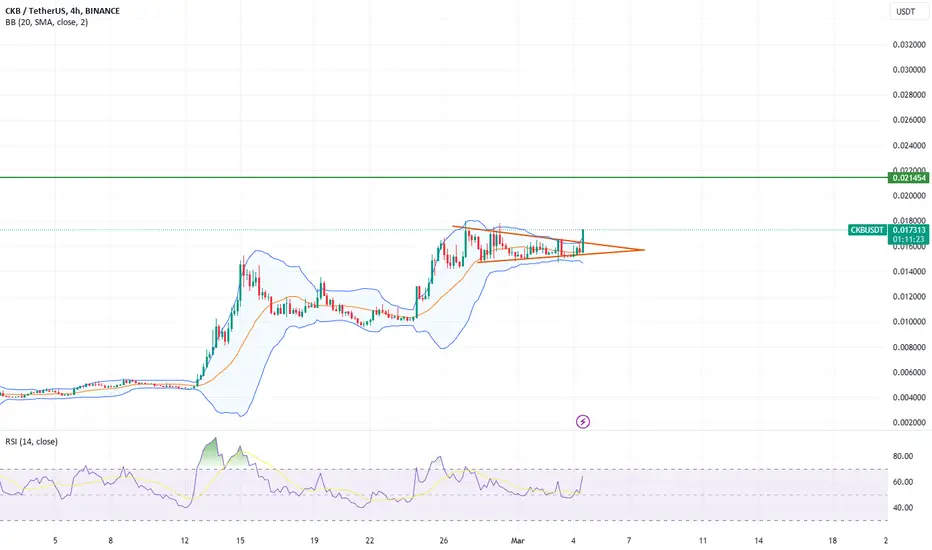
short term target for ckb ckb broke down the symmetrical triangle today as well as btc.
first support areas is b58k for btc
and 0.0180 for ckb to create: A B C retracement waves in the daily
it could even dump to 0.0159 in case btc dropped to 53-54k
am expecting all these action in 5-10 days.
not a financial advisor, trade with cautious.

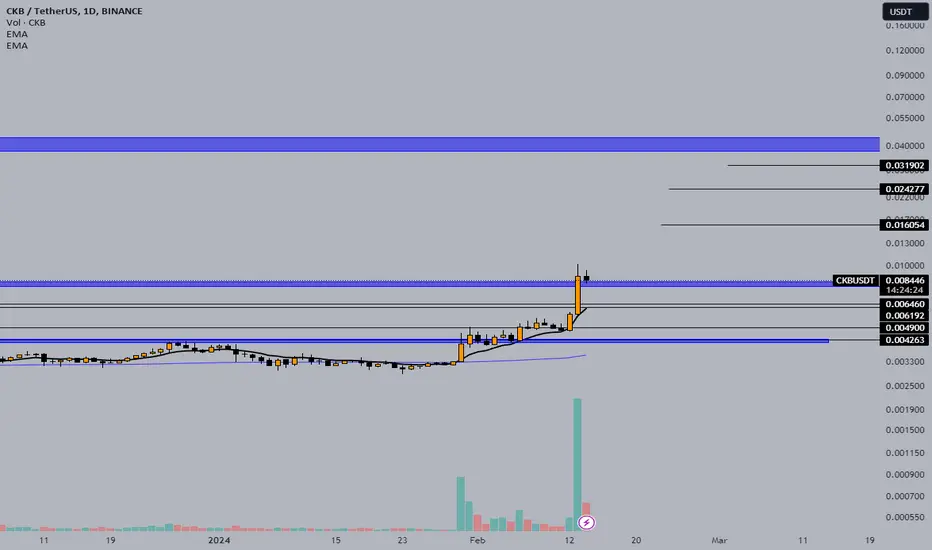
CKB - Skate it up!CKB - breaks the barrier 0.008$ with big volumes! We are expecting a trading range where the price can breath around those levels.
Possible potential targets are 0.016 and if a good trend is established along the way it could lead up 0.4$ as a last target where we see a huge price barrier.
Good trading!
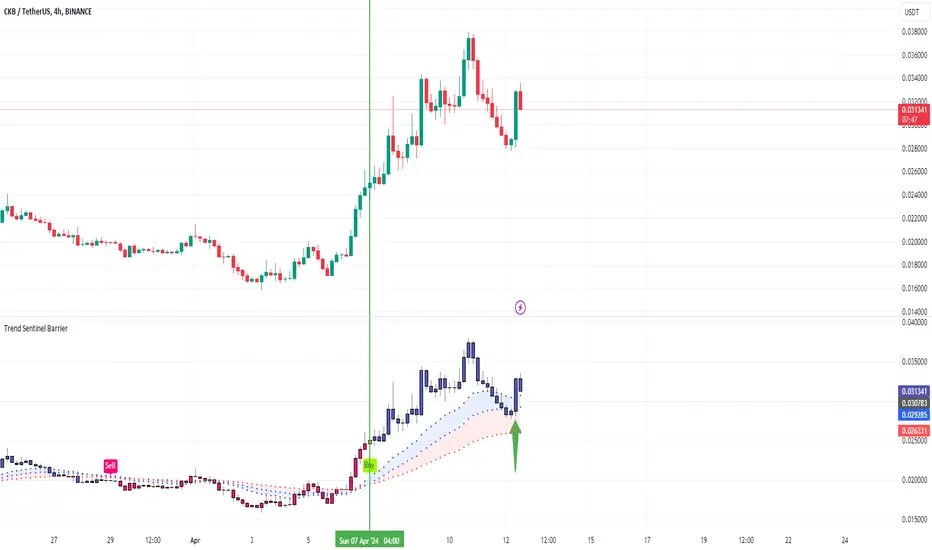
Bullish trend--CKBLike the previous few days, BTC continued to fluctuate around ATH, and most tokens experienced a correction. CKB (Nervos Network) is one of the few tokens that maintains a bullish trend.
Unlike some blockchain that focus on single-layer development, CKB is a layered blockchain. One layer is where state is stored and defined, while the second layer handles most transactions. Such two layered design can improve efficiency and security. However, with the launch of more and more modular blockchains such as Celestia and Altlayer, the advantages of the two-layer design will gradually shrink. Developers and project parties will achieve their goals by using modular blockchain.
However, judging from the price trend, CKB has performed strongly recently, and its continued rise is close to returning to ATH. Let’s take a look at what’s going on with our indicators. First, let’s take a look at the 4h level. After a period of correction, the TSB indicator prompted a BUY signal on April 6, and CKB restarted its rise. After reaching 0.038, like other tokens in themarket, it began to callback. When the column touched the bottom of the blue wavy area, which acted as support, the bulls saw a clear enhancement (shown by the green arrow). The TSB indicator takes effect and CKB starts to rise again.
In addition, at the daily level, on February 5, the TSB indicator prompted a BUY signal. It has gained 600% so far and continues to maintain a healthy bullish trend.
Introduction to indicators:
Trend Sentinel Barrier (TSB) is a trend indicator, using AI algorithm to calculate the cumulative trading volume of bulls and bears, identify trend direction and opportunities, and calculate short-term average cost in combination with changes of turnover ratio in multi-period trends, so as to grasp the profit from the trend more effectively without being cheated.
KDMM (KD Momentum Matrix) is not only a momentum indicator, but also a short-term indicator. It divides the movement of the candle into long and short term trends, as well as bullish and bearish momentum. It identifies the points where the bullish and bearish momentum increases and weakens, and effectively capture profits.
Disclaimer: Nothing in the script constitutes investment advice. The script objectively expounded the market situation and should not be construed as an offer to sell or an invitation to buy any cryptocurrencies.
Any decisions made based on the information contained in the script are your sole responsibility. Any investments made or to be made shall be with your independent analyses based on your financial situation and objectives.
CKB - Weekly candle analysisBINANCE:CKBUSDT (1W CHART) Technical Analysis Update
CKB is currently trading at $0.02056 and showing overall bullish sentiment. Price has currently broke out from the resistance line and successfully retraced back to its support line.
After the retracement we are seeing price bounce back and heading towards the next resistance line. We have good long trade opportunity is here.
Entry level: $ 0.02058
Stop Loss Level: $ 0.013148
TakeProfit 1: $ 0.03565
TakeProfit 2: $ 0.04492
TakeProfit 3: $ 0.0966
Max Leverage: 3x or Spot
Don't forget to keep stop loss.
Follow us for More Technical Analysis Updates, | Like, Share and Comment Your thoughts.
Cheers
GreenCrypto

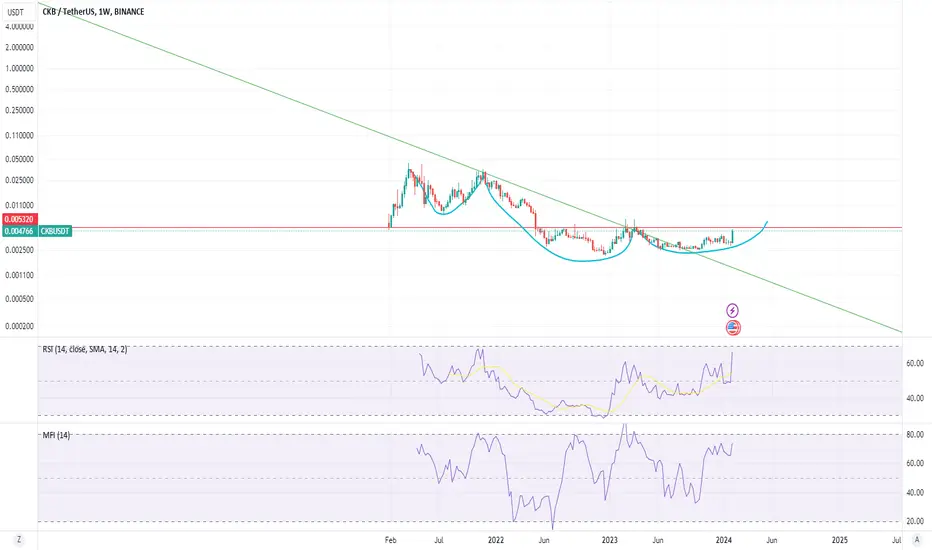
Inverted H/S on the Weekly Log ChartMaybe crazy but I see a slanted inverted H/S on the weekly chart. Not typical to the images seen for what an inverted H/S should be but it's there imo. If it plays out, CKB could make a run for 0.05.
CKBUSDTmy entry on this trade idea is taken from a point of interest ABOVE an inducement.. I extended my stoploss area to cover for the whole swing as price can target the liquidity there before going as i anticipate.. just a trade idea, not financial advise

CKB NEW VOLUME INCREASEThank you for reading this update.
Depending on our study we see that CKB has a good chance of volume increase.
This updates depending on day trade, And the market should confirm with time the right market way.
#Nottradingadvice
#For Day traders take always profits when the market increase
#Expect nothing from the markets, but follow what it shows.
if ever btc dumped to 62k?possible retracement to 0.15 again
not a financial advisor, for educational purposes
CKBUSDTmy entry on this trade idea is taken from a point of interest below an inducement.. I extended my stoploss area to cover for the whole swing as price can target the liquidity there before going as i anticipate.. just a trade idea, not financial advise
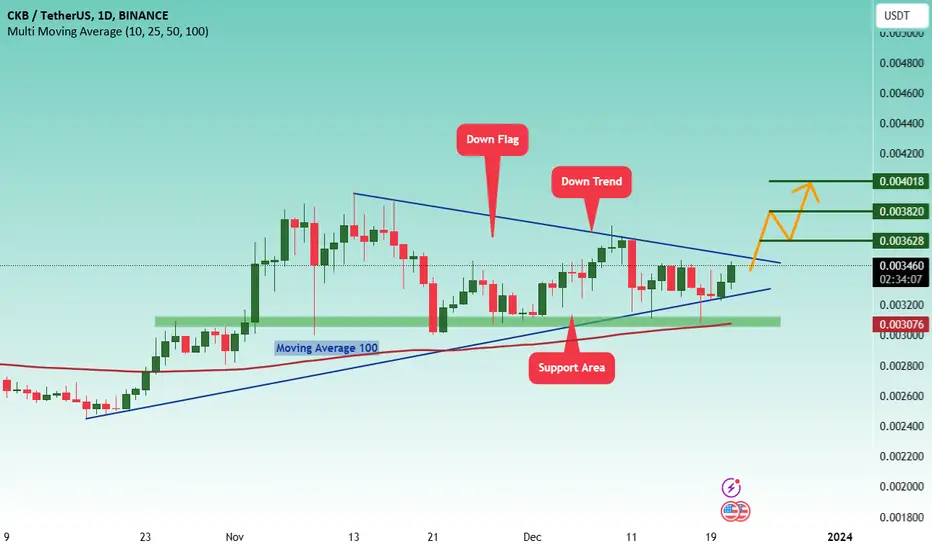
#CKB/USDT#CKB
The price is moving in a triangle from the beginning of November 2023
We are about to break the triangle strongly
We are top Moving Average 100
The price now is 0.003464
The first target is 0.003457
The second goal is 0.003820
The third goal is 0.004000
LONG #CKBUSDTLONG #CKBUSDT from $0.0188
1h TF. The instrument is in the growth leaders today, I will consider a local long for the withdrawal of the nearest remaining liquidity, at the current we observe an increase in trading volumes, the price is impulsively pressed under the hourly slope with several touches, the breakdown of which I expect to see, with the update of the nearest hourly high, I will consider entering the breakdown of the slope with the potential to move to the seller's zone of interest at around $ 0.021500

more upside to comeckb saw a 100% gain on one day from 0.0056 to 0.01.
a potential to see then to see 0.013 this month . booked some profits at 0.011

pull back this week?we sold at 0.0151
buying back at 0.0134
not a financial advisor
trade with cautious
ckb retesting 0.0125 before the 0.021 target the overall market is overbought and many alts pumped 200-500% in the last 6 weeks,
a healthy pull back on March will be healthy.
not a financial advisor

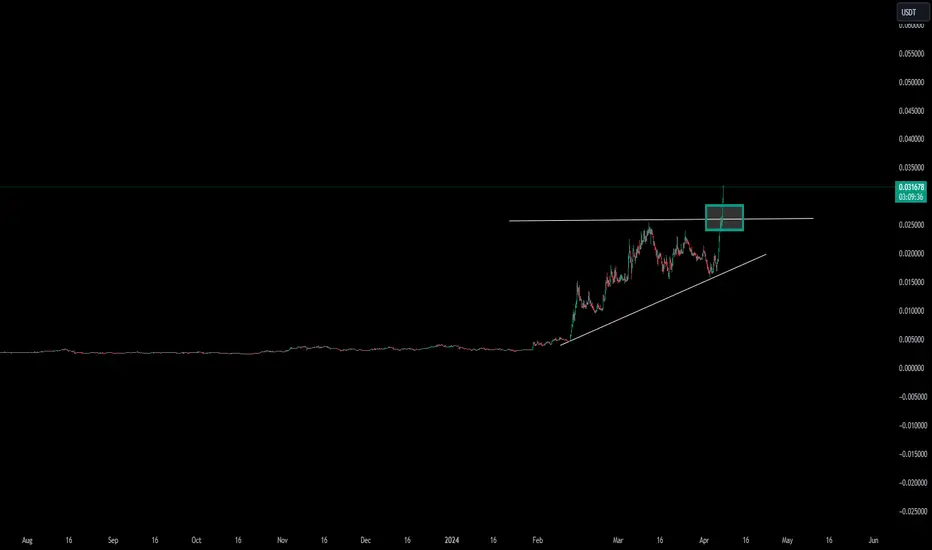
swing trade CKB ckb coin works perfectly for my 2024play and coin of the year
its a hidden gen and it can reach 0.1 soon and on sep 2024
for now it shows a breakout" not confirmed yet " keep an eye.
and the next target is 0.021
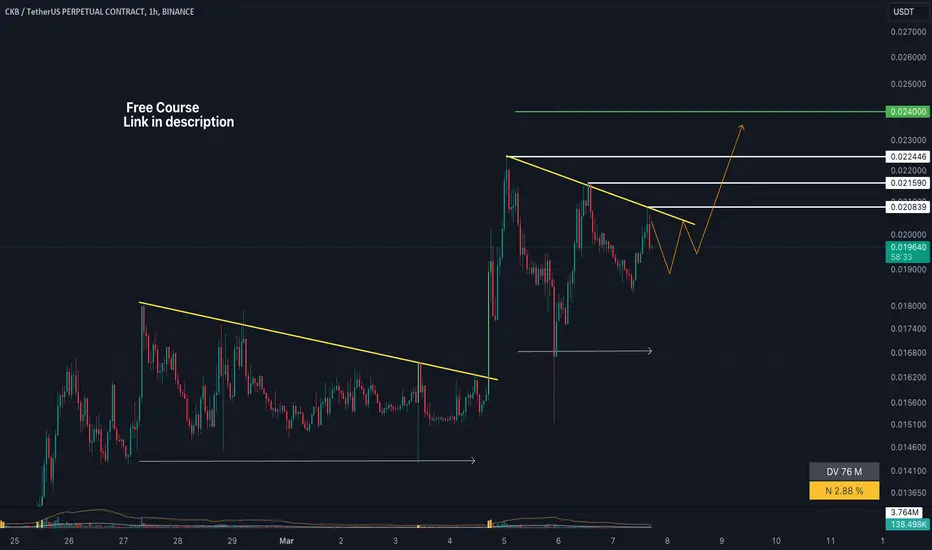
#CKBUSDT continued growth!LONG #CKBUSDT from $0.0209
1h TF. This instrument shows globally very strong growth, the upward movement structure continues, the price was able to gain a foothold above the previous sidewall, there are still very high trading volumes as well as high activity from the buyer, the previously left imbalance was blocked from below and a new sidewall was formed with a cascade of levels from above, the breakdown of which I will consider, I expect to see an impulse breakdown in the long at the next price compression to an inclined one, and the further growth of the coin to the level of $ 0.024
✴️ Nervos Network 500% Potential Mapped (Name Your Altcoin)While this isn't the best chart around, Nervos Network (CKBUSDT) is still trading within a higher low compared to December 2022 and recently displayed above-average purchase volume, very recently, which can signal that a reversal is soon to take place.
This bullish potential remains valid as long as CKBUSDT trades above 0.002000, which is Decembers low. If it moves below this level then a longer correction can develop. Other than that, a nice bullish wave can show up...
Based on the current chart and maker wide action the next target can lead to around 500% growth. Based on a higher high hitting after a long-term higher low.
Namaste.

Ckb/BTC bouncing off long term resistance/support?Since Jan 2021 ckb is equivalent to BTC. Will it outperform BTC through 2024 halving. Ckb halved last year for 1st time.

CKBUSDT.PCKBUSDT.p is in bearish trend.
Bearish divergence also form.
Printing LH and LL.
Sellers are strongly active.
We wait and watch for the breakout of last LL>

CKB /USDT H&S CKB formed head and shoulder pattern waiting to break down neckline targeting 0.01166$
