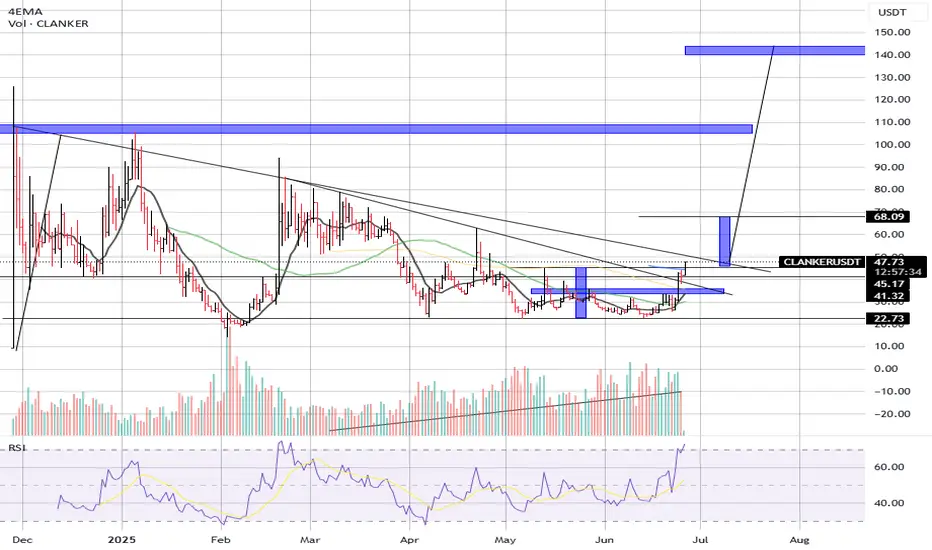
CLANKER/USDT – Major Breakout from Descending Triangle Points to
Date: June 26, 2025
CLANKER/USDT has just broken out of a long-term descending triangle pattern, a move that signals a shift in market sentiment from bearish to bullish. This breakout is accompanied by increasing volume and rising momentum, indicating strong buyer interest.
📊 Technical Overview:
Current Price: $46.44
Breakout Level: ~$45.00
Key Support Levels:
$41.32 (local support and former resistance)
$22.73 (macro support zone)
📈 Resistance/Target Zones:
Short-Term Target: $68.09 (first measured move)
Mid-Term Resistance: ~$105–110 zone (historical supply)
Long-Term Target: $145.00 (measured projection from pattern breakout)
📈 Indicators:
RSI: 72.09 – bullish momentum confirmed, entering overbought zone (but healthy in breakouts)
Moving Averages (EMAs): All EMAs are beginning to turn upwards and align bullishly, with price now clearly above them.
📉 Volume:
Volume has shown a steady uptick since early June, confirming the breakout is supported by accumulation and strong demand.
🔍 Chart Structure:
Price was previously stuck in a descending triangle with a base around the $22–45 range.
Breakout has occurred above both horizontal resistance and the descending trendline.
Bull flag or ascending triangle structure formed just before breakout, confirming the build-up phase.
🎯 Upside Projections:
First Target: $68.09
Second Target: ~$105–110 (historical supply zone)
Final Target: ~$145.00 based on the measured move from the height of the descending triangle.
📉 Invalidation:
A move back below $41.32 would weaken the bullish case.
A breakdown below $22.73 would invalidate the entire bullish thesis and suggest renewed selling pressure.