NQ Short (06-24-25)Going with the recent pop as: Short Cover rally or Drop Offset. We may see a decent head fake long set up as some may start to exit (up here). Give it the week with the Friday-Monday Long move to change to Short Rip lower.
NDAQ100U2025 trade ideas
NQ Range (06-20-25)NAZ U Turn #45 or Bust, we have the Friday-Monday Long Rig test on deck. The F-M trade has been working for about a year and half, the break down here may be a big dipper. Watch the Tweet stall out and Reg Session selling, otherwise to the Moon with F-M lift.
NQ2025 – Clean Liquidity Sweep & OB Rejection Leads to Trend ConDescription (for the Idea post):
NASDAQ Futures (NQ2025) - June 19th Setup Breakdown
Market showed textbook Smart Money behavior today.
🔹 Key Highlights:
Price swept the Saturday Low and Wednesday Low, triggering sell-side liquidity.
Reaction from an old Order Block + Fair Value Gap (FVG) zone near 21,780.
Market Structure Break confirmed the bearish bias.
Retest of OB/FVG zone provided a clean low-risk entry.
Targets were cleanly delivered into 21,678 and beyond.
🔹 Confluences:
✅ Liquidity Sweep
✅ OB + FVG Rejection
✅ Volume Spike & BOS
✅ Trend aligned with overall bearish bias
📌 Plan Going Forward:
I’m watching for retracements to prior support-turned-resistance (21,740–21,780) for potential continuation plays. Will stay bearish unless a CHoCH above 21,800 with volume and bullish structure forms.
Comment below with how you traded this setup or how you're managing it!

4 Powerful, Daily Affirmations for Faith-Based TradersAffirmations make a huge difference.
But why?
It's because they shape our beliefs.
Whatever we think, affects what we say.
Whatever we say, affects what we do.
Whatever we do, is who we become and what our life actual looks like.
Repeat these affirmations daily and watch your life change before your eyes.
Wealth flows to me with ease as I walk in purpose.
I reject scarcity and embrace Kingdom abundance.
I am open to divine provision in expected and unexpected ways.
I have more than enough to thrive and to give.
Happy trading!
For those of you who are trading to make a bigger impact in the world, I am praying for you!
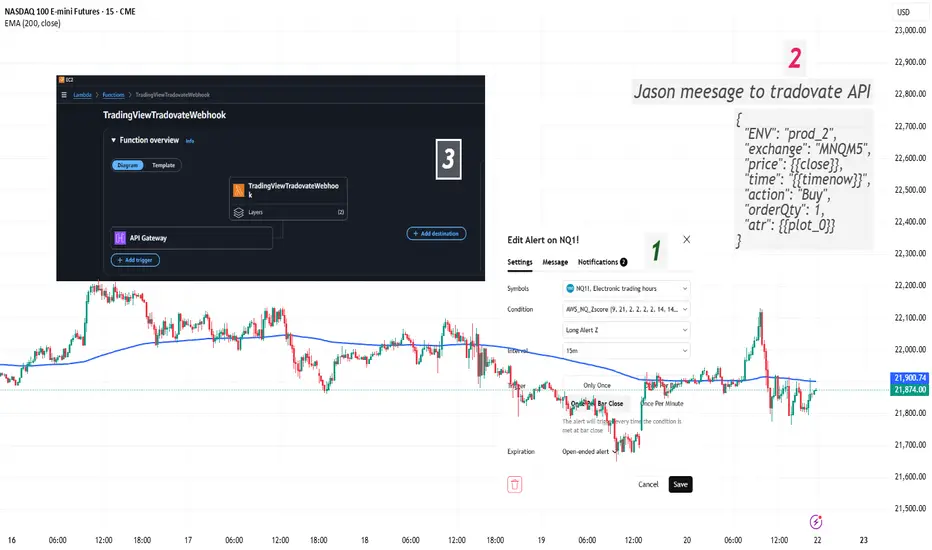
Automated Execution: TradingView Alerts → Tradovate using AWS LaI’ve built a fully automated pipeline that takes live TradingView alerts and turns them into real orders in Tradovate. Here’s how it works, step by step (I will provide a video on it):
PineScript Alerts
My indicator/strategy in TradingView fires alert() with a JSON payload (symbol, side, qty, price, ATR, ENV).
Webhook to AWS
Alerts hit an API Gateway endpoint in AWS, invoking a Lambda function.
Lambda Processing
Parse the JSON from TradingView.
Calculate Stop‐Loss & Take‐Profit using ATR.
Authenticate to the Tradovate API (demo & live environments).
Place an OCO order (placeOSO) with proper bracket legs.
Send a confirmation message to my Telegram channel.
Tradovate REST API
Auth: POST /auth/accesstokenrequest → accessToken
List accounts: GET /account/list → find accountId
Place OCO: POST /order/placeOSO with entry, SL, TP
Testing & Monitoring
Local smoke tests of Telegram bot.
Lambda console test events for sample payloads.
CloudWatch logs for debugging & alerts on errors.
Why it matters:
Zero manual steps from signal to fill.
Consistent risk management via ATR‐based SL/TP.
Clear audit trail: logs in AWS + Telegram notifications.
Educational resource for anyone building similar setups
Feel free to ask questions or suggest improvements! Please leave comments.
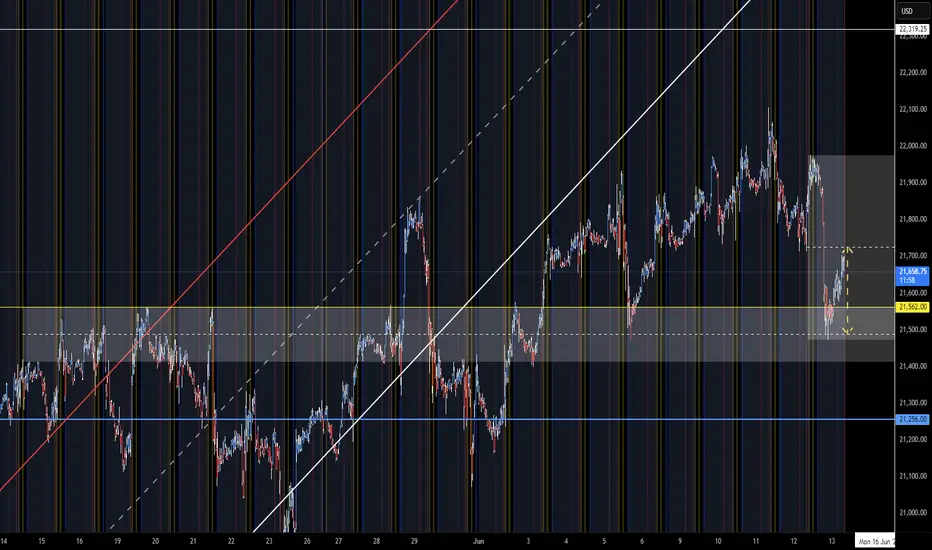
NQ Range (06-13-25)Update to prior Post and Short Call at 22,040. NAZ did drop 700 points of the 1,000 expected. Balance of drop to watch for in Reg Session or the typical F-M Long Play is on deck.
ES/NQ Weekly LevelsES Weekly Levels:
Range: 5,937.01 - 6,109.29
Skew: +.86% 6,062.42
NQ Weekly Levels:
Range: 21,480.38 - 22,247.67
Skew: +1.06% 22,043.39

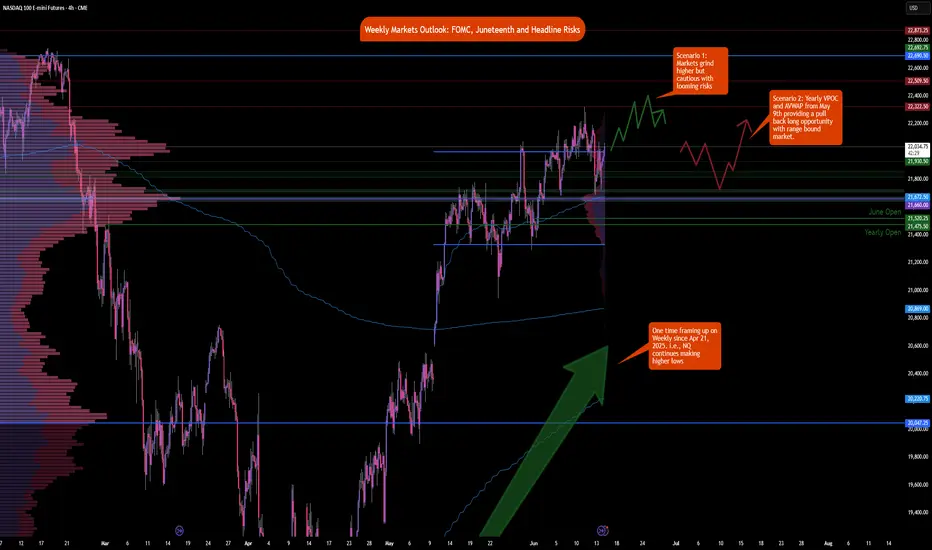
Weekly Market Outlook: FOMC, Trade Deals and GeopoliticsIt is a holiday-shortened week, with the majority of markets halting early on Thursday, June 19, 2025, in observance of Juneteenth. See here for holiday trading schedule
Key Themes to Monitor This Week
Geopolitical Risks
Any outside intervention in the ongoing Israel-Iran conflict will likely be seen as a risk-off event by market participants. Despite Friday’s sell-off, markets shrugged off during the Sunday open and overnight sessions.
There are potential risks to trade routes and energy infrastructure, although disruptions seem unlikely at the moment. Amena Bakr at Kpler noted that, so far, there are no signs of disruptions in oil loadings from Iran. Without a supply outage, there is no pressing need for additional barrels to be brought onto the market.
Trade War and Trade Deals
There have been recent developments with the U.S. reaching key trade deal milestones with several countries. The baseline scenario remains optimistic, with expectations for an extension in negotiations and potential reciprocal tariffs for countries failing to reach agreements.
FED Week
This is a key week for U.S. monetary policy, with the FOMC decision, Summary of Economic Projections (SEP), and Chair Powell’s press conference scheduled.
Traders will be closely watching how the Fed’s inflation and growth expectations have evolved, as reflected in the SEP. All eyes will be on the dot plot to note how interest rate expectations have evolved since last quarter. Of note: Will President Trump’s continued calls for rate cuts influence Chair Powell’s tone or guidance?
Expectations for the Week Ahead
NQ futures have continued one-time framing higher, consistently creating higher lows since the week of April 21, 2025. A strong support zone exists below, anchored at the yearly Volume Point of Control (VPOC) and the Anchored VWAP from May 11, 2025, when markets gapped higher.
Key Levels to Watch
• yVAH: 22,690.50
• R2: 22,510
• R1 / Previous Week High: 22,322.50
• May 11 AVWAP: 21,672.25
• yVPOC: 21,660
Scenario 1: Market Grinds Higher but Stays Cautious
Despite several looming risk factors, the market could continue to grind higher. In this scenario, we anticipate a test above the prior week's high, followed by a potential pullback into last week’s range.
Example Trade Idea 1
• Entry: 22,000
• Stop: 21,930
• Target: 22,322
• Risk: 70 pts
• Reward: 322 pts
• Risk-Reward Ratio: 4.6R
Scenario 2: Pullback to Support, Range-Bound Consolidation
If the market pulls back, we expect the yearly VPOC and AVWAP from May 11 to act as key support levels. In this case, price action may remain range-bound within the previous week’s range, forming an inside week.
Example Trade Idea 2
• Entry: 21,672
• Stop: 21,600
• Target: 22,000
• Risk: 72 pts
• Reward: 328 pts
• Risk-Reward Ratio: 4.6R
________________________________________
Glossary
• VPOC: Volume Point of Control
• VA: Value Area
• VAL: Value Area Low
• VAH: Value Area High
• VP: Volume Profile
• AVP: Anchored Volume Profile
• Y: Yearly
• pWk: Previous Week
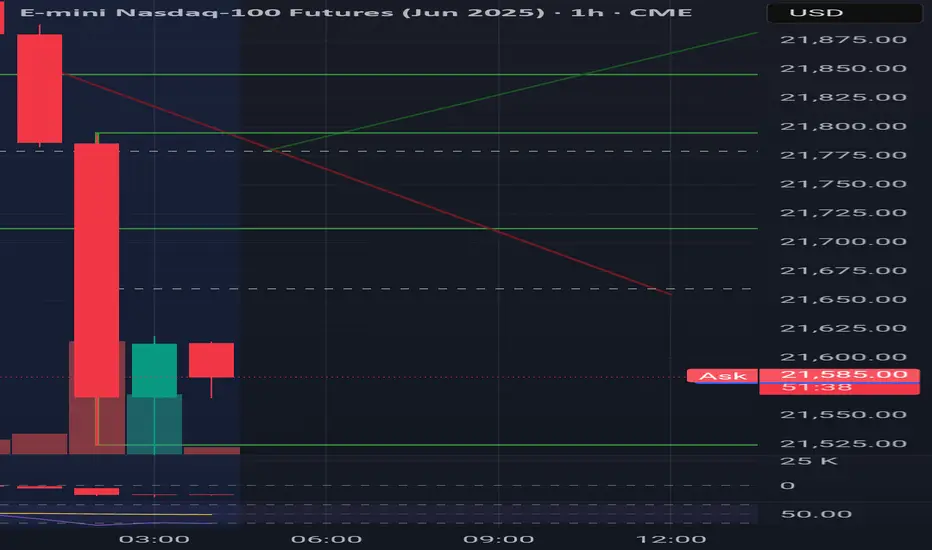
US–Iran Conflict Triggers a Potential Nasdaq Bearish Setup🟣 Geopolitical Flashpoint Meets Technical Confluence
The U.S. weekend airstrike on Iranian nuclear facilities has reignited geopolitical instability across the Middle East. While broader markets often absorb news cycles quickly, high-beta assets like Nasdaq futures (NQ) tend to react more dramatically—especially when uncertainty meets existing technical vulnerability.
Monday’s session opened with a notable gap to the downside, reflecting immediate risk-off sentiment among futures traders. While the initial drop is being retraced intraday, historical patterns suggest that such gap-fills can often serve as ideal shorting zones—particularly when other bearish signals confirm the narrative. The backdrop is clear: this is no ordinary Monday open.
🟣 Bearish Divergence on CCI Builds the Case
From a technical standpoint, the setup gains weight through a clear bearish divergence on the Commodity Channel Index (CCI) using a 20-period setting. While prices recently pushed higher, momentum failed to follow—an early indication that buyers may be running out of steam. This divergence appears just as price approaches the origin of Friday’s gap, a level that frequently acts as a resistance magnet in such contexts. This confluence of weakening momentum and overhead supply aligns perfectly with the geopolitical catalyst, offering traders a compelling argument for a potential reversal in the short term.
🟣 Gap Origin: The Line in the Sand
The origin of the gap sits at 21844.75, a price level now acting as potential resistance. As the market attempts to climb back toward this zone, the likelihood of encountering institutional selling pressure increases. Gap origins often represent unfinished business—zones where prior bullish control was suddenly interrupted. In this case, the added layer of global tension only strengthens the conviction that sellers may look to reassert dominance here. If price action stalls or rejects at this zone, it could become the pivot point for a swift move lower, especially with bearish momentum already flashing caution signals.
🟣 Trade Plan and Reward-to-Risk Breakdown
A potential short trade could be structured using 21844.75 as the entry point—precisely at the gap origin. A conservative stop placement would rest just above the most recent swing high at 22222.00, offering protection against a temporary squeeze. The downside target aligns with a prior UFO support area near 20288.75, where demand previously showed presence. This sets up a risk of 377.25 points versus a potential reward of 1556.00 points, resulting in a reward-to-risk ratio of 4.12:1. For traders seeking asymmetrical opportunity, this ratio stands out as a strong incentive to engage with discipline.
🟣 Futures Specs: Know What You’re Trading
Traders should be aware of contract specifics before engaging. The E-mini Nasdaq-100 Futures (NQ) represent $20 per point, with a minimum tick of 0.25 worth $5.00. Typical margin requirements hover around $31,000, depending on the broker.
For smaller accounts, the Micro Nasdaq-100 Futures (MNQ) offer 1/10th the exposure. Each point is worth $2, with a $0.50 tick value and much lower margins near $3,100.
🟣 Discipline First: Why Risk Management Matters
Volatility driven by geopolitical events can deliver fast gains—but just as easily, fast losses. That’s why stop-loss orders are non-negotiable. Without one, traders expose themselves to unlimited downside, especially in leveraged instruments like futures. Equally critical is the precision of entry and exit levels. Acting too early or too late—even by a few points—can compromise an otherwise solid trade. Always size positions according to your account, and never let emotion override logic. Risk management isn’t a side-note—it’s the foundation that separates professionals from those who simply speculate.
When charting futures, the data provided could be delayed. Traders working with the ticker symbols discussed in this idea may prefer to use CME Group real-time data plan on TradingView: tradingview.sweetlogin.com - This consideration is particularly important for shorter-term traders, whereas it may be less critical for those focused on longer-term trading strategies.
General Disclaimer:
The trade ideas presented herein are solely for illustrative purposes forming a part of a case study intended to demonstrate key principles in risk management within the context of the specific market scenarios discussed. These ideas are not to be interpreted as investment recommendations or financial advice. They do not endorse or promote any specific trading strategies, financial products, or services. The information provided is based on data believed to be reliable; however, its accuracy or completeness cannot be guaranteed. Trading in financial markets involves risks, including the potential loss of principal. Each individual should conduct their own research and consult with professional financial advisors before making any investment decisions. The author or publisher of this content bears no responsibility for any actions taken based on the information provided or for any resultant financial or other losses.

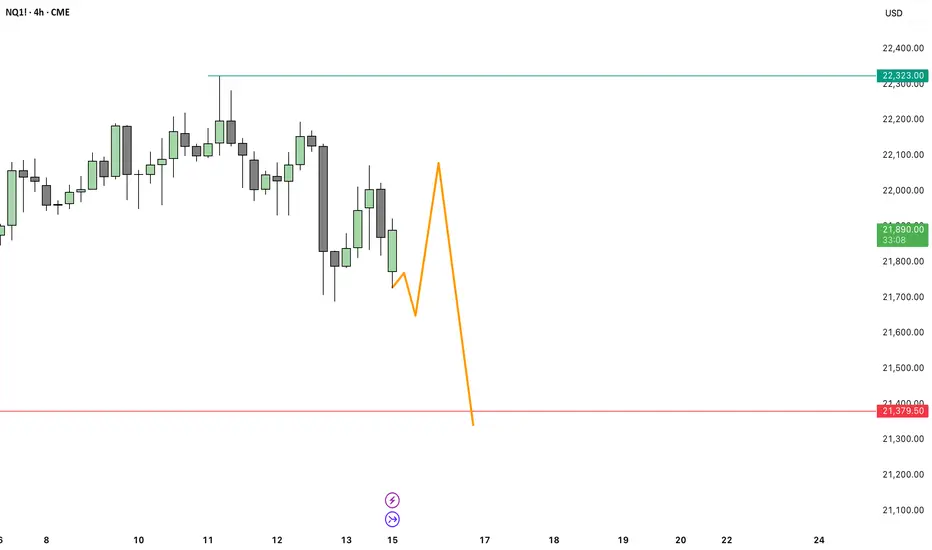
NQ ShortLook for NQ shorts only after a 4 hour high is taken, as we look for the weekly candle to expand lower. As this week is the 3rd candle in the swing formation
NQ dip expectation for no apparent reason (almost certainly not NQ has a good 35 minute window to make the ultimate fall sub 21400
Weekly Market Forecast: Wait To Buy S&P, NAS, & OIL!In this Weekly Market Forecast, we will analyze the S&P 500, NASDAQ, DOW JONES, Gold and Silver futures, for the week of June 22-28th.
The tensions in the Middle East take center stage, as Iran has signaled they are willing to discuss limitations on there Uranium enrichment program. This could allow outflows from safe havens and inflows to risk assets.
Keep and eye on Silver for shorts, in the near term, though.
Let's see if the market tilts its hand early next week. Monday should bring clarity.
Wait for confirmations before entering trades. A break of structure would be ideal! Enter on the pullback to that structure point.
Enjoy!
May profits be upon you.
Leave any questions or comments in the comment section.
I appreciate any feedback from my viewers!
Like and/or subscribe if you want more accurate analysis.
Thank you so much!
Disclaimer:
I do not provide personal investment advice and I am not a qualified licensed investment advisor.
All information found here, including any ideas, opinions, views, predictions, forecasts, commentaries, suggestions, expressed or implied herein, are for informational, entertainment or educational purposes only and should not be construed as personal investment advice. While the information provided is believed to be accurate, it may include errors or inaccuracies.
I will not and cannot be held liable for any actions you take as a result of anything you read here.
Conduct your own due diligence, or consult a licensed financial advisor or broker before making any and all investment decisions. Any investments, trades, speculations, or decisions made on the basis of any information found on this channel, expressed or implied herein, are committed at your own risk, financial or otherwise.

#202525 - priceactiontds - weekly update - nasdaq e-mini futuresGood Day and I hope you are well.
comment: Full bear mode. Below 21600 we see 21000 come real fast and bulls can kiss 22000+ goodbye for months or years. Market has not found enough buyers above 22000 for a month and we not got another potential huge risk-off event which will likely be too much for big institutions to ignore. Print above 22000/22100 means I am wrong.
Last week my bearish thesis was that we go down from last Friday but since market did not touch the daily ema for so long, we got another week sideways. Now bears got help from orange face and I can not see them coming back from this as well.
current market cycle: trading range - daily close below 21500 confirms my thesis
key levels for next week: 20900 - 21800
bull case: Still no close below daily ema but markets failed to print higher highs for 2 weeks now. If we gap down and print below 21500, you can not hold long on hope. Got nothing for the bulls unless they print above 22000 again and even then we can only expect sideways.
Invalidation is below 21500
bear case: I have laid out my bear case for the markets enough by now. I see a move below 21500 as confirmation and especially a daily close below. 21000 is the next obvious target before we can expect a pullback. 20400ish would be my next target below since that is the big bull gap close.
Invalidation is above 22000/22100
short term: Full bear mode. Expecting a big futures gap down on open and a daily close below 21500 if not 21000, which would mean we are in W1 which could be a spike and then only move sideways before W3 comes around. I have drawn a probably path down over the next weeks.
medium-long term - Update from 2024-06-22: Daily close below 21500 is my validation for the new bear trend which has the first bigger target at 21000 but I think we will printed below 20000 again this year. Structure is obviously not yet bearish, so don’t be early if you want confirmation and can’t/won’t scale in to shorts higher. Getting into longer term shorts above 21500 seems like the banger trade right now.
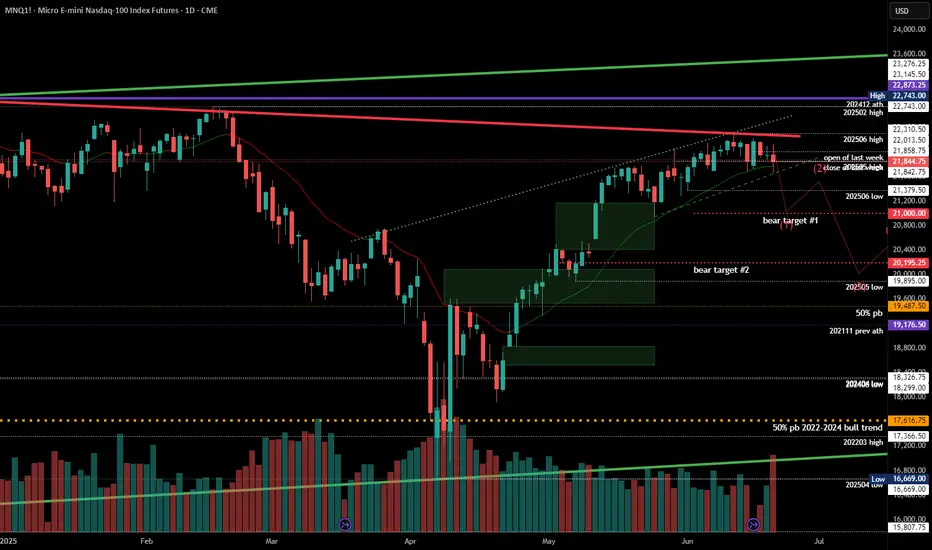
NQ Update 6.22.25NQ is currently sitting monthly and weekly supply zones.
On the weekly chart, price has consolidated upward but has mostly rejected every push into ATHs.
Note that there are still two untested highs with volumes of 2.336M and 3.392M sitting above. The last time price touched these points there was a 26.60% drawdown on SPY. Indicating lots of liquidity that could still be tapped before making a big move down, IF price decides to drop from here.
In addition to these bearish indicators, price is testing a monthly and weekly downtrend line while creating a head n shoulders pattern. Which could also be signaling a rejection of price.
Despite what I am seeing, I will treat price as if it is still bullish until market structure indicates otherwise.
On the daily timeframe, price can be seen to be clearing trending into a rising wedge. This chart pattern is known to be a bearish pattern but it can also signal a breakout continuation which is why it is important to wait for confirmation and never assume direction.
With price holding and sitting at the uptrend and downtrend on the LTFs, as well as 21,816 being a key area that price seems to be consolidated around. I will wait for price to break consolidation and choose a side before placing any trade on NQ.
If you MUST place a trade, do not place a trade until price moves above or below 21,922 and 21,775, respectively.
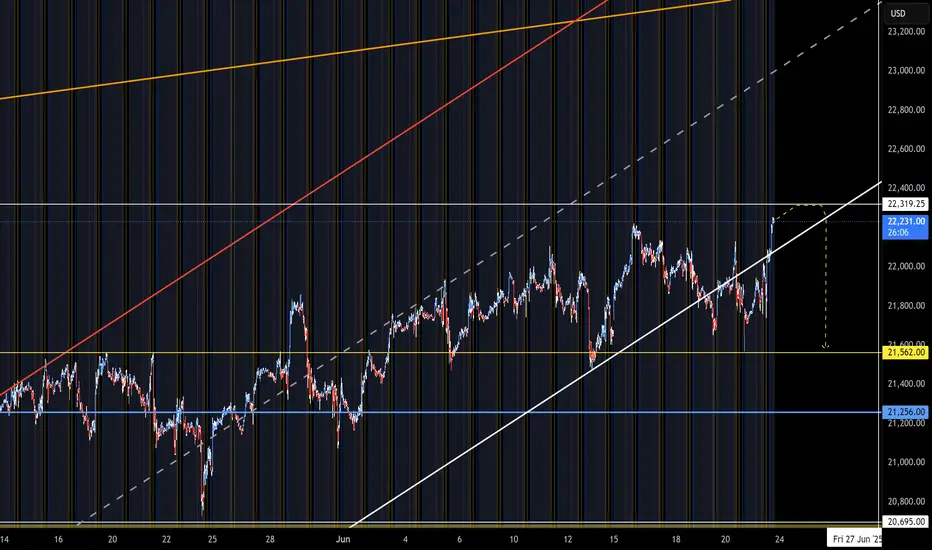
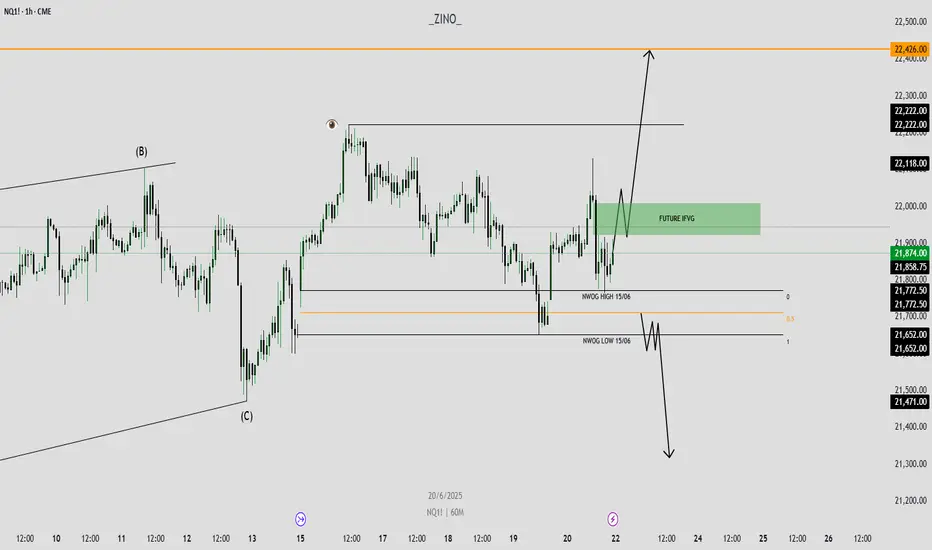
NQ 23/06/2025 BIASHERE IS MY SIMPLE IDEA ABOUT NQ FOR THE NEXT WEEK
everything is clear as the snapshot says
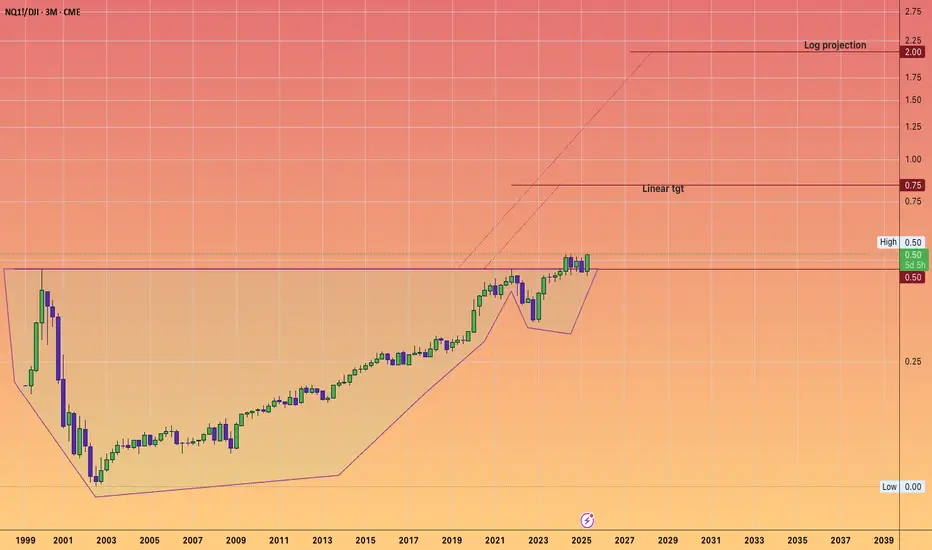
In the 2030's The Nasdaq 100 to 2X the Dow Jones.#CupandHandle don't fight the trend.
Technology vs Industrials.
AI
Robotics
Space Economy
Biotech
Artificial Super Intelligence to power GDP to insane levels.
MNQU2025 SELL IDEAMy bias for MNQ this morning with this trade of 2 contracts running. Would like to see price trade lower to 9:30am lows.
What do you guys think will happen? Will post results of the trade below.
Thanks for watching! Give a like if you enjoyed the explanation and a comment on what you'd like me to share with you guys about my trading journey.

trade idea took 3 trade one got trilled in profit the second one was trilled in stop loss the third one hit the full tp.

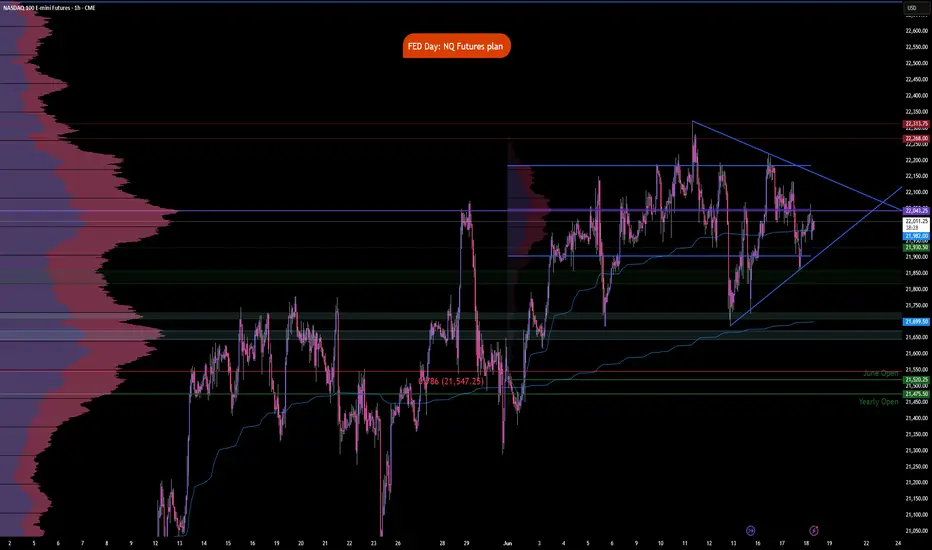
FED Day: NQ Futures planCME_MINI:NQ1!
Today is FOMC day; however, there is a larger geopolitical risk looming, along with the trade war and tariffs situation unfolding.
Recently, we have noted inflation moving lower, although it is not yet at the FED’s 2% target. Retail sales fell sharply last month. Tariffs have not yet resulted in inflation so far, partly due to the 90-day pause, and with possible extensions, some deals agreed upon, and a framework for others in place, tariff uncertainty has considerably reduced.
On the contrary, lower energy prices that supported lower inflation have risen due to ongoing geopolitical issues. Risks remain high for elevated energy prices even if supply and sea routes remain unharmed. In our view, this is due to the fragility of the situation and what it would take to turn the ongoing war into the worst possible outcome.
The FED releases their Summary of Economic Projections. Key data points will be inflation and growth projections, along with interest rate projections and any talks about neutral rates and expected cuts, given the bleak global outlook and growth. The FED is otherwise expected to hold rates steady in this meeting.
Given this, and what Chair Powell says in the FOMC press conference, their commitment towards driving inflation lower versus maximum employment, risks on the growth and employment side have started to worsen. If rate cut bets are moved forward or if markets price in more rate cuts than currently priced in, we may see equity index futures make further gains.
NQ futures are coiling; the yearly VPOC has shifted higher, as we explained in our previous analysis.
Today’s meeting may be key for further fuel higher or lower, depending on how it pans out. Market participants are in a wait and see mode. Markets are accepting higher prices and break of balance is key to determine the direction price may be headed in. Until otherwise proven, markets are range bound and mean reverting from June Composite Volume Profile towards monthly VWAP and VPOC.
NQ100 → Entering the Danger Zone?📈 1. Technical Context (Price Action & Structure)
The daily chart shows a strong bullish continuation from the 17,350 area, with price now extending toward the 22,000 USD zone.
We are currently within a weekly/monthly supply, with:
Mild RSI divergence in overbought conditions
Temporary rejection at 22,050–22,200
A potential liquidity sweep above highs before distribution or pullback
The monthly structure shows a strong swing low that may serve as anchor for a future reversal
🧠 2. COT Report – Commitment of Traders (as of June 3)
Commercials (Smart Money):
+4,041 long | +3,320 short → Net +1,455 → hedging phase, not trend expansion
Non-Commercials (Speculators):
–2,237 long | +125 short → net exposure reduction
Open Interest increasing → new positions building, but no extreme imbalance
📌 Conclusion: Tactical neutrality, slight bullish lean from commercials.
📆 3. Seasonality
June has been historically bullish, especially in the past 2 years (+700 pts avg)
10Y average still leans bullish
⚠️ September is a clear seasonal reversal month across all timeframes
📌 Conclusion: Seasonal tailwind through end of June; cyclic reversal risk into Q3.
📰 4. Macro Calendar
High-impact USD week:
CPI – Wed, June 11
PPI – Thu, June 12
These will be critical to:
Validate the disinflation narrative
Set expectations for a Fed cut by Sep/Nov
📌 Conclusion: Expect explosive mid-week volatility — watch for liquidity spikes above 22,000 if CPI surprises.
⚙️ Operational Outlook
✅ Primary scenario (bullish continuation):
🎯 Target: 22,260 → fib extension + structure
❌ Invalid below 21,350
🔄 Alternative scenario (mean reversion):
🔻 Short from 22,050–22,200
🎯 Target: 20,950 → liquidity + FVG zone
🔁 Trigger: weekly engulf or hotter-than-expected CPI
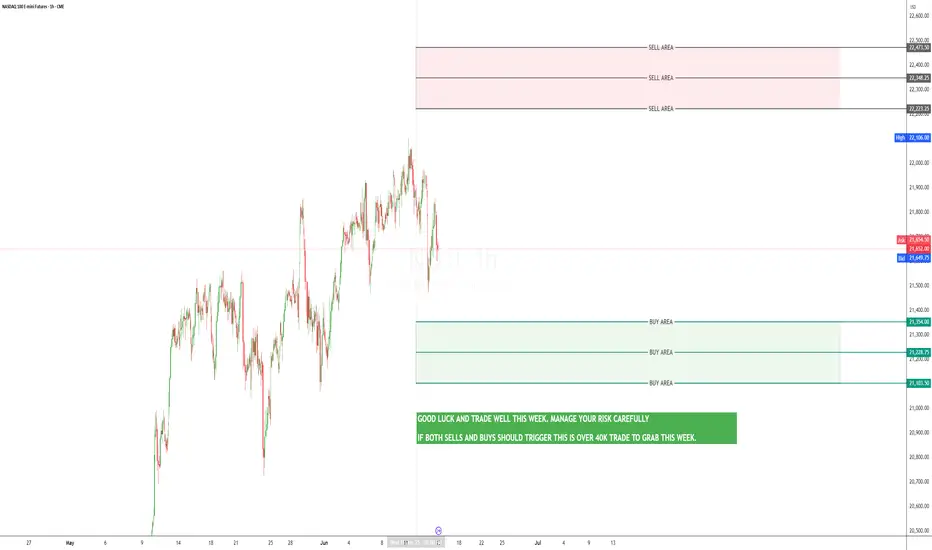
NASDAQ (NQ) ANALYSIS FOR THE WEEKI've been studying NQ & others and want to share my analysis. Trading involves probabilities, so it's essential to be confident and prepared. Study the market thoroughly before trading with real money.
Let's test strategies this week. You may use a live account if you have capital, and manage your stop losses carefully. Next week, I'll provide more details on entry points and stop losses. Wait for trades at specified levels and avoid positions in the middle to minimize losses. Be patient and trade from one edge to the other.
Good luck and make money.
For one-on-one sessions: $20k per person. You'll learn weekly, monthly, and yearly calculations. Weekly subscriptions are also available for $500 per person.
Disclaimer:
The forecasts provided herein are intended for informational purposes only and should not be construed as guarantees of future performance. This is an example only to enhance a consumer's understanding of the strategy being described above and is not to be taken as Blueberry Markets provides personal advice.