ETHUSD, BTCUSD & Nasdaq Daily Trade SetupsIn this update we review the recent price action in Ethereum, Bitcoin and Nasdaq futures contracts and identify the next high-probability trade setups and price objectives to target. To review today's video analysis, click here!
NDAQ100U2025 trade ideas

NQ: 205th trading session - recapI'm back after a pretty long vacation. Took the time to just rewind myself n sh#t.
Pretty boring session today, but I was locked in the whole t ime so that's a bonus point

Nasdaq Leading Equities HigherThe equity markets are seeing higher prices today with the Nasdaq leading the way higher trading up near 2.5% on the day while the S&P and Russell both traded over 1% as well. There was steep selling pressure in equities to end the week last Friday due to additional tensions in the Middle East, and the markets are seeing a strong rebound today, especially on the technology front. While the equities were strong today, Crude Oil had the opposite effect, with a strong push higher on Friday and strong selling pressure on the session today trading down near 2.5%.
Looking ahead for the week, the big ticket item will be the Fed Meeting and interest rate decision on Wednesday the 18th, where the market is pricing in another pause on interest rates. Looking at the CME Fed Watch Tool, it is pricing in the first rate cut of the year to come in September at a 56% probability, which has continued to get pushed back later into the year with all of the uncertainty and volatility in the market. Traders will be more concerned with Fed Chair Powell’s remarks after the decision about the future plans of the Fed for the remainder of the year.
If you have futures in your trading portfolio, you can check out on CME Group data plans available that suit your trading needs tradingview.com/cme/
*CME Group futures are not suitable for all investors and involve the risk of loss. Copyright © 2023 CME Group Inc.
**All examples in this report are hypothetical interpretations of situations and are used for explanation purposes only. The views in this report reflect solely those of the author and not necessarily those of CME Group or its affiliated institutions. This report and the information herein should not be considered investment advice or the results of actual market experience.

Conditions For A Pullback In The NASDAQ 100 Are PresentAll the conditions for a reversal in the NASDAQ 100 appear to be in place, but just because these conditions are present doesn’t mean a reversal must occur. The most obvious condition is the presence of a rising wedge, which formed over the past month and broke on Friday. Whether this pattern entirely unfolds remains to be seen, but there is supporting evidence suggesting it may.
Momentum, as measured by the Relative Strength Index, has clearly been trending lower since peaking on May 19, even as the price of the NASDAQ 100 has continued to rise—a classic bearish divergence.
Over the same period, we’ve observed the NASDAQ rising on decreasing levels of volume—another characteristic of a rising wedge pattern. Then, on Friday, the index broke below the lower boundary of the wedge. The wedge measures approximately 7% from its bottom to the top, suggesting that if the pattern fully plays out, the NASDAQ could decline back to around 20,350. It is also worth noting that there is a gap on the chart at 20,150, which could potentially be filled during such a pullback.
However, that doesn’t mean a decline will be straightforward, because, for now at least, the NASDAQ has found support at the 20-day moving average at 21,514. The NASDAQ will therefore need to break through this strong support level for a deeper decline to occur. In fact, the NASDAQ has not traded below its 20-day moving average since April 23.
While all the conditions for a break from the NASDAQ’s rising wedge are present and appear on the verge of unfolding, the market still has much to prove before the bearish scenario can fully materialize.
Written by Michael J. Kramer, founder of Mott Capital Management.
Disclaimer: CMC Markets is an execution-only service provider. The material (whether or not it states any opinions) is for general information purposes only and does not take into account your personal circumstances or objectives. Nothing in this material is (or should be considered to be) financial, investment or other advice on which reliance should be placed.
No opinion given in the material constitutes a recommendation by CMC Markets or the author that any particular investment, security, transaction, or investment strategy is suitable for any specific person. The material has not been prepared in accordance with legal requirements designed to promote the independence of investment research. Although we are not specifically prevented from dealing before providing this material, we do not seek to take advantage of the material prior to its dissemination.
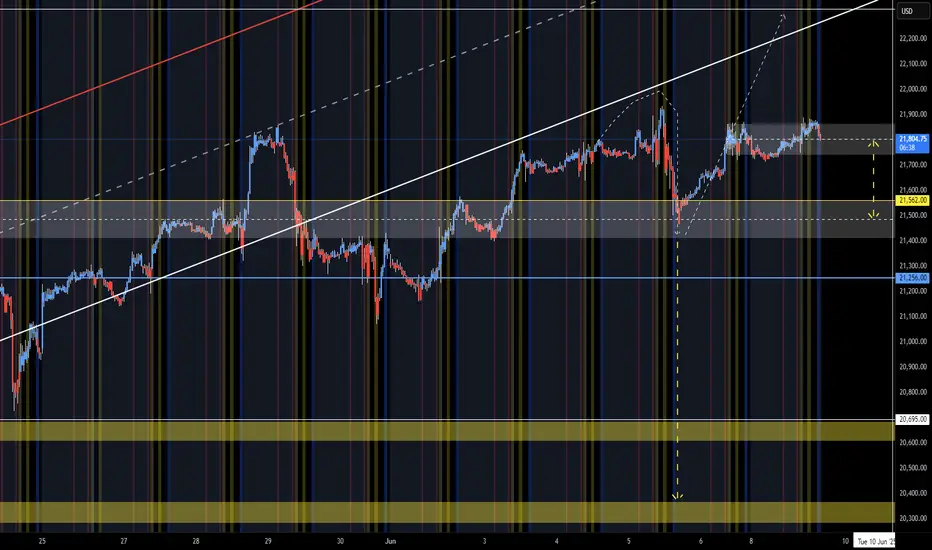
push up nasdaqwe can see that the market has properly push to the upside, looking for a break of range.
entry is in blue, and correspoinds to daily levels that has shown rejection to the upside.
possible drop in the first minutes, and then a move to the upside.
entry in blue. stop in red and target in green.
HAVE FUN
TSP
NQ Short (06-10-25)NAZ inside the range should try lower and fall through for a drop test. F-M Long Play Fizzle.
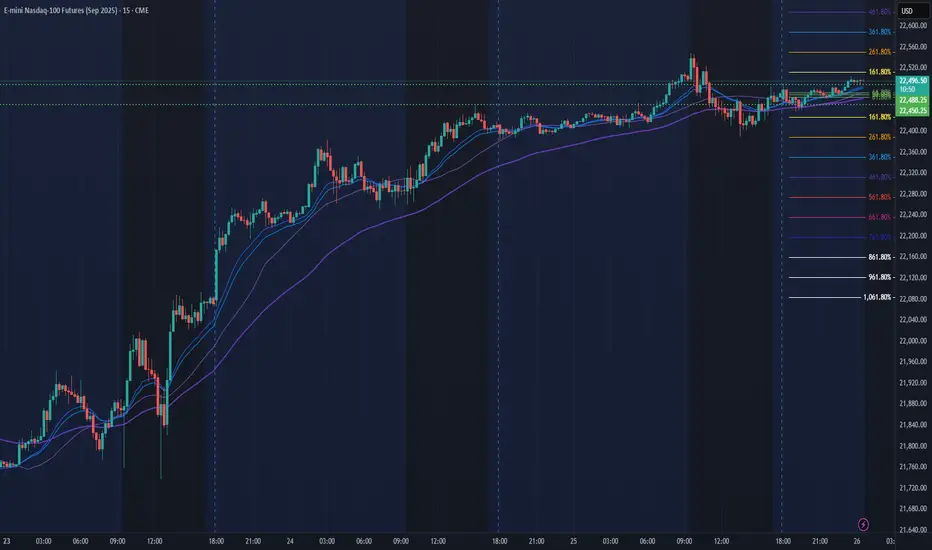
NQ Power Range Report with FIB Ext - 6/26/2025 SessionCME_MINI:NQU2025
- PR High: 22488.25
- PR Low: 22450.25
- NZ Spread: 85.0
Key scheduled economic events:
08:30 | Initial Jobless Claims
GDP
Durable Goods Orders
Session Open Stats (As of 12:25 AM 6/26)
- Session Open ATR: 358.17
- Volume: 20K
- Open Int: 252K
- Trend Grade: Neutral
- From BA ATH: -1.7% (Rounded)
Key Levels (Rounded - Think of these as ranges)
- Long: 22667
- Mid: 21525
- Short: 20383
Keep in mind this is not speculation or a prediction. Only a report of the Power Range with Fib extensions for target hunting. Do your DD! You determine your risk tolerance. You are fully capable of making your own decisions.
BA: Back Adjusted
BuZ/BeZ: Bull Zone / Bear Zone
NZ: Neutral Zone
PO3 analysis previewThis chart displays my current working model for PO3 structure, focusing on a multi-timeframe analysis (9m, 27m, 81m, 3H) using volume imbalances and key time-based phases. I’ve marked potential accumulation, manipulation, and distribution zones, alongside session-specific traps (like NYO sweeps) and key reaction areas tied to historical VIs.
The purpose of this post is to visually document these events and align them with real-time behavior. I'm exploring how price respects past VIs and cycles — especially when PO3 bar counts match across timeframes — and whether timing precision (e.g., bar 3/9 revisits) is consistently repeatable.
All annotations are part of a larger test strategy currently in development.

2025-06-25 - priceactiontds - daily update - nasdaq e-mini
Good Evening and I hope you are well.
comment: Market is leaving behind gaps and breakout prices are tested but we stay above. Also higher highs and higher lows. Max bullish for new ath still.
current market cycle: trading range
key levels: 21500 - 22300
bull case: Bulls want 23000. They have to keep it above 22400 to keep the max bullish momentum going for tomorrow. Below 22400 we could test down to 22200 before another leg up. Multiple way to draw the trend lines, all are correct until broken. So draw them and watch what market does when it gets near them.
Invalidation is below 22200.
bear case: Bears actually made money selling 22500, which was a surprise to me. Especially that we stay below the open price. Bad session for me today. I still got nothing for the bears until they print below 22200 again. Everything on this chart is bullish. Best bears can hope for is another pullback below 22500 and go sideways.
Invalidation is above 22550.
short term: Max bullish for 22800 or 23000.
medium-long term - Update from 2024-06-22: Daily close below 21500 is my validation for the new bear trend which has the first bigger target at 21000 but I think we will printed below 20000 again this year. Structure is obviously not yet bearish, so don’t be early if you want confirmation and can’t/won’t scale in to shorts higher. Getting into longer term shorts above 21500 seems like the banger trade right now.
trade of the day: Buying the double bottom 22390 or any long close to it. Wasn’t the trade with most profit but the most obvious one.
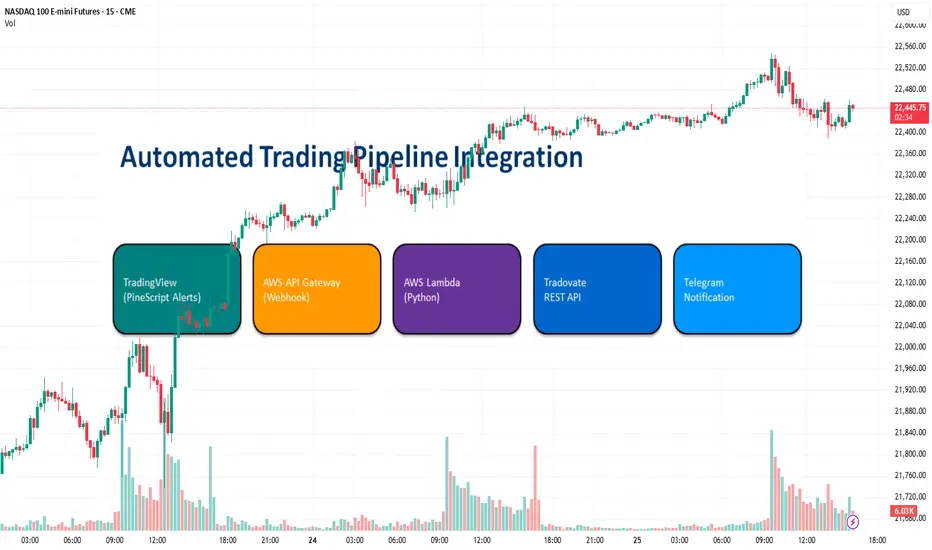
Automating Your Trading Pipeline: Series Overview
Hello fellow traders!
Over the next week I’ll be rolling out a short series on how to take your TradingView alerts all the way through to live orders—fully automated—using AWS and the Tradovate API.
Today’s post is just the big-picture overview. In the days ahead we’ll peel back the layers and show you exactly how each piece fits together:
TradingView PineScript Alerts: how to craft alert payloads in Pine.
AWS API Gateway web-hook: receiving and validating your alerts.
AWS Lambda Python – processing payloads & calculating SL and TP.
Tradovate REST API – placing bracket (OCO) orders.
Telegram Notifications – real-time trade confirmations to your phone.
At the end of this series you’ll have a fully-automated end-to-end pipeline, no more manual order entry!
Stay tuned for Part 2 , when we’ll dive into crafting precise JSON alerts in PineScript.

NQ Power Range Report with FIB Ext - 6/25/2025 SessionCME_MINI:NQU2025
- PR High: 22412.00
- PR Low: 22384.50
- NZ Spread: 61.5
Key scheduled economic events:
10:00 | Fed Chair Powell Testifies
- New Home Sales
10:30 | Crude Oil Inventories
Session Open Stats (As of 12:35 AM 6/25)
- Session Open ATR: 372.52
- Volume: 18K
- Open Int: 253K
- Trend Grade: Neutral
- From BA ATH: -1.9% (Rounded)
Key Levels (Rounded - Think of these as ranges)
- Long: 22667
- Mid: 21525
- Short: 20383
Keep in mind this is not speculation or a prediction. Only a report of the Power Range with Fib extensions for target hunting. Do your DD! You determine your risk tolerance. You are fully capable of making your own decisions.
BA: Back Adjusted
BuZ/BeZ: Bull Zone / Bear Zone
NZ: Neutral Zone
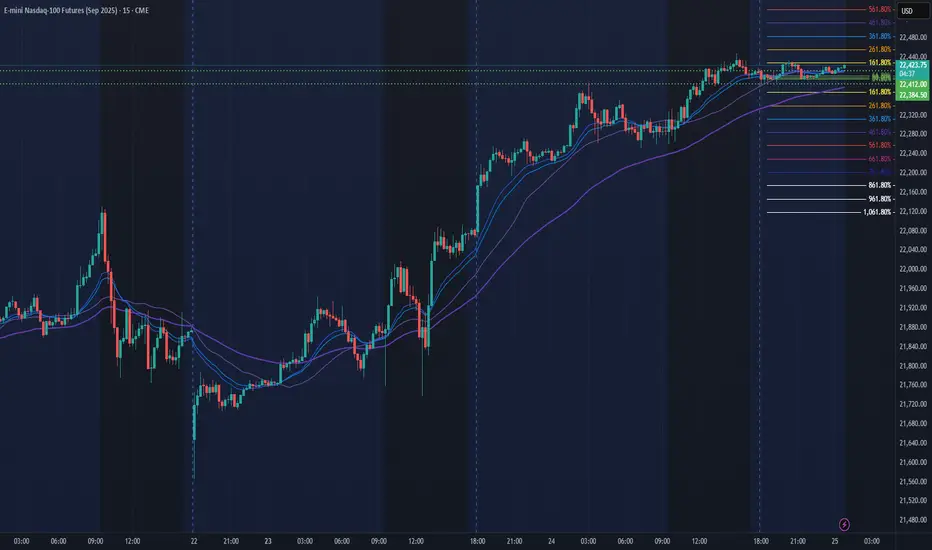
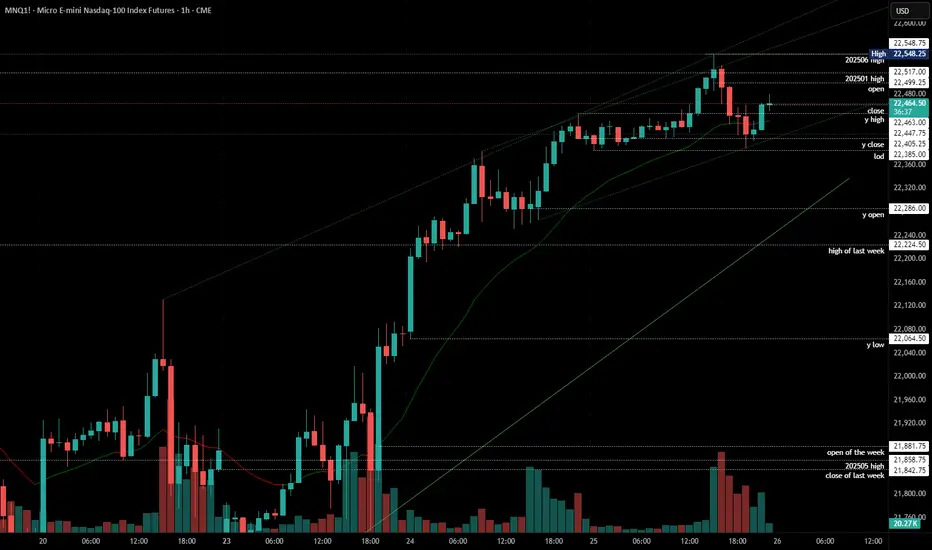
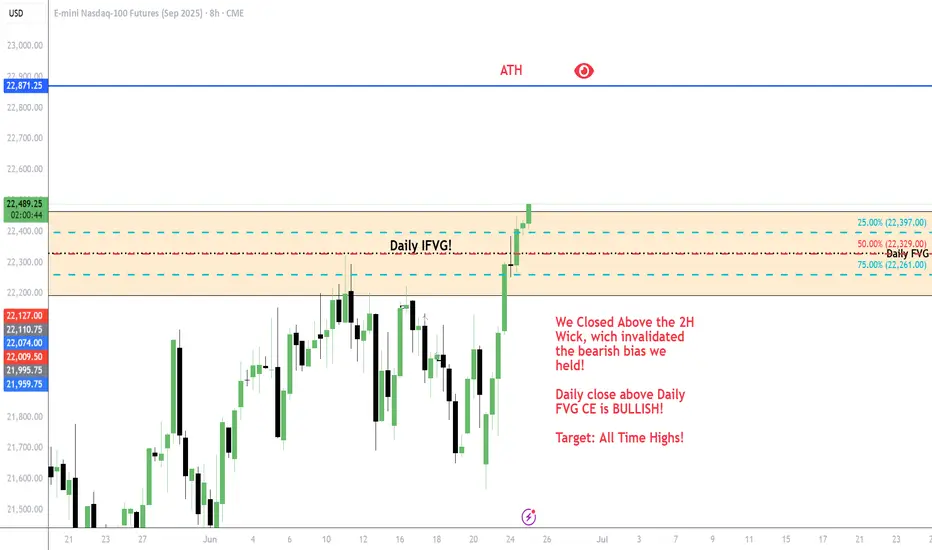
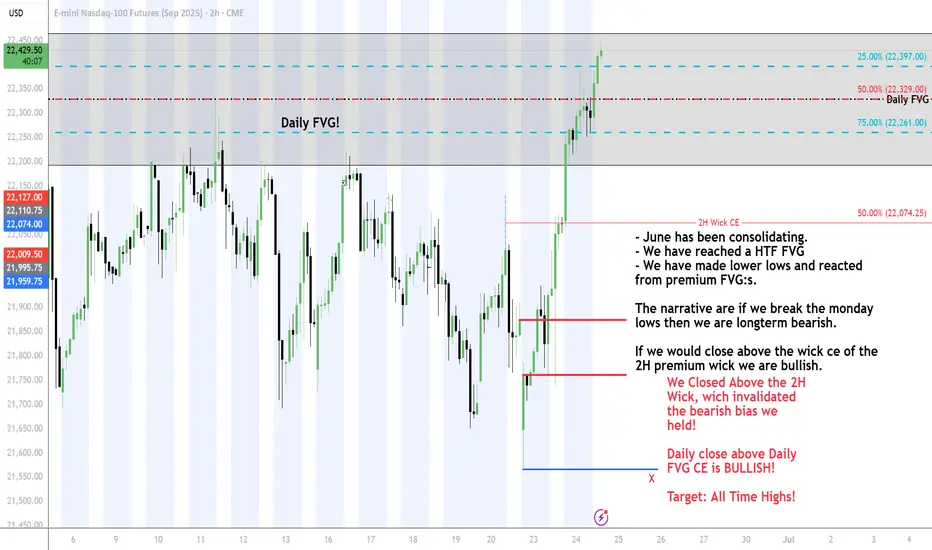
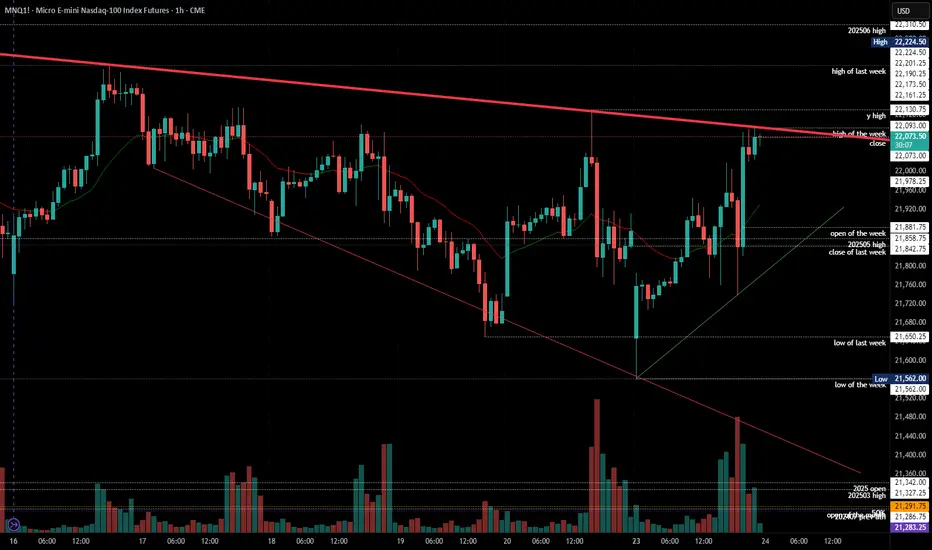
NQ Invalidated Bearish bias!We close above 2H wick CE and went for the Daily FVG. If we close this day, I´m bullish up to All Time Highs.
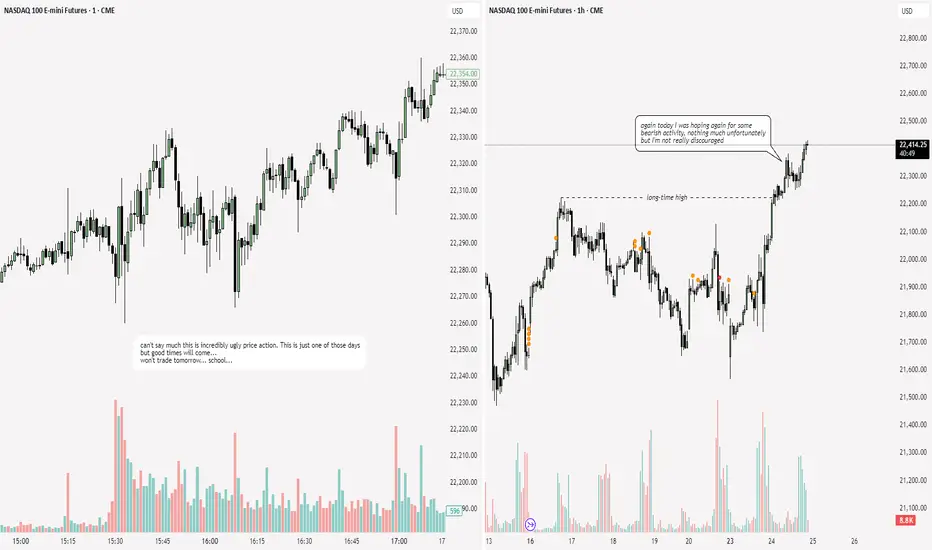
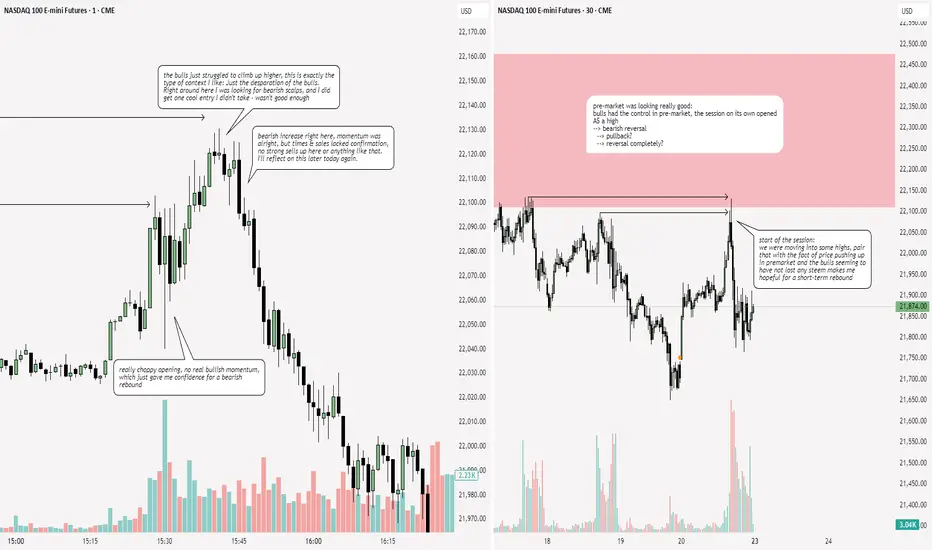
NQ: 209th trading session - recapToday wasn't the best day: My performance wasn't it tbh. Moreover I'm just really anxious about my future and I did NOT have it controlled during my session, not good.
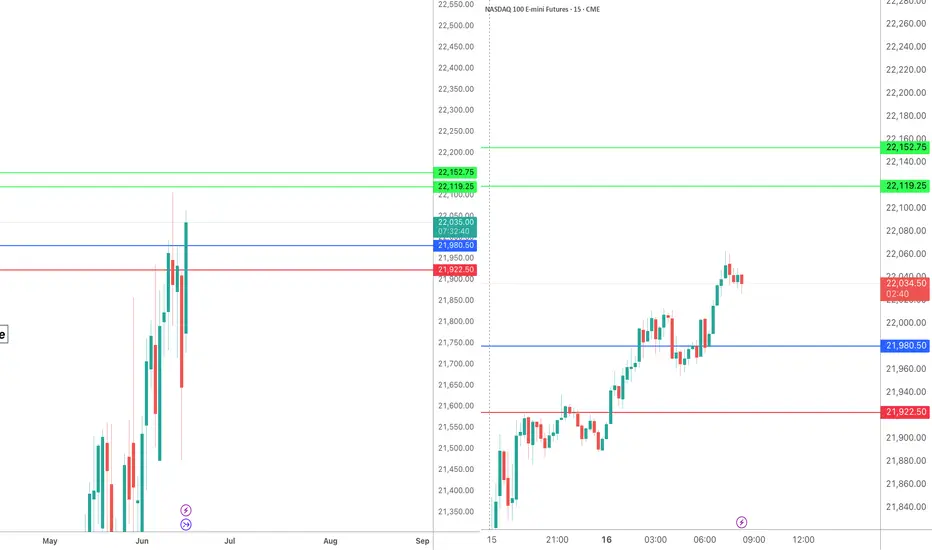
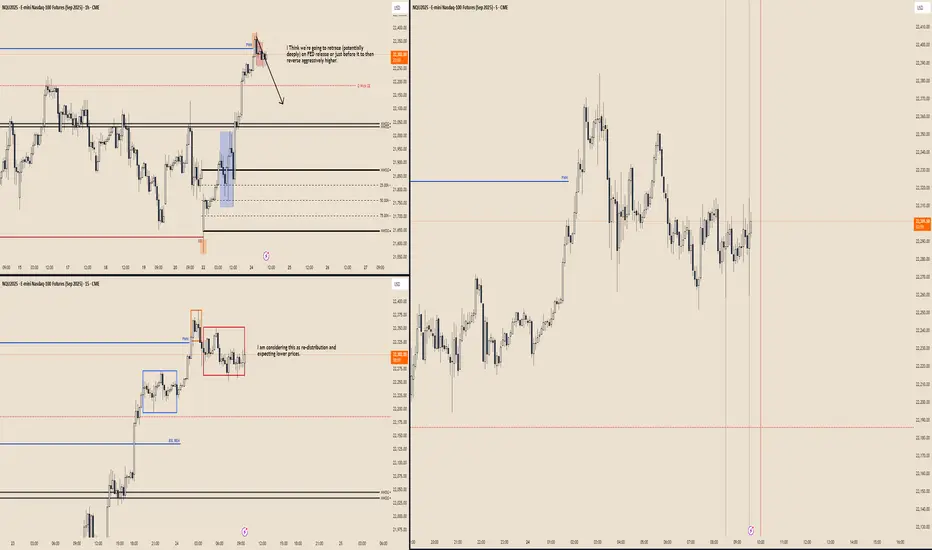
Nasdaq Deep Bearish RetraceI Think we're going to retrace (potentially deeply) on FED release or just before it to then reverse aggressively higher.
I am considering the current "range" on m15 as re-distribution and expecting lower prices on Fed release or just prior before continuation higher that may be delayed till tomorrow next FED.
NQ Power Range Report with FIB Ext - 6/24/2025 SessionCME_MINI:NQU2025
- PR High: 22217.00
- PR Low: 22065.75
- NZ Spread: 337.75
Key scheduled economic events:
10:00 | CB Consumer Confidence
- Fed Chair Powell Testifies
Session Open Stats (As of 12:35 AM 6/24)
- Session Open ATR: 384.68
- Volume: 45K
- Open Int: 240K
- Trend Grade: Neutral
- From BA ATH: -2.8% (Rounded)
Key Levels (Rounded - Think of these as ranges)
- Long: 22096
- Mid: 20383
- Short: 19246
Keep in mind this is not speculation or a prediction. Only a report of the Power Range with Fib extensions for target hunting. Do your DD! You determine your risk tolerance. You are fully capable of making your own decisions.
BA: Back Adjusted
BuZ/BeZ: Bull Zone / Bear Zone
NZ: Neutral Zone
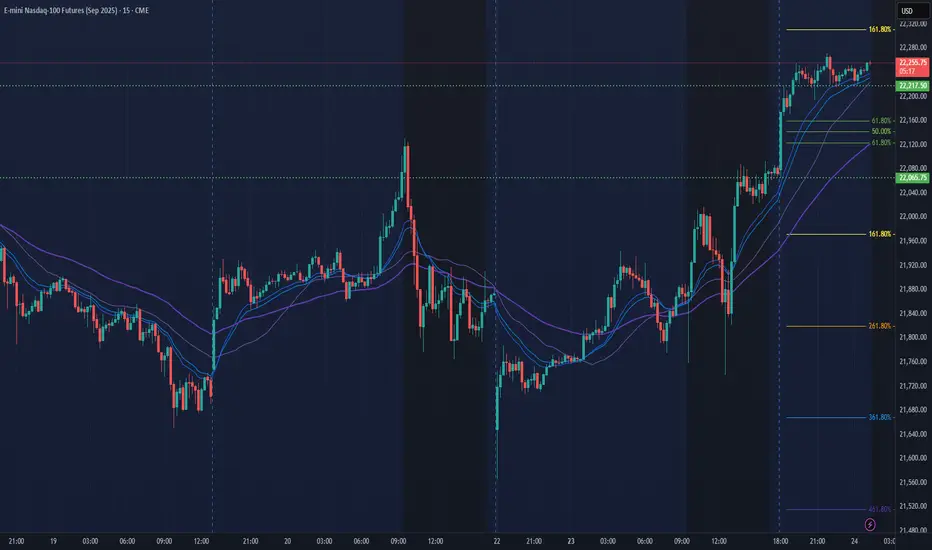
2025-06-23 - priceactiontds - daily update - nasdaq e-miniGood Evening and I hope you are well.
comment: Not even the US President joining a war can start the selling. Truly a special time. Above 22130 there is no reason this can’t test 22300 or higher. Market clearly does not care about the event and the pain trade seems up. Can’t hold bearish thoughts after today’s reversals. Very small chance that if we stay below 22130, bears come around and we test down to 21800 or lower.
current market cycle: trading range
key levels: 21500 - 22300
bull case: Bulls had the following legs up today: 380, 260, 350 points from swing lows to highs. On such a day, this is as bullish as it gets. They now need to print a higher high and then there is no more obvious reason why we can’t test back up to 22300 or higher.
Invalidation is below 21900.
bear case: Bears vanished after the double bottom in the US session and market closed at the high. Which is worst case for bears. Above 21130 they have to cover and I expect an acceleration upwards. If they somehow come around strongly and we go below 21950, then chances are decent that we can test down to 21800 again. Bears need to sell it early tomorrow or the bear trend line is gone and we could go much higher.
Invalidation is above 22130.
short term: Neutral. Only interested in shorts if we stay below 22130. I still think markets are grossly miss-priced and complacent but for now that thesis is wrong.
medium-long term - Update from 2024-06-22: Daily close below 21500 is my validation for the new bear trend which has the first bigger target at 21000 but I think we will printed below 20000 again this year. Structure is obviously not yet bearish, so don’t be early if you want confirmation and can’t/won’t scale in to shorts higher. Getting into longer term shorts above 21500 seems like the banger trade right now.
trade of the day: Buying literally every dip was good.
NQ Power Range Report with FIB Ext - 6/23/2025 SessionCME_MINI:NQU2025
- PR High: 21787.00
- PR Low: 21566.75
- NZ Spread: 491.75
Key scheduled economic events:
09:45 | S&P Global Manufacturing PMI
- S&P Global Services PMI
10:00 | Existing Home Sales
Open weekend gap down ~0.33%
Session Open Stats (As of 12:45 AM 6/23)
- Session Open ATR: 382.81
- Volume: 38K
- Open Int: 234K
- Trend Grade: Neutral
- From BA ATH: -4.8% (Rounded)
Key Levels (Rounded - Think of these as ranges)
- Long: 22096
- Mid: 20383
- Short: 19246
Keep in mind this is not speculation or a prediction. Only a report of the Power Range with Fib extensions for target hunting. Do your DD! You determine your risk tolerance. You are fully capable of making your own decisions.
BA: Back Adjusted
BuZ/BeZ: Bull Zone / Bear Zone
NZ: Neutral Zone

NQ: 207th trading session - recapPretty good end to a week. I'm completely focused on scalping for the next week.
I will be having my session everyday exepct wednesday: Schools just too long and I gotta stop skipping class or else my p.e teacher will actually catch on to it
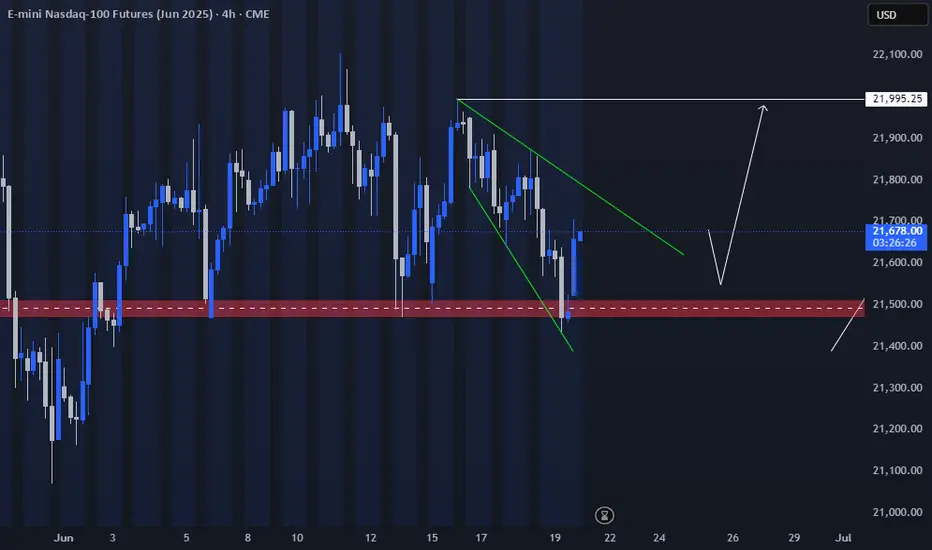
NQ- HTFOn 4 H, we have an inverse and BPR reaction from 4 H order block.
And we have LRRLon 4 H, My target on HTH will be 21996
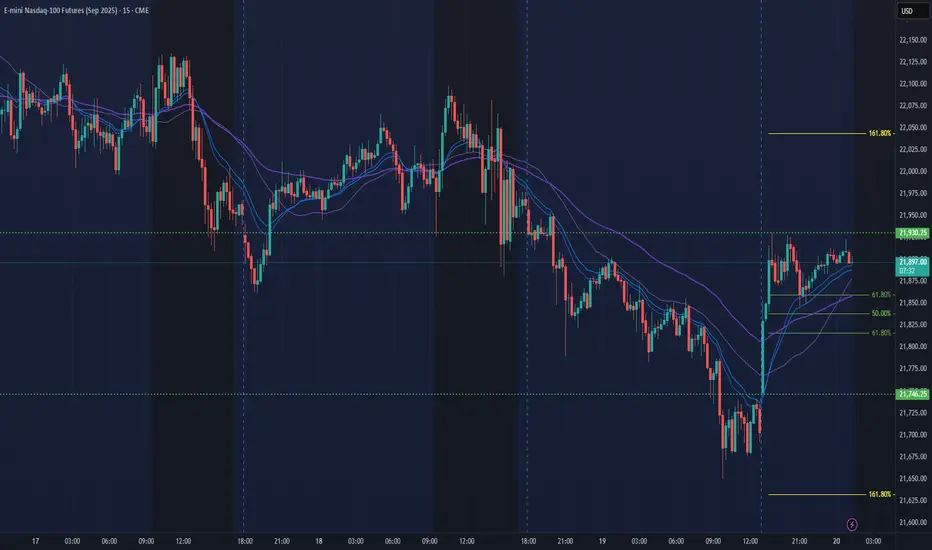
NQ Power Range Report with FIB Ext - 6/20/2025 SessionCME_MINI:NQU2025
- PR High: 21930.25
- PR Low: 21745.75
- NZ Spread: 412.0
Key scheduled economic events:
08:30 | Philadelphia Fed Manufacturing Index
Session Open Stats (As of 1:05 AM 6/20)
- Session Open ATR: 377.21
- Volume: 155K
- Open Int: 230K
- Trend Grade: Neutral
- From BA ATH: -4.2% (Rounded)
Key Levels (Rounded - Think of these as ranges)
- Long: 22096
- Mid: 20383
- Short: 19246
Keep in mind this is not speculation or a prediction. Only a report of the Power Range with Fib extensions for target hunting. Do your DD! You determine your risk tolerance. You are fully capable of making your own decisions.
BA: Back Adjusted
BuZ/BeZ: Bull Zone / Bear Zone
NZ: Neutral Zone
NQ POSSIBLE DIRECTION.Waiting for your kindfull thoughts or ideas regarding to my analysis.
NASDAQ...