NASDAQ Daily Observation Scenarios & Probabilities In ContextCME_MINI:NQ1! CME_MINI:MNQ1! IG:NASDAQ BLACKBULL:NAS100 EIGHTCAP:NDQ100
Well obviously they're 3 possible outcomes but the idea is how we read the context in the upcoming week as the market unfolds each day. But, weighing the outcome based on the current news / fundamentals I would be leading towards 2/3 the the Bullish Long-Term Trend still holds true.
My assumptions would be holding on to the news development of the Iran Israel conflict.
Based on TA heavy we would be still be bullish but a good retracement as the Negotiations of ceasefire with market volatility increase as each time there's a news update with the Conflict & top that with the current Trump Tweets, Tariffs, FED Rate cuts.
Market is weighing the value of this Conflict escalation and deciding the time to price it in. Because market is always forward thinking, IMO.
I personally will be trading these scenarios each-day as the market updates me with NEWS, TA and mainly the Key Levels. As a day futures trader, I will be preparing for volatility. Not as much as the "Liberation Day Sell Off" or the "90 Day Tariff Extension Rally", but futures traders thrive in these kind of market conditions.
It is also sad to hear about the news, or course fundamentally. I am also hoping for the market to make a strong stance absorbing it all with a positive outlook.
Bullish Scenario:
- Market ignores all the war in the Middle East and a rally continuation to make New All Time High.
- News updates on the development of de-escalation war negotiations each day which ends up with a Weekly positive green candle.
Neutral/Consolidation
- News updates brings about both positive & negative impact causing market to range giving the opportunity for accumulation / distribution.
Bearish
- Bad news WAR escalation, Tariffs, Not enough Rate Cuts, Bearish Data.
- Sell side Liquidity wipeout
NOTE:
* 2/3 outcome leaning Bullish because even when a retracement / pullback happens we will rally back up
* since it's a daily observation, i will be looking into the Daily Key Levels of Support/Resistance, Fib Levels, Liquidity Zones, Volume Levels to be tested.
* I wish all good luck and god bless. Thank You.
NDAQ100U2025 trade ideas
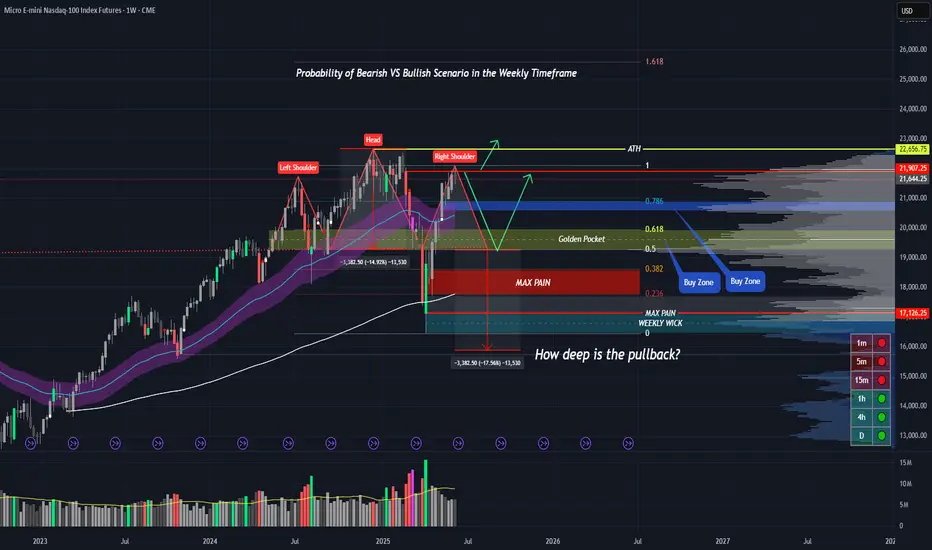
NASDAQ Weekly Analysis TA & Fundamental News Alignment CME_MINI:MNQ1! IG:NASDAQ CME_MINI:NQ1! NASDAQ:NDX BLACKBULL:NAS100
Highest Probability for the upcoming week?
Not looking good with the Friday news tension of Israel Iran war escalation.
Not much of a selloff coming in, I guess the market is still in the wait and see mode of the upcoming weekend news development; could even be in the next week if the success of de-escalation negotiations.
The TA sure look eerie though, big a** H&S formation completion of the last leg. If successful, could we well be in the recession? Will this scare off the FED and force them to CUT RATES?
Smart money opportunity to buy another big dip?
Have we been in a real proper pullback after a massive rally from "Liberation Day" ?
I wonder why we can't break this level in the last week, could it be that the Smart Money selling to Retail?
It sure does look like an exhaustion point doesn't it?
BEARISH SCENARIO:
- Final Leg of the H&S lead to a massive selloff by Retail and Smart Money buying the dip.
- News WAR breakout with Iran vs Israel, with every development leading to a sell-off / rollover.
- Weekend news leading to a massive gap lower in the Monday Asia Open.
- Last week weekly candle close RED wick/shadow suggesting a strong resistance/ rejection level. A high-probability of the next candle will also be a RED Weekly Continuation?
BULLISH SCENARIO:
- Healthy Retracement and holding strong support levels.
- Even for any bearish news the market holds & the participant buying power will maintain a healthy pullback.
- Sweep up to the liquidity making New All Time High.
NOTE:
*This is a weekly analysis, Price Action within the week will reflect differently from day to day.
*The outcome will only be projected by the end of next week.
*Please do comment on your thoughts, a healthy discussion is always welcomed.
*I am publishing my thoughts and context to the way I interpret the market, in no way I am giving any financial advise.
NQ pre market flip ideaVideo showing that you can flip your bias based on price action. I was looking short until i saw the move upwards.

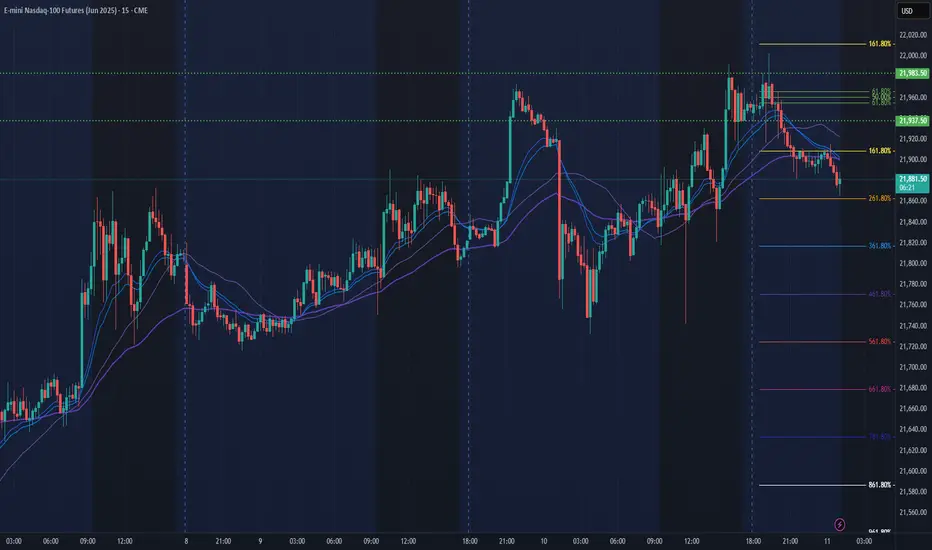
NQ Power Range Report with FIB Ext - 6/13/2025 SessionCME_MINI:NQM2025
- PR High: 21915.75
- PR Low: 21861.75
- NZ Spread: 120.5
No key scheduled economic events
Session Open Stats (As of 12:45 AM 6/13)
- Session Open ATR: 389.53
- Volume: 66K
- Open Int: 267K
- Trend Grade: Neutral
- From BA ATH: -4.9% (Rounded)
Key Levels (Rounded - Think of these as ranges)
- Long: 22096
- Mid: 20383
- Short: 19246
Keep in mind this is not speculation or a prediction. Only a report of the Power Range with Fib extensions for target hunting. Do your DD! You determine your risk tolerance. You are fully capable of making your own decisions.
BA: Back Adjusted
BuZ/BeZ: Bull Zone / Bear Zone
NZ: Neutral Zone

2025-06-12 - priceactiontds - daily update - nasdaq
Good Evening and I hope you are well.
comment: Neutral around 21900. 21700 was the lowest I expected and we printed 21716.5. Weekly close around 21900 is the most likely outcome for me. We have no acceptance above 21900 and none below 21800 as well. A trend day tomorrow would surprise me.
current market cycle: trading range
key levels: 21700 - 22100
bull case: Bulls want to close the week above 21800 to print a green one. They had spikes above 21900 but nothing else. They are still somewhat in control because we are not making meaningful lower lows and are still at the highs but price action is neutral since last week so no side has the clear advantage. Weekly close above 22000 would be a surprise to me.
Invalidation is below 21680.
bear case: Bears have to close the gap down to 21680 if they want more downside. Until then they have to fade everything above 21900 since that has been profitable for a week now. A weekly close below 21800 would be a decent sell signal going into next week and a clear break of the wedge. Problem for the bears is the same as for bulls on the other side. On the 4h chart we have big tails above and below bars. Market is completely in balance around 21850ish and therefor I expect a weekly close around that price.
Invalidation is above 22100.
short term: Completely neutral. New high or low would surprise me tomorrow. I expect a choppy session where mean reversion will likely be king.
medium-long term - Update from 2024-05-24: Will update this section more after the coming week but in general the thesis is as for dax. Down over the summer and sideways to up into year end. I don’t think the lows for this year are in.
trade of the day: Longing 21730 because it was support all week and the obvious trade.
NQ Power Range Report with FIB Ext - 6/12/2025 SessionCME_MINI:NQM2025
- PR High: 21894.25
- PR Low: 21827.25
- NZ Spread: 150.0
Key scheduled economic events:
08:30 | Initial Jobless Claims
- PPI
13:00 | 30-Year Bond Auction
Session Open Stats (As of 12:25 AM 6/12)
- Session Open ATR: 376.45
- Volume: 24K
- Open Int: 268K
- Trend Grade: Neutral
- From BA ATH: -3.6% (Rounded)
Key Levels (Rounded - Think of these as ranges)
- Long: 22096
- Mid: 20383
- Short: 19246
Keep in mind this is not speculation or a prediction. Only a report of the Power Range with Fib extensions for target hunting. Do your DD! You determine your risk tolerance. You are fully capable of making your own decisions.
BA: Back Adjusted
BuZ/BeZ: Bull Zone / Bear Zone
NZ: Neutral Zone

Nasdaq Futures: Tariff Talk, Tech Fatigue Turn TideHaving surged more than 20% from the April lows, we could be nearing a turning point for Nasdaq 100 futures.
Bullish momentum is showing signs of shifting lower, while Wednesday’s inverted hammer candle—on a day when tech stocks were given every excuse to rally thanks to the soft U.S. inflation report and subsequent decline in Treasury yields—warns the rally may be running out of steam.
With Donald Trump talking about setting firm tariff rates for individual nations within the next two weeks, we’re already seeing signs of weakness in futures, bolstering the prospect for a three-candle evening star pattern being completed. Sitting in a rising wedge, directional risks seem to be skewing lower.
If the price breaks and closes beneath wedge support, it would create a setup where shorts could be established with a stop above Wednesday’s high to protect against a resumption of the bullish trend.
21436 is a minor support level that screens as an initial target, although 20800—where the price bounced strongly from on May 23—makes for a more appealing case from a risk-reward perspective.
A push and close above 21969—a minor resistance level established earlier this year—would invalidate the bearish bias.
Good luck!
DS
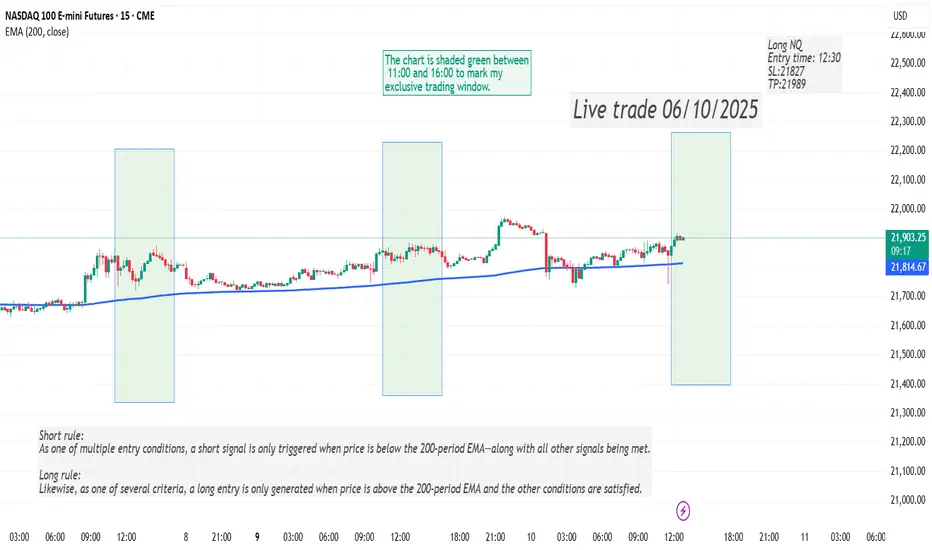
200 EMA Futures Strategy Recap: June 10–11Description:
Market Context:
During my trading window (11:00–17:00 ET), price remained decisively above the 200-period EMA.
Key Rule:
• As one of several entry conditions, the model only goes long when price is above the 200 EMA.
June 10–11 Trades:
NQ Strategy: Two long entries—one on June 10 and one on June 11.
ES Strategy: One short entry on June 11 (all other rules aligned).
Feel free to ask questions or share feedback!


Emini Nasdaq 100. CPI. 11.06.2025, WednesdayExpecting major meltdown on the daily. The triad should melt from here on

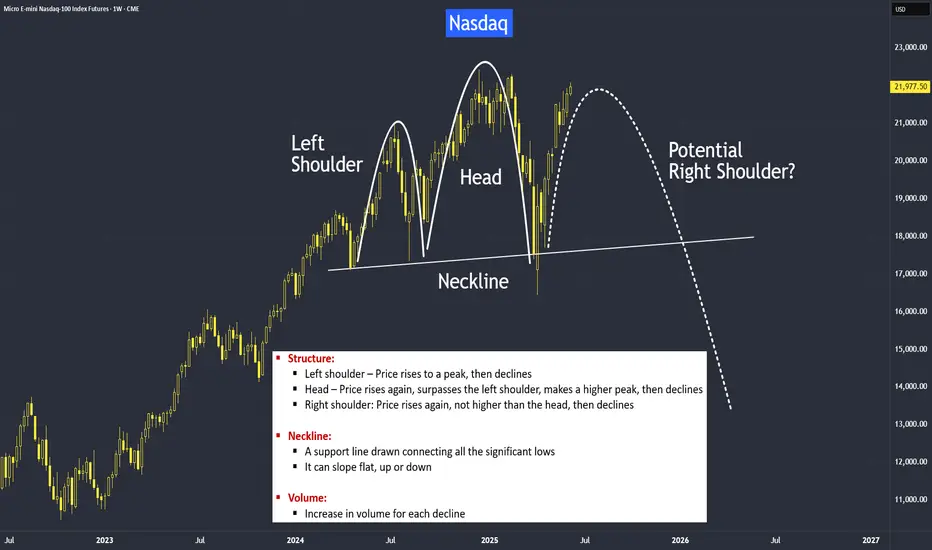
Potential Head and Shoulders PatternHow to identify head and shoulders patterns?
We’ll use the current example from the Nasdaq or the US markets. We can quite clearly observe that a potential head and shoulders formation is developing. This means that if the price breaks below the neckline, we may see a deeper correction from the April low.
I will go through the rules on how to identify a head and shoulders formation.
We will also cover how to recognize when the pattern is invalid — meaning the market may continue pushing above its all-time high.
Finally, we’ll discuss how we can position ourselves early, before waiting for a break below the neckline for confirmation.
Let’s first go through the rules of identifying head and shoulders with rules stated.
Next, how to recognize when the pattern is invalid, the market continues pushing above its all-time high. The key is in the closing price above the all-time high.
Lastly, how we can position ourselves early, before waiting for a break below the neckline for confirmation.
Of course, we can wait for the break to come as a confirmation, but usually I would like to be a little more active than being passive. So this is just for your reference. It may not be for everyone.
This is where I always get into its micro view by first acknowledging where is the macro is, which we had just discussed. Please refer to the following video:
So what do you think that the market likely or unlikely to fulfill this head and shoulders set-up?
I’d like to hear your thoughts on this.
Micro Nikkei Futures
Ticker: MNQ
Minimum fluctuation:
0.25 index points = $0.50
Disclaimer:
• What presented here is not a recommendation, please consult your licensed broker.
• Our mission is to create lateral thinking skills for every investor and trader, knowing when to take a calculated risk with market uncertainty and a bolder risk when opportunity arises.
CME Real-time Market Data help identify trading set-ups in real-time and express my market views. If you have futures in your trading portfolio, you can check out on CME Group data plans available that suit your trading needs tradingview.sweetlogin.com
Trading the Micro: www.cmegroup.com
www.cmegroup.com
Ether Leads Markets HigherThe crypto markets move to the upside continued in today's session, with Ether futures leading the way higher trading up over 8% while Bitcoin rose nearly 1.5%. There has been significant strength from the Crypto markets over the last few weeks, and Ether is now trading right near the 50% retracement mark from the December 2024 high price when looking at a daily chart. Along with Bitcoin and Ether, the Solana market also saw a sharp rise over 5% on the session while XRP saw slight losses.
Outside of the Crypto markets, the Equity Indices traded slightly higher near 0.5% with Tesla leading the Nasdaq higher on the session. This is the third session in a row with a new higher high price for the S&P and could support a strong market at these levels. There have also been continued talks between President Trump and China about tariff policy, and the outcomes could add significant volatility to markets globally when resolved.
If you have futures in your trading portfolio, you can check out on CME Group data plans available that suit your trading needs tradingview.com/cme/
*CME Group futures are not suitable for all investors and involve the risk of loss. Copyright © 2023 CME Group Inc.
**All examples in this report are hypothetical interpretations of situations and are used for explanation purposes only. The views in this report reflect solely those of the author and not necessarily those of CME Group or its affiliated institutions. This report and the information herein should not be considered investment advice or the results of actual market experience.
NQ (Nasdaq) Futures Trading Levels [6/11/25]For Day Traders, here's some trading levels for NQ Futures Trading for today. It's CPI day, so we should get some nice swings today. Trade carefully and trade smart!

Nasdaq Potential Daily ReversalIPDA Speaking + Contract closure we can see speed take place to reach BSL outside IPDA range but why whould the just past 20 days HRLR instead of moving higher with speed
Because of Intermarket striction
maybe to build more stops there but it would be greater in terms of liquidity efficiency to place a fake D high in here and reverse, take the liquidity lower on D HRLR and then continue higher to reach 22,672.00.
The key here is: do we breach above the D SIBI or do we react from it.
one of two will unlock the next 20 to 40 trading days of delivery.
11/6/25 MNQ BREAKDOWNNew dealing range marked and price touched deep OTE and iFVG , I got 2 confirmations (one stone two bird) and price heading toward BSL 22,002... But I expect a move retracement at NY open and heads towards the BSL
NQ Power Range Report with FIB Ext - 6/11/2025 SessionCME_MINI:NQM2025
- PR High: 21983.75
- PR Low: 21937.00
- NZ Spread: 104.75
Key scheduled economic events:
08:30 | CPI (Core|YoY|MoM)
10:30 | Crude Oil Inventories
13:00 | 10-Year Note Auction
Session Open Stats (As of 12:25 AM 6/11)
- Session Open ATR: 380.78
- Volume: 24K
- Open Int: 272K
- Trend Grade: Neutral
- From BA ATH: -3.4% (Rounded)
Key Levels (Rounded - Think of these as ranges)
- Long: 22096
- Mid: 20383
- Short: 19246
Keep in mind this is not speculation or a prediction. Only a report of the Power Range with Fib extensions for target hunting. Do your DD! You determine your risk tolerance. You are fully capable of making your own decisions.
BA: Back Adjusted
BuZ/BeZ: Bull Zone / Bear Zone
NZ: Neutral Zone
Live Paper Trading Using my own strategy. I was playing a break of a downtrend with OB at certain levels, I waited for a confirmation to get into the trade.
I let the trade play out to long i could have taken profits around the $110 mark, I wanted to see how far i could ride it until it reversed on me. I need to learn how to scale out as well i could have scaled out 4 out of my 8 contracts and rid the other 4. Im taking this learning expiernce by taking profits sooner rather than letting the chop take my gains away. I would say i had a great entry maybe 30 seconds to soon but i caught a 5 minute move. I need to take note that if Im going to scalp just make it a 3-5 minute play.

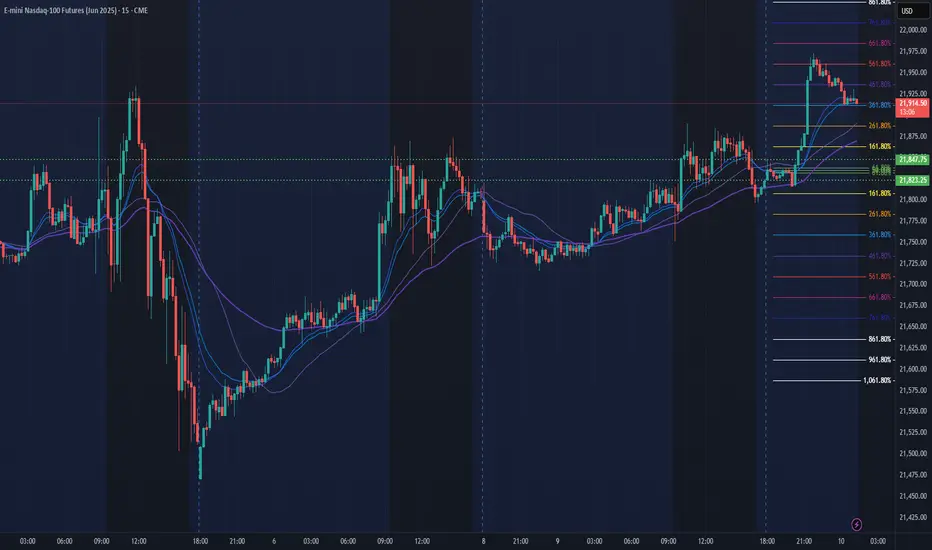
2025-06-10 - priceactiontds - daily update - nasdaqGood Evening and I hope you are well.
comment: Range is 21500 - 22000 for a week now. Neutral but selling new highs and buying every pullback has been profitable for quite a while now. It will end some day but likely not today. Bulls finally want the 22000 print and after so many tries they still could not print it. It’s painful to watch. Fading the extremes was good for a month now and I have no bigger opinion on where we might close this week. Anything below 21700 would be a huge bear surprise and could mean the bull wedge break to the downside and next target would be 21500.
current market cycle: trading range
key levels: 21500 - 22000
bull case: Bulls expect 22000 and buy every pullback. Their problem is, that they have tried so so many times now and could still not print it. How many more times will they try? The wedge will break eventually and I highly doubt it will be to the upside. Bulls can not hold long at the highs since pullbacks are 130-500 points big. Look for longs on decent pullbacks once bears give up. Multiple times below 21800 today. When we print 22000, what are the odds of this going higher for 22500 or new ath above 22688? No idea but looking at the wedge and the structure since April, longing momentum makes sense but that’s it.
Invalidation is below 21390.
bear case: Just imagine cpi comes in hot… Bears can only dream. They are doing fine selling new highs and scalping for 100+ points. They are too weak to print lower lows, so don’t bet on them. Once we go below 21700 again, we can look for better targets and market is likely neutral again. Until then, try not to get trapped.
Invalidation is above 22100.
short term: Likely bearish around 21950-22000 for another pullback into 21750/21800. Still expecting 22k to get hit tomorrow. Rough guess: If we move strongly above 22080ish, we could see an acceleration upwards due to short covering from hell but don’t bet on it. Only go with the momentum if it happens.
medium-long term - Update from 2024-05-24: Will update this section more after the coming week but in general the thesis is as for dax. Down over the summer and sideways to up into year end. I don’t think the lows for this year are in.
trade of the day: Longing 21800 was good so many times since Friday.
Live trade 06/10/2025Here is what one of my strategy traded today. I have 5 trading strategies in NQ and ES.
Today's trade was made based on the NQ DVD strategy where I look at the cumulative daily volume, an indicator that I developed. The Cumulative daily volume is calculated based on the direction of each candle and it resets on daily basis. For more info, please see my channel.
For this specific trade, the both TP and SL are calculated based on a coefficient of ATR. If none of them are met, then I close the trade by 16PM EST.
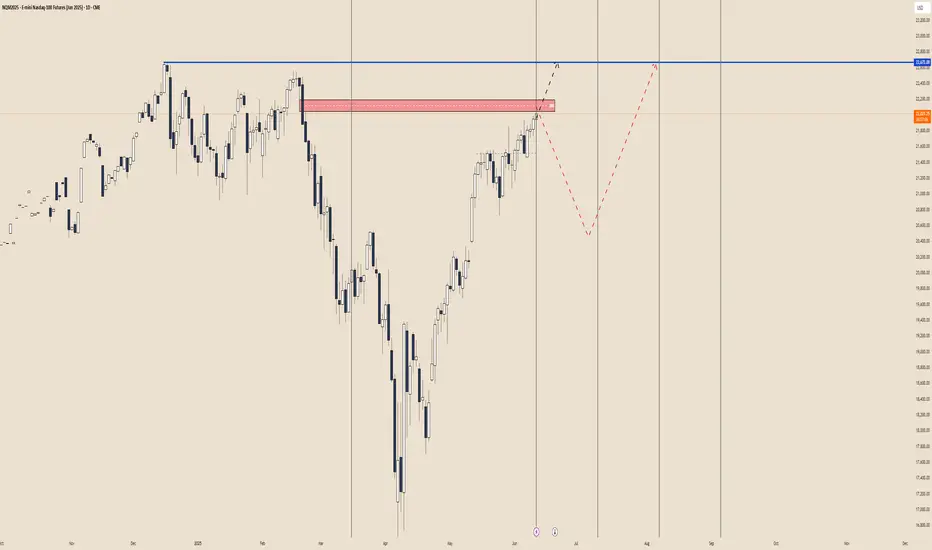
Nasdaq Bearish 4hNasdaq Bearish after the failure in continuation through Previous Weekly High and the rejection afterwards.
Setting the Target to 21,471.00 Swing Low and using 21,716.00 as Low Easy Hanging Fruit (LEHF) objective that We may even reach today despite the small range day expectation (pre-CPI)

$NQ things to watch for There are a few trendlines to keep an eye on possible formation of an H&S pattern inside a rising wedge. Hope this helps

NQ Power Range Report with FIB Ext - 6/10/2025 SessionCME_MINI:NQM2025
- PR High: 21847.75
- PR Low: 21823.25
- NZ Spread: 55.0
No key scheduled economic events
Session Open Stats (As of 12:25 AM 6/10)
- Session Open ATR: 393.42
- Volume: 27K
- Open Int: 269K
- Trend Grade: Neutral
- From BA ATH: -3.2% (Rounded)
Key Levels (Rounded - Think of these as ranges)
- Long: 22096
- Mid: 20383
- Short: 19246
Keep in mind this is not speculation or a prediction. Only a report of the Power Range with Fib extensions for target hunting. Do your DD! You determine your risk tolerance. You are fully capable of making your own decisions.
BA: Back Adjusted
BuZ/BeZ: Bull Zone / Bear Zone
NZ: Neutral Zone
Will NASDAQ Continue Its Bullish Momentum Next Week?
- Current Price: 21761.79
- Key Insights: NASDAQ continues to exhibit robust bullish sentiment, driven by
technology sector strength. Investors should watch resistance at 22,385 and
key support near 21,414 for directional cues. While upside pressures remain,
risks of a short-term pullback could materialize if overbought conditions
persist.
- Price Targets:
- Target 1 (T1): 22,275
- Target 2 (T2): 22,385
- Stop Level 1 (S1): 21,600
- Stop Level 2 (S2): 21,414
- Recent Performance: The NASDAQ has shown resilience, maintaining its upward
trajectory amid potential headwinds such as weaker momentum signals and
geopolitical trade developments. Technology stocks, specifically
semiconductor firms, have powered market gains, buoyed by optimism in the
sector's outlook.
- Expert Analysis: Analysts agree on the likelihood of continued upside provided
key resistance levels are cleared. However, caution surrounds potential
reversals due to overbought technical conditions. A pullback might occur
within the next 3–6 weeks, reinforcing the importance of monitoring
divergence signals.
- News Impact: Optimistic US-China trade comments and semiconductor growth have
supported the rally. Broadcom's recent earnings could temper enthusiasm,
serving as a potential inflection point for the index's short-term
trajectory.
