2025-05-20 - priceactiontds - daily update - nasdaq
Good Evening and I hope you are well.
comment: Bears get nothing going. Everything is bought. Do not look for shorts unless you can scalp really well. We have room for 1 more day of chop but ultimately I think we will print 22000, like sp500 wants the 6000+. Bull channel is valid until broken, so look for longs.
current market cycle: trading range
key levels: 21000 - 22000
bull case: Bulls want a new ath and we are high enough, that they could easily get it. As long as we stay above 21200, the bull channel is alive and well and we are making higher highs and higher lows. Don’t need to write more for bulls because they have all the arguments on their side.
Invalidation is below 20100.
bear case: Bears can only join the chat again, once we have a daily close below 21000. This channel upwards is tight. Do not look for shorts.
Invalidation is above 21200ish but real confirmation is only below 21000.
short term: Neutral for another day but when the breakout happens, obviously bullish for 22000 and maybe some more. We have room for one more chop day.
medium-long term - Update from 2024-04-20: My most bearish target for 2025 was 17500ish, given in my year-end special. We are +18% from the lows and I do think, once this turns again, it will easily be the short trade of the year.
trade of the day: Buy low, sell high and scalp. 21400 - 21460 was the main range and both sides made money today. Only real bad trade was shorting below 21400 or buying the Globex high.
NDAQ100U2025 trade ideas
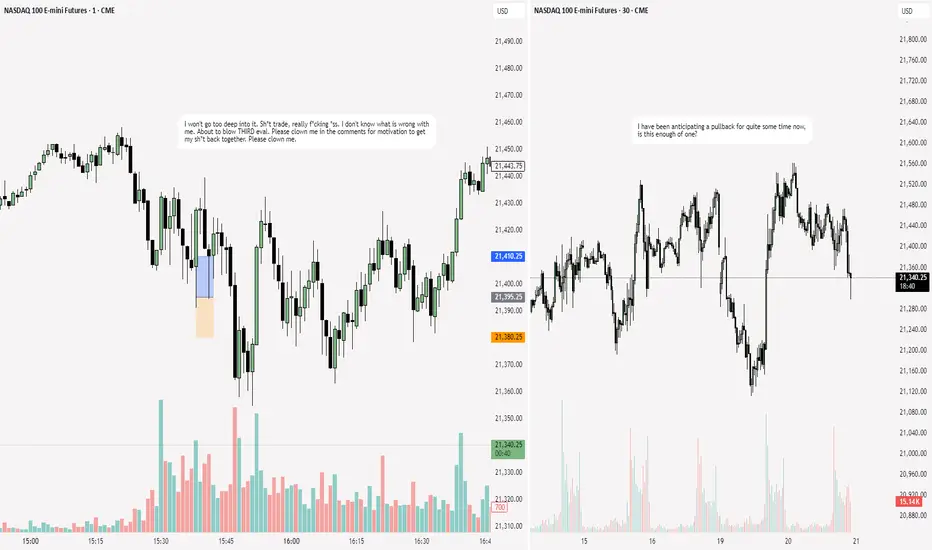
NQ: 194th trading session - recapPlease roast me. Just clown me. It isn't even a good trade on a really really good day, I don't know what was going on in my mind.
PLEASE CLOWN ME. WRITE ANYTHING
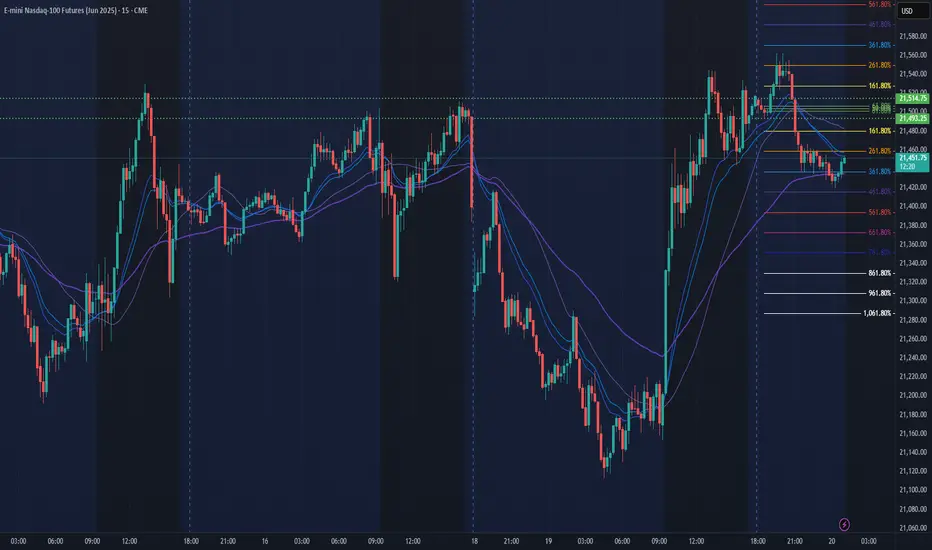
NASDAQ 100 E-mini Futures - Short-Term Counter-Trend OpportunityAnalysis:
Looking at the NASDAQ 100 E-mini Futures (NQ1!) on the 15-minute chart, we seem to be presenting an interesting setup for a potential counter-trend short, even as our long-term conviction remains firmly bullish.
Long-Term Bullish Thesis:
From a broader perspective, the price action clearly shows a series of "BOS" (Break of Structure) to the upside, indicating sustained bullish momentum. Recent price action, particularly the push through previous resistance levels, reinforces the underlying strength of the market. Our long-term bias is to look for opportunities to go long on dips, aligning with the overall uptrend.
Short-Term Counter-Trend Setup (The Bearish Argument):
However, in the immediate term, we've observed a "MBS" (Market Structure Break) to the downside following a "BOS" to the upside that ran into significant resistance. This indicates a potential short-term shift in momentum. The price has re-entered a previously established demand zone, and the recent rejection from the area marked with the red box and the subsequent downward movement (black candlestick) suggests sellers are stepping in.
Potential Short Entry & Targets:
A counter-trend short opportunity could materialize if the price continues to show weakness from the current levels. The primary target for such a move would be the liquidity below the recent swing low, marked with the '$' symbol, potentially extending towards the 21,200 - 21,150 area (green box). This would be a move to capitalize on the expected short-term pullback.
Invalidation:
This counter-trend short idea would be invalidated if the price decisively breaks above the recent high (the orange dashed line) and sustains above the upper red box, indicating a renewed push to the upside and a continuation of the bullish trend without a significant pullback.
Conclusion:
This setup allows us to potentially capture a short-term bearish move against the prevailing bullish trend. It's crucial to manage risk effectively given this is a counter-trend play. Once this short-term correction plays out, we will be eagerly looking for signs of bullish continuation from lower levels to re-enter long positions, aligning with our overarching bullish long-term view.

MNQ 5.20.25 Trade Management (3)Execution, Risk management and Profit taking shown live in the next 3 posts I am about to share with you guys.
I wanted to use that 4H 10am Low as an entry and we caught it. Now we are watching to see if that was just a manipulation to trade into that bearish FVG I outlined near that Buyside liquidity area we were targetting.
Closing the day out with $110 in profits, Which you will see on Video #3

MNQ 5.20.25 Trade Idea (2)Execution, Risk management and Profit taking shown live in the next 3 posts I am about to share with you guys.
I wanted to use that 4H 10am Low as an entry and we caught it. Now we are watching to see if that was just a manipulation to trade into that bearish FVG I outlined near that Buyside liquidity area we were targetting.
Closing the day out with $110 in profits, Which you will see on Video #3

MNQ 5.20.25 Trade Idea (1)Execution, Risk management and Profit taking shown live in the next 3 posts I am about to share with you guys.
I wanted to use that 4H 10am Low as an entry and we caught it. Now we are watching to see if that was just a manipulation to trade into that bearish FVG I outlined near that Buyside liquidity area we were targetting.
Closing the day out with $110 in profits, Which you will see on Video #3

NQ Power Range Report with FIB Ext - 5/20/2025 SessionCME_MINI:NQM2025
- PR High: 21515.00
- PR Low: 21493.00
- NZ Spread: 49.0
No key scheduled economic events
Return to previous week's highs following full supply sweep session
Session Open Stats (As of 12:45 AM 5/20)
- Session Open ATR: 479.66
- Volume: 34K
- Open Int: 281K
- Trend Grade: Neutral
- From BA ATH: -5.4% (Rounded)
Key Levels (Rounded - Think of these as ranges)
- Long: 22096
- Mid: 20383
- Short: 19246
Keep in mind this is not speculation or a prediction. Only a report of the Power Range with Fib extensions for target hunting. Do your DD! You determine your risk tolerance. You are fully capable of making your own decisions.
BA: Back Adjusted
BuZ/BeZ: Bull Zone / Bear Zone
NZ: Neutral Zone
2025.05.20 nasdaq analysisDuring the European session, NASDAQ maintained a downward trend and broke below the 21187 level, as shown here:
This movement suggested a potential shift toward a bearish direction.
However, after that, NASDAQ started forming an upward trend and moved sideways. Eventually, the resistance trendline was broken in the blue box area, which you can see here:
This breakout indicated a short-term trend reversal.
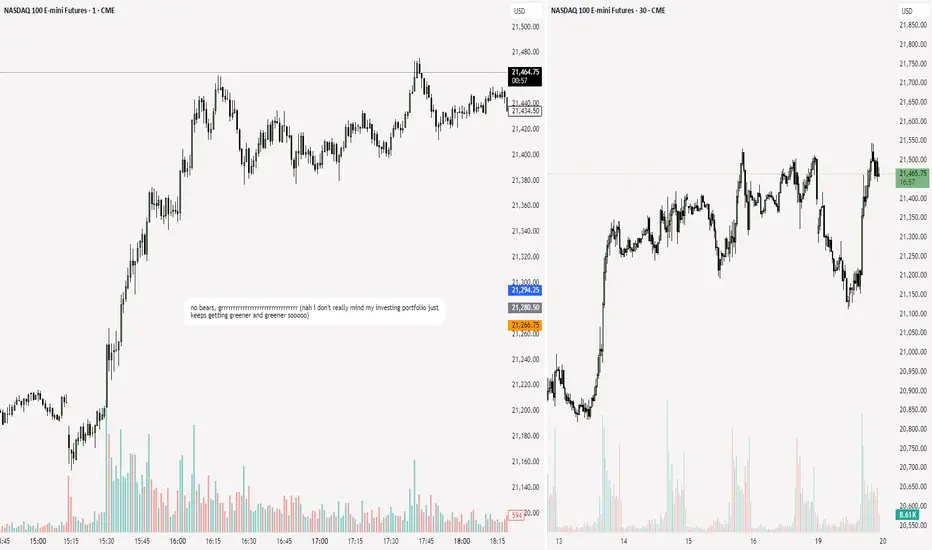
The moment this trend reversal occurred coincided with the U.S. market open, accompanied by a significant surge in trading volume that led to a strong upward move.
At this point, the U.S. session closed with a new high compared to the previous pattern, suggesting that the trend has turned bullish.
However, based on the corrective action seen during the Asian session, it seems that the Asian market is not fully accepting the upward momentum.
Here is the current NASDAQ pattern:
It shows an expanding pennant pattern, with both the highs and lows widening over time.
As of now, it is highly likely that the market will continue to move with volatility in both directions until a decisive breakout occurs.
You can view the current situation in more detail here:
In terms of the upside, even though the price could theoretically reach 22000, it doesn’t hold much significance without confirmation from historical data.
Therefore, I recommend taking buy positions only if the market shows a strong inflection point similar to yesterday’s move.
Even if the recent low of 21112 is broken, the price is still within the expanding pennant pattern, and a rebound remains possible.
A conservative bearish view would only be valid if the price breaks below the previous consolidation area that formed just before the strong rally—specifically the black box range, which is around 20723–20680.
Summary:
There’s a high probability of stop-hunting in the current range.
Whether buying or selling, it's recommended to enter only when a clear setup is provided.
Don’t rely on hope that the price will return to your average entry. If the market chooses a direction during this phase, it could lead to unrecoverable losses.
This could be a highly profitable zone if handled correctly, but trading without conviction is like a drug.
Today is not the only opportunity.

Buyers returnedAfter settling off at the beginning of the session on Monday the buyers returned to rally the market to a new high. The expectation is the upward momentum will carry through to the Tuesday session.

(NQ) | Strong Buyers and Blue‑Box Entry Zones(NQ) | Strong Buyers and Blue‑Box Entry Zones
NQ shows powerful buying pressure, and the marked blue boxes highlight areas where demand has reliably appeared. For those seeking long exposure, two approaches stand out:
Low‑Time‑Frame Breakouts from the Blue Box
Wait for price to dip into a blue‑boxed support zone and then break higher on shorter time frames. A decisive move with rising footprint volume confirms genuine buyer commitment.
Direct Low‑Time‑Frame Breakouts
If price skips a pullback and powers upward on low‑time‑frame charts, that momentum surge—backed by substantial volume—also provides a valid long entry.
Key Considerations
Ensure any breakout is backed by real volume footprint signals, not just price movement.
If these zones fail to hold or volume dries up, stand aside and await the next confirmed setup.
By focusing on these blue‑boxed areas and insisting on volume‑confirmed breakouts, you align your entries with where buyers truly dominate.
📌I keep my charts clean and simple because I believe clarity leads to better decisions.
📌My approach is built on years of experience and a solid track record. I don’t claim to know it all but I’m confident in my ability to spot high-probability setups.
📌If you would like to learn how to use the heatmap, cumulative volume delta and volume footprint techniques that I use below to determine very accurate demand regions, you can send me a private message. I help anyone who wants it completely free of charge.
🔑I have a long list of my proven technique below:
🎯 ZENUSDT.P: Patience & Profitability | %230 Reaction from the Sniper Entry
🐶 DOGEUSDT.P: Next Move
🎨 RENDERUSDT.P: Opportunity of the Month
💎 ETHUSDT.P: Where to Retrace
🟢 BNBUSDT.P: Potential Surge
📊 BTC Dominance: Reaction Zone
🌊 WAVESUSDT.P: Demand Zone Potential
🟣 UNIUSDT.P: Long-Term Trade
🔵 XRPUSDT.P: Entry Zones
🔗 LINKUSDT.P: Follow The River
📈 BTCUSDT.P: Two Key Demand Zones
🟩 POLUSDT: Bullish Momentum
🌟 PENDLEUSDT.P: Where Opportunity Meets Precision
🔥 BTCUSDT.P: Liquidation of Highly Leveraged Longs
🌊 SOLUSDT.P: SOL's Dip - Your Opportunity
🐸 1000PEPEUSDT.P: Prime Bounce Zone Unlocked
🚀 ETHUSDT.P: Set to Explode - Don't Miss This Game Changer
🤖 IQUSDT: Smart Plan
⚡️ PONDUSDT: A Trade Not Taken Is Better Than a Losing One
💼 STMXUSDT: 2 Buying Areas
🐢 TURBOUSDT: Buy Zones and Buyer Presence
🌍 ICPUSDT.P: Massive Upside Potential | Check the Trade Update For Seeing Results
🟠 IDEXUSDT: Spot Buy Area | %26 Profit if You Trade with MSB
📌 USUALUSDT: Buyers Are Active + %70 Profit in Total
🌟 FORTHUSDT: Sniper Entry +%26 Reaction
🐳 QKCUSDT: Sniper Entry +%57 Reaction
📊 BTC.D: Retest of Key Area Highly Likely
📊 XNOUSDT %80 Reaction with a Simple Blue Box!
📊 BELUSDT Amazing %120 Reaction!
📊 Simple Red Box, Extraordinary Results
I stopped adding to the list because it's kinda tiring to add 5-10 charts in every move but you can check my profile and see that it goes on..

NQ: 193rd trading session - recapIt is unfortunate I will say that. But every great trader needs to patient, or so I heard. The conditions aren't right rn, but they will be. I just <3 bears.
Precision Target Hit—Now, a Critical Retest! What’s Next? Market Recap The price accelerated aggressively, smashing through the target (TP) with pinpoint accuracy. Now, a critical pullback is unfolding—will it set up the next big move or signal a shift in momentum?
What to Watch for Now: Bullish Continuation?
If price stabilizes above a key support zone, it could attract new buyers, fueling another leg higher.
Look for volume confirmation—strong buying activity after the pullback would signal renewed momentum.
Reversal Risk?
A deeper pullback or weakness near key levels could indicate profit-taking or trend exhaustion.
Watch for lower highs—if the price struggles to reclaim previous strength, a shift in market sentiment could be underway.
Key Levels & Strategy Insights Retest Zone: Is this pullback a healthy correction or a sign of sellers stepping in? 📉 Liquidity Areas: Where smart money might enter or exit positions. 📈 Momentum Signals : To gauge strength or weakness in the trend.
Why This Setup Matters:
Helps traders recognize high-probability trade opportunities based on price action and sentiment.
Gives an edge in catching the next major move instead of reacting late.
Adds value by showing how professional traders interpret pullbacks and continuation setups.
🔥 Follow for More Sharp, Real-Time Market Insights! 🔥
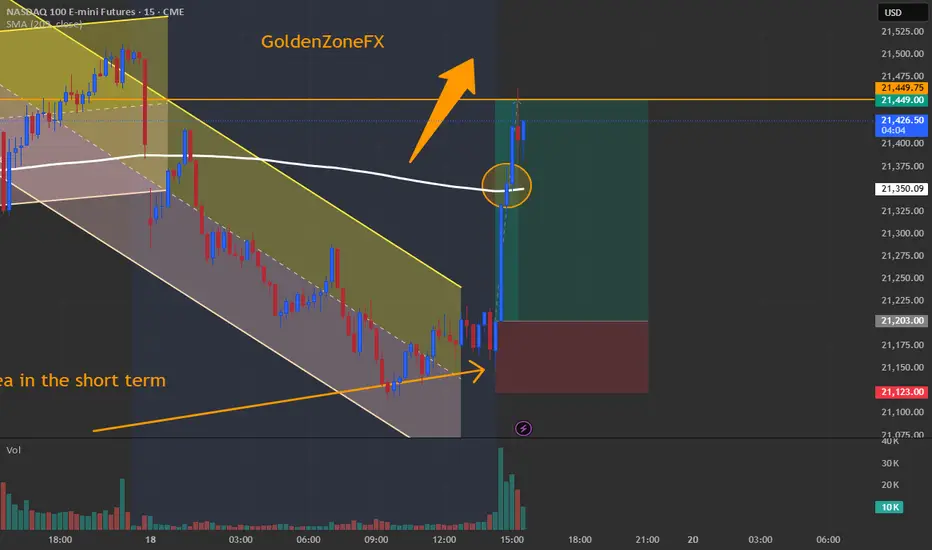
NASDAQ 100 – Breakout from Oversold Zone | Belkhayate + VWAP RetExecuted a strong long entry on NASDAQ 100 E-mini Futures following a high-probability confluence setup:
- Oversold confirmation via Belkhayate Cycle in deep green territory
- Falling channel breakout, reclaiming structure
- Bullish volume spike on the breakout candle
- Price pushing toward the Belkhayate Trend filter (hma + 209 MA)
- VWAP reclaim — if price pulls back and holds above VWAP, it could confirm bullish trend continuation .
📈 This is a classic reversal-into-breakout scenario with potential for momentum continuation if VWAP serves as intraday support.
📊 Trade Plan:
✅ Entry: Breakout candle close above descending channel
Stop Loss: Below last swing low (21,123)
Target: 21,449 zone (prior structure / resistance)
💡 Strategy Highlights:
Confluence trade using:
-Belkhayate Cycle (timing)
- Price Action + Volume (structure)
- VWAP (intraday trend bias)
- Belkhayate Trend (macro flow)
Watching for a retest of VWAP – a clean bounce there could trigger adds or re-entries for trend continuation.

Nasdaq Futures - Another 7000 pts move pending?Reposting the last one with the same levels.
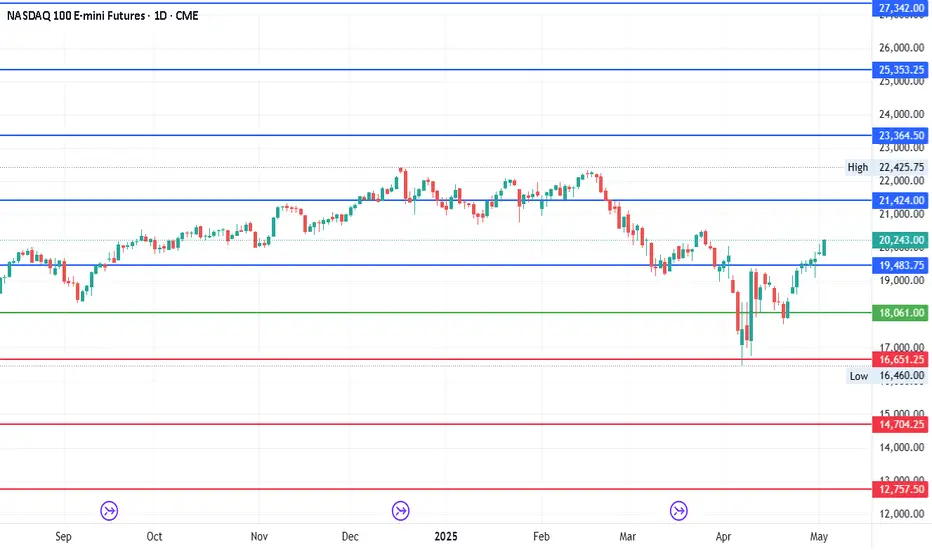
Just moved around 700 pts.. The chart says that we can still expect another 7000 points swing? which direction?
Levels as per the last post:
Current Price: 19544 (25th April)
Today's Price: 20230
Mid-Point: 18060.88
Upside: 21424.03, 23364.38, 25353.19 and 27342.00
Downside: 14704.35, 12757.38, 10768.56 and 8779.7
#NQ1!
NQ Power Range Report with FIB Ext - 5/19/2025 SessionCME_MINI:NQM2025
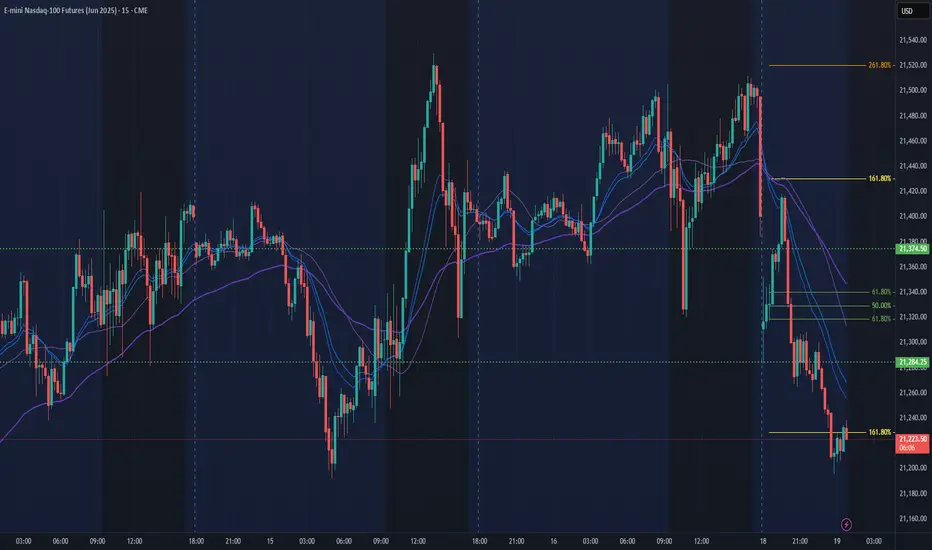
- PR High: 21374.75
- PR Low: 21283.75
- NZ Spread: 203.25
No key scheduled economic events
Beginning anticipated rotation, holding at Thursday's lows
- Daily gap remains below 20400 ahead of Keltner average cloud
Session Open Stats (As of 12:25 AM 5/19)
- Session Open ATR: 490.62
- Volume: 54K
- Open Int: 283K
- Trend Grade: Neutral
- From BA ATH: -6.3% (Rounded)
Key Levels (Rounded - Think of these as ranges)
- Long: 22096
- Mid: 20383
- Short: 19246
Keep in mind this is not speculation or a prediction. Only a report of the Power Range with Fib extensions for target hunting. Do your DD! You determine your risk tolerance. You are fully capable of making your own decisions.
BA: Back Adjusted
BuZ/BeZ: Bull Zone / Bear Zone
NZ: Neutral Zone
NQ Bull trap?Is this possibly a bull trap?
CME_MINI:NQ1! has reached the first weekly price imbalance created during the downward rebalancing. This is also dangerous territory.
There was a slight pull back Friday afternoon right before the closing bell but we wont know for certain until Monday mornings opening Bell.
I am still curious to see the opening on Sunday.
Things to note or we have been pushing higher without any considerable pullback on the higher time frame let’s take a look ….
Daily Chart
Intra Day Chart
NQ price visibly consolidating right above the Weekly imbalance low. The exit from this consolidation will tell us a lot, until then I wil remain cash or reduce risk dramatically until direction is evident.

2025.05.19 nasdaq analysis🟧
At the close of Friday's session, the daily and weekly candle closed around 21500.
However, in the final hour after market close, Nasdaq broke below the orange trendline.
Then, at the start of Monday’s session, a sharp gap down occurred.
The gap was briefly filled before Nasdaq retested the broken trendline and continued to fall.
🔗
🕒
Nasdaq hasn't confirmed a downtrend yet.
The key is whether 21187, which has held since May 13th, will break.
If it fails, price may fall below the value area it’s held for a week.
Downside targets if 21187 breaks: 21000, 20765.
🔗
🟩
Bullish scenario isn’t dead—this may be a temporary pullback.
Key entry signal: Break above the 15-min 20 EMA.
Target zones vary by strength:
Conservative TP: 30-min 20 EMA
Aggressive TP: 21415, possibly even 21500 if today’s high is broken
🔗
📌 Conclusion
Monday started with a gap down, but support is still holding.
Break below 21187 = potential trend reversal + end of box-range movement.
Buy trades should be cautious & short-term until confirmation of strength.

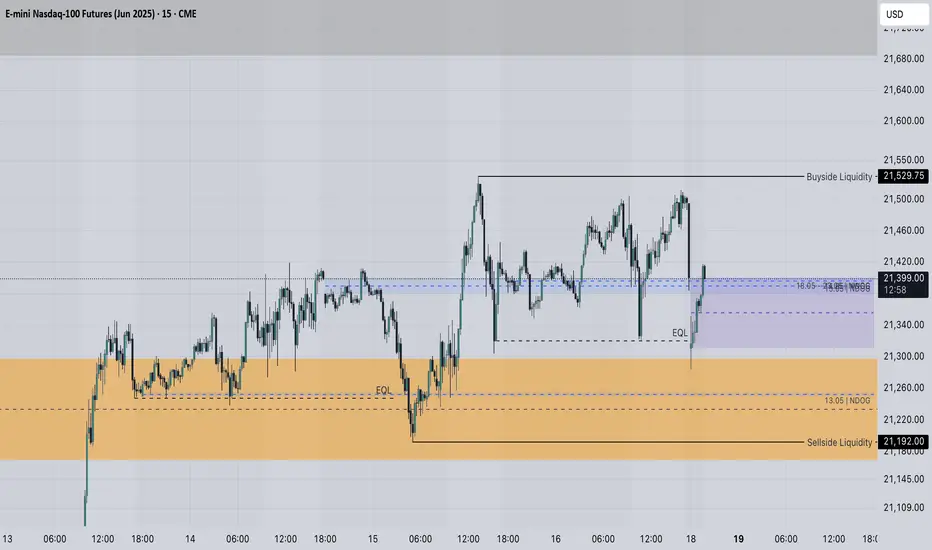
NQ localI think we have done enough work on the current levels as mentioned in the previous daily analysis, we opened today(on sunday) disrupting the relative equal lows which could be used for accumulation of the buy orders.
If so then we would not need to reach out for the sellside marked in the lower part of the current daily ifvg, and we would probably look for higher prices and buyside delivery, in case we break out lower part of the daily ifvg I think we can have the lower prices, where it will balance through the previously left imbalances in the range
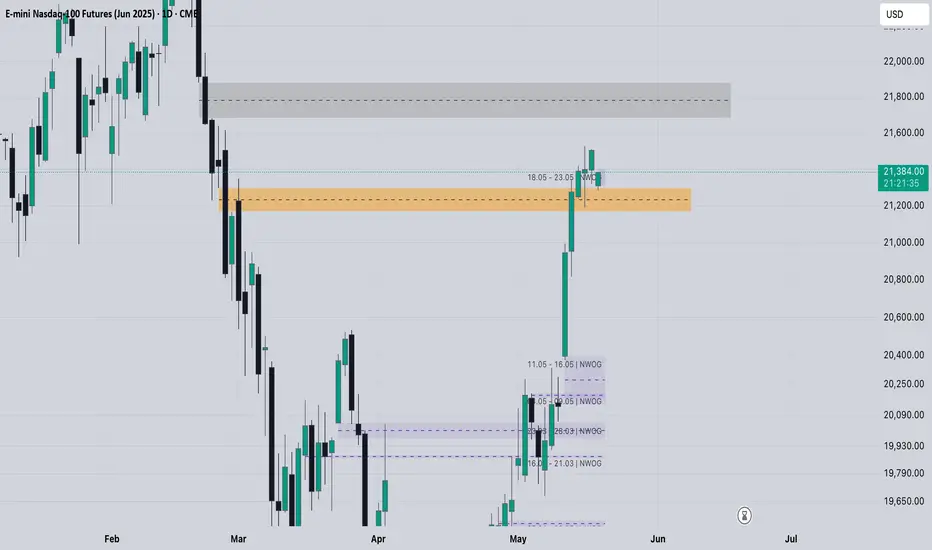
NQ 1DI think we are going into the daily fvg which is situated above, I would rather see the support from the ifvg which we broke through and leave the sellside in there just as we left, meaning the work is done on the current levels if we are bullish will target this fvg first and then buyside above
weekly forcast on NQI am expecting th weekly candle of NQ to be bearish for this week, i see that we are targetting lower prices especially the daily imbalance

NQ BullishPrice Action: The chart shows the price movement of NQ over a period of time (likely intraday, given the time labels on the x-axis).
Key Levels: There are horizontal lines and rectangular zones drawn on the chart. These likely represent:
Support (S): A price level where buying pressure is expected to be strong enough to prevent further decline.
Resistance (R) or Buyside Liquidity (BuS): Price levels where selling pressure is expected to be strong enough to prevent further price increases. The label "BuS" suggests an area where traders have buy stop orders placed, creating potential liquidity to be taken out.
Sellside Liquidity (SeS or $$$
):∗∗Areasbelowsupportwheretraderslikelyhavesellstopordersplaced.Thesecanactasmagnetsforprice.∗∗∗OrderBlock(OB−POI):∗∗Aspecificpricerangewhereasignificantamountofbuyingorsellingoccurred,oftenseenasapotentialareaoffuturesupportorresistance."POI"likelystandsforPointofInterest.∗∗∗PotentialTradeIdea:∗∗There
′
saprojectedpricepath(theredandgreenlines)suggestingapotentialshorttrade.∗∗∗Entry:∗∗Theshortentryseemstobeplannednearthe21,400level,possiblyafteramoveuptotakeoutsomeofthebuysideliquidity(BuS).∗∗∗Target(TP):∗∗Thegreenareaindicatesthepotentialprofittarget,locatedbelowthesellsideliquidity(
$
)andneartheOrderBlock(OB−POI).∗∗∗StopLoss(SL):∗∗Theredareaabovetheentrypointrepresentsthestop−losslevel,designedtolimitlossesifthetradegoesagainsttheanticipateddirection.∗∗∗"Ata":∗∗Thislabelispositionedneartheprojectedpricepath.It
′
spossiblethisreferstoaspecifictradingconceptorthenameofthetrader
′
sstrategy.Withoutfurthercontext,it
′
shardtosaydefinitively.∗∗Insummary,thechartillustratesapotentialshorttradingsetupbasedon:∗∗1.∗∗Anticipatingamovetotakeoutbuysideliquidity(BuS).∗∗2.∗∗Enteringshortafterthispotentialmove.∗∗3.∗∗Targetingsellsideliquidity(
$$$) and an Order Block (OB - POI) as areas of support.
Having a defined stop-loss level to manage risk.
It's important to remember that this is just a visual representation of a potential trade idea. The actual outcome will depend on market conditions and whether the price action unfolds as anticipated. Traders using such setups would typically look for additional confirmation signals before entering a trade.

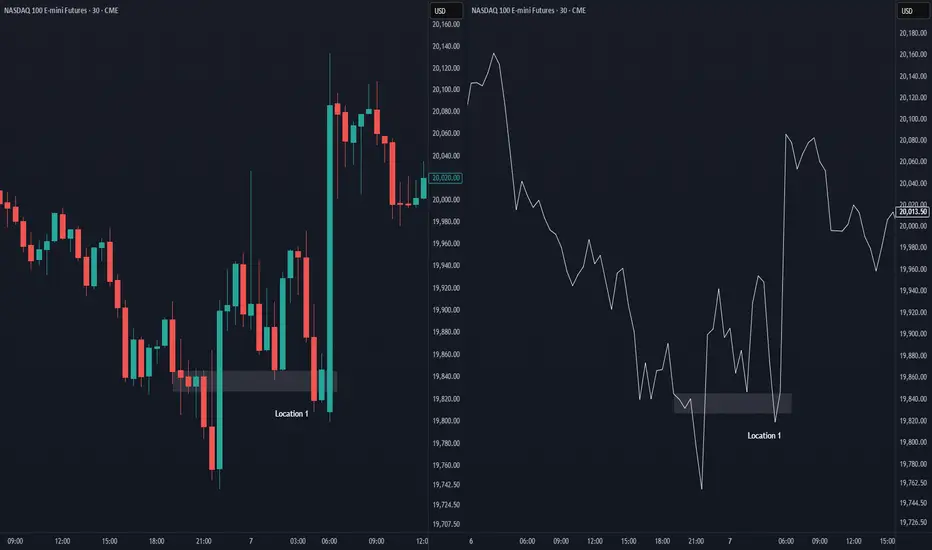
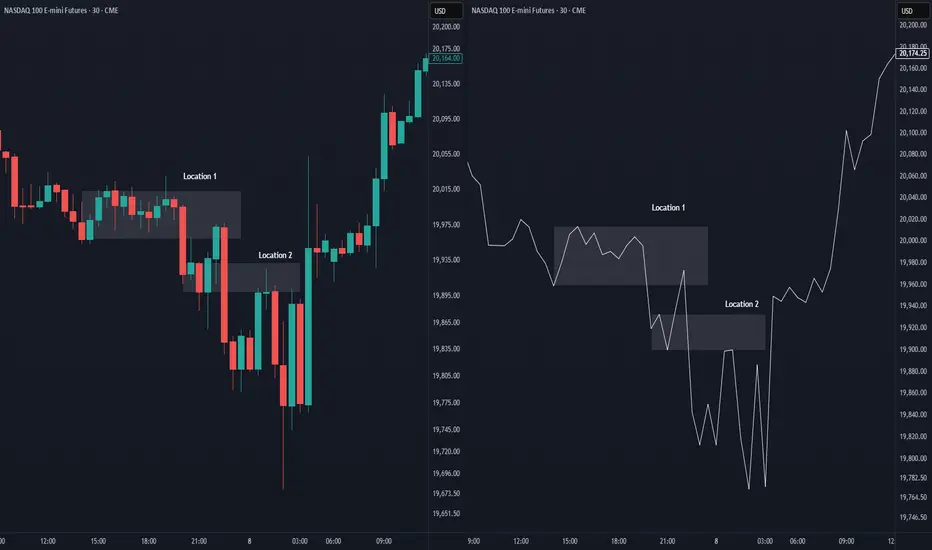
Location 30m NY Session 7 May 2025There are 2 setups based on a 30 minute structure on 7th May 2025.
Location 1 :
- Trend sell
- Structure breakout sell
Location 2 :
- Trend sell
- Structure breakout sell
Location 30m London Session 6 May 2025There is only 1 setup based on a 30 minute structure on 6th May 2025.
Location 1 :
- Trend buy
- Structure breakout buy