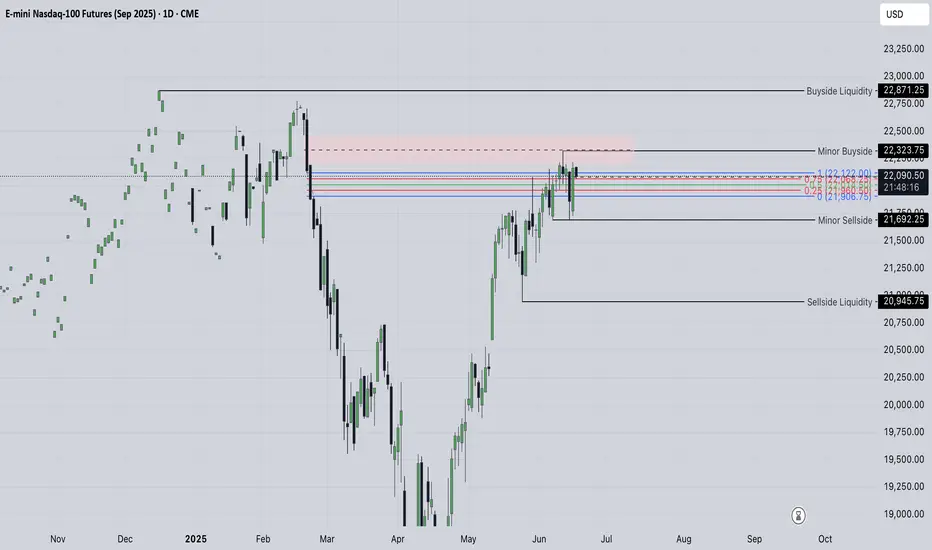
Trade Idea: Nasdaq Q2 Premium Rejection | Mother of HTFNQ is showing early signs of macro exhaustion after rallying deep into Q2 premium territory and failing to hold above it. A key swing high was formed on June 13, in perfect confluence with:
🔻 Q2 0.75 level
🟥 Quarterly Premium Zone
📉 Bond market divergence (ZB1! failed to confirm ZF1!/ZN1! strength)
🗣️ (Not a bond expert, just observing behavior)
This type of confluence has historically preceded liquidity draws back to EQ or even discount levels.
📐 Levels I’m Watching
Q1 Mid (~20,975): Strong magnet if we break lower
Q2 EQ (~19,975): Next likely draw if structure shifts
MOOD (~21,460): Holding above this pauses deeper sell bias
Q2 Premium Zone (22,300–22,500): Rejection zone and CPI swing high (June 11-13)
Discount Block (18,300–17,500): Long-term liquidity void if momentum builds
❌ Invalidation
NQ reclaims and holds above 22,300–22,500
⚠️ Disclaimer
This is NOT financial advice. All content shared is speculative and intended for educational or entertainment purposes only. Futures trading carries significant risk and may not be suitable for all investors. Always do your own research and consult with a licensed financial professional before making trading decisions.
NDAQ100U2025 trade ideas


NQ: 206th trading session - recapOk session, hopes were high at the beginning but it was a bit short lived.
Don't got much to say tho, til tomorrow
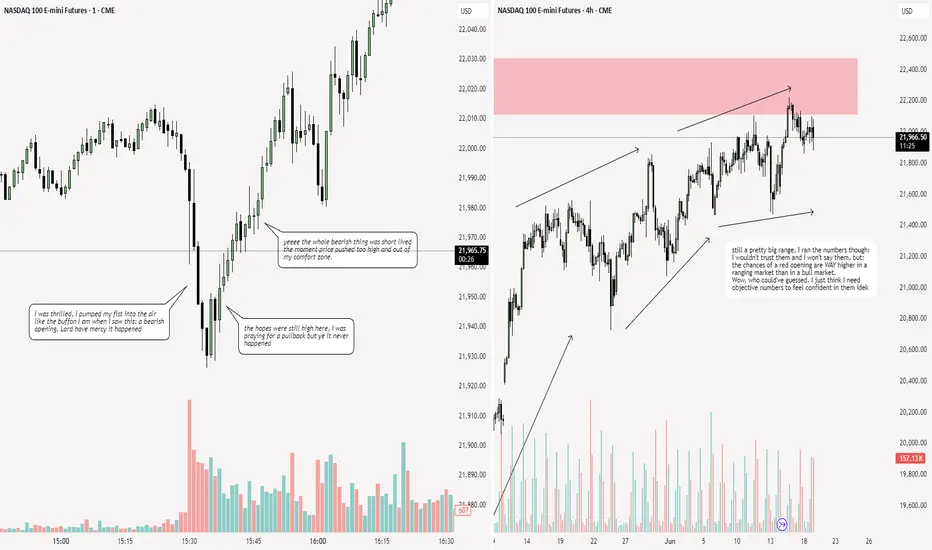
NAS/NQ 4H Buy IdeaLooking for price to break and retest the current high to continue higher
OR
Looking for price to go back and fill the imbalance left below current price to then continue higher
NQ1 wait in the zone for long*The content on this analysis is subject to change at any time without notice, and is provided for the sole purpose of assisting traders to make independent investment decisions.
NQ Power Range Report with FIB Ext - 6/18/2025 SessionCME_MINI:NQU2025
- PR High: 21940.50
- PR Low: 21863.00
- NZ Spread: 173.50
Key scheduled economic events:
08:30 | Initial Jobless Claims
10:30 | Crude Oil Inventories
14:00 | FOMC Economic Projections
- FOMC Statement
- Fed Interest Rate Decision
14:30 | FOMC Press Conference
AMP margins increase to 25% for expected FOMC volatility spike
Session Open Stats (As of 12:45 AM 6/18)
- Session Open ATR: 375.35
- Volume: 31K
- Open Int: 213K
- Trend Grade: Neutral
- From BA ATH: -3.8% (Rounded)
Key Levels (Rounded - Think of these as ranges)
- Long: 22096
- Mid: 20383
- Short: 19246
Keep in mind this is not speculation or a prediction. Only a report of the Power Range with Fib extensions for target hunting. Do your DD! You determine your risk tolerance. You are fully capable of making your own decisions.
BA: Back Adjusted
BuZ/BeZ: Bull Zone / Bear Zone
NZ: Neutral Zone

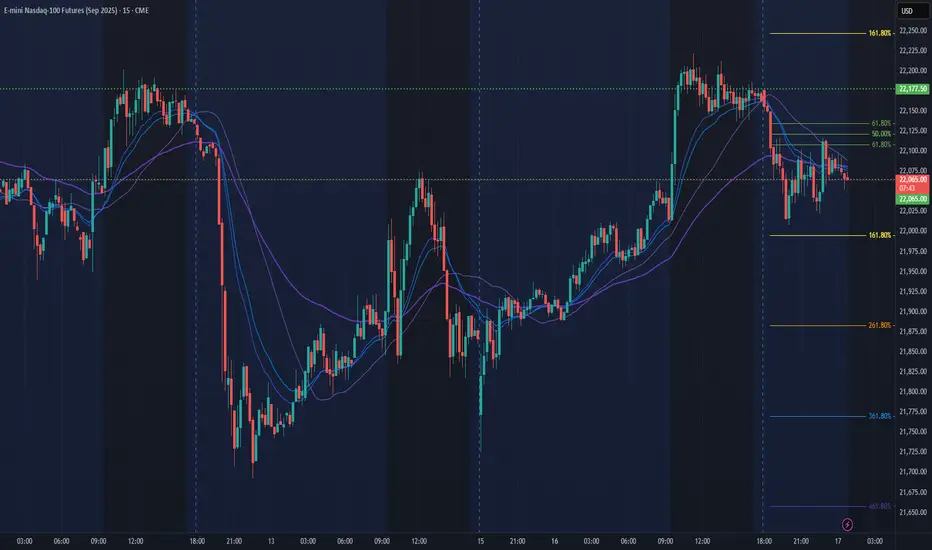
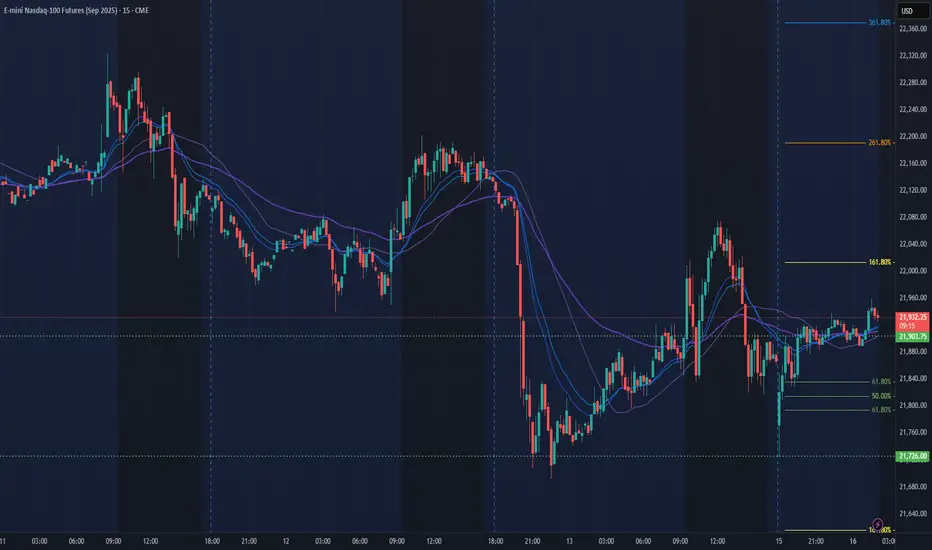
NQ Bulls Teasing a Breakout – But Watch That 4H RSI Divergence We’re at a decision point here on NQ.
📌 Bullish case: We’ve got a clean inverse H&S on the 5-min sitting right on the weekly pivot. If we reclaim the daily pivot and the 30-min VWAP (red line), we could get a squeeze toward 21,960, where prior supply sits.
📉 Bearish case: A break below 21,650 cracks the head and confirms downside toward 21,480.
⚠️ Don’t ignore that 4H RSI divergence. Momentum is fading. If buyers want this, they’ve got to show up now.
📊 Timeframes used:
4H: macro momentum divergence
30M: chop zone with directional potential
5M: inverse H&S near key support
1M: low timeframe momentum shift
🔭 Scenarios plotted for both directions. Choose your trigger.
#nasdaq #futures #MNQ #tradingstrategy #priceaction #headandshoulders #vwap

2025-06-17 - priceactiontds - daily update - nasdaq
Good Evening and I hope you are well.
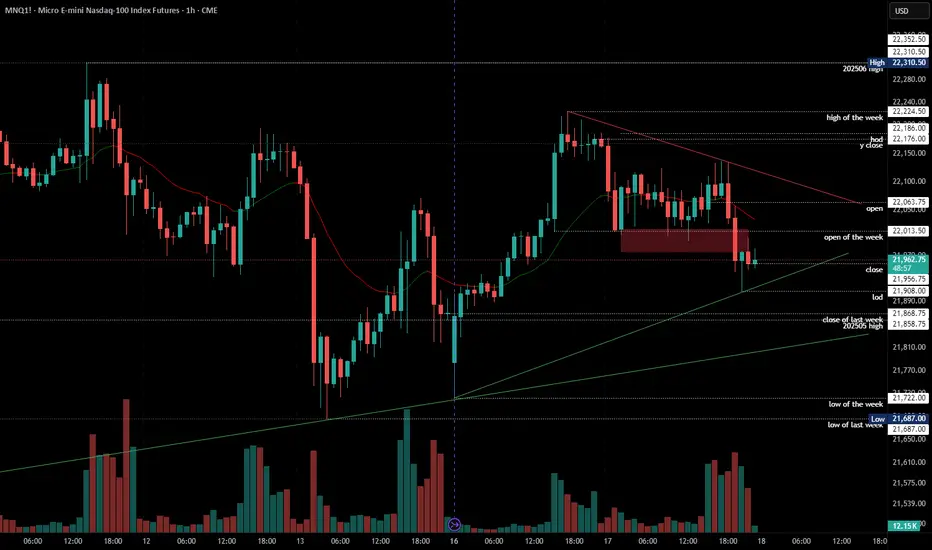
comment: Big up, big down, big confusion. Market rallies 500 points yesterday and today we get a late bear breakout and close below 22000. Traps on both sides and I am not believing in bear strength what so ever. I see this as a triangle and 22000 is the middle. Chop chop.
current market cycle: trading range
key levels: 21700 - 22300
bull case: Bulls want to stay above 21900 and print a higher low to then re-test 22300. Today they were weak and let the bears close below 22000 which was unexpected, giving yesterday’s bullishness. Tomorrow we have FOMC and I doubt market can move far from 22000 tomorrow. Any longs closer to 21800 make sense.
Invalidation is below 21680.
bear case: Bears left behind a gap up to 22015 but I doubt it can stay open. We have to decent trend lines below us and bears would need to break strongly below 21900 to try and go for 800 or even 700. Bears do not have any arguments to go below 21700 so I won’t make up any. That doesn’t mean it can not happen but it’s unlikely.
Invalidation is above 22230.
short term: Completely neutral around 22000. Only interested in longs below 21900 and shorts closer to 22100.
medium-long term - Update from 2024-06-15: Daily close below 21450 is my validation for the new bear trend which has the first bigger target at 21000 but I think we will printed below 20000 again this year. Structure is obviously not yet bearish, so don’t be early if you want confirmation and can’t/won’t scale in to shorts higher.
trade of the day: Buy low, sell high and scalp. Clear range 22000 - 22100 and the late bear breakout was ok if you made your money before. I do think it was unusual that we did not close the gap to y close 22176.

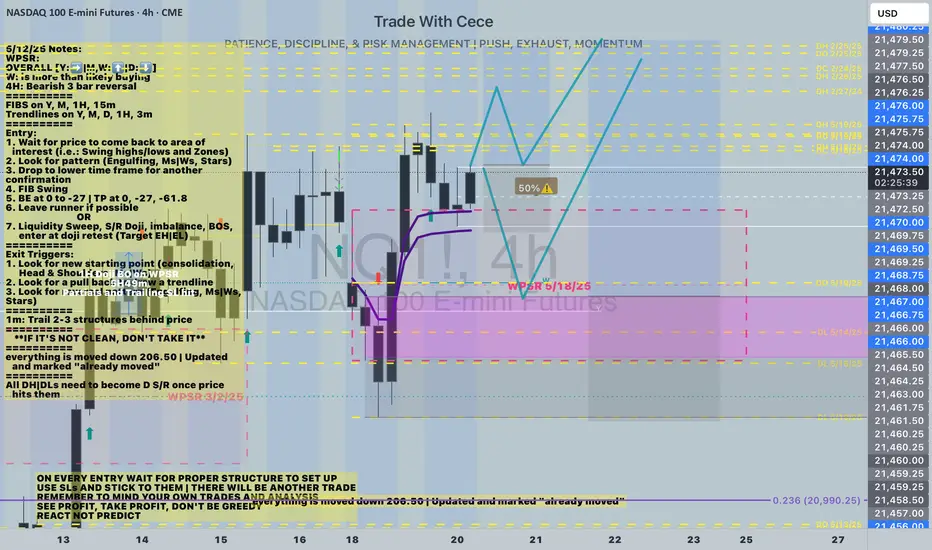
RTH Setup - My potential everyday model.In the video we see my potential everyday model that I will be looking for, for the next 3-6 months.

Nasdaq Seek and Destroy. Play Patience Game.Patience.
both bullish and bearish idea are valid.
We're ahead of FOMC of tomorrow and we might get false movements / remain under range.
better to no try to rationalize the market here but rather let it showcase his will first.
NQ London Silver Bullet Time WIndowTurtle Soup NQ London target Monday Asian Low. Paper Trading. Reversal After Daily FVG H.

Are we about to see historic highs on the markets?Are we about to see historic highs on the markets?
In my previous article, I predicted that the trade war would soon be over and that the markets would resume their growth. This is exactly what is happening. I believe that stocks have bottomed out and I am positioning myself very bullishly ahead of the summer. Investors now have the opportunity to buy quality stocks at lower prices and use appropriate tools to make purchases at the right price. Maintaining calm during periods of market turbulence is of paramount importance.
The stock market always tends to grow in the long term and, thanks to the intervention of central banks and sometimes governments, manages to overcome moments of deep crisis. This was the case during significant events such as the attack on the Twin Towers in 2001, the Lehman Brothers crisis in 2008, and the Covid period in March 2020.
This dynamic is intrinsic to the history of the market itself. If you take a 20- or 30-year view of any major stock index, this trend is visible.
Therefore, although recent market declines may appear volatile or steep, they are not particularly serious in the context of the long-term trend, provided you have the time and ability to remain calm while waiting for the situation to stabilize.
Immagine
These moments can present buying opportunities for high-quality technology stocks that were previously expensive.
Despite the uncertainty, there are select opportunities when considering companies that continue to innovate by reinvesting their profits in research. These companies tend to emerge stronger from periods of crisis, especially if they have little debt and a loyal customer base.
This is particularly relevant for companies developing artificial intelligence and cloud infrastructure, such as Nvidia, Google Alphabet, and Microsoft Corp. Although these companies are not immune to cyclical difficulties, they continue to innovate internally.
Some companies, while not distributing dividends to shareholders, reinvest all their profits in equity and technological research. Now we will examine what, in my opinion, is the best index to invest in for the summer. It is well known that one of the Trump administration's main goals is to weaken the dollar, and this dynamic is indeed underway.
A weakening dollar has significant effects on American companies, with varying consequences depending on the sector and their exposure to global markets.
It is well known that a devaluation of the dollar leads to improved export competitiveness. Companies that sell products abroad benefit from a weaker dollar because their goods become cheaper for foreign customers, increasing demand and profits. This phenomenon favors industries such as technology, aerospace, and agriculture.
Immagine
The indices we will focus on for the summer are the Nasdaq US TECH 100 and the S&P 500, US 500. Technology companies benefit from a weaker dollar thanks to exports. In general, as I often say, large American companies with strong international revenues tend to benefit from a weak dollar, as foreign revenues increase in value when converted into dollars.
It is well known that Nvidia, Microsoft, and Apple shares have a significant influence on this index. A weak dollar can boost the profits of companies that generate a substantial portion of their revenues abroad, such as the companies mentioned above. As a result, the rise in these stocks could lead the indices to reach new all-time highs.
From a technical standpoint, chart analysis supports my purchases on the major US indices. Recent gains are in fact supported by above-average volumes, and prices remain above the 200-period moving average.
In addition, the latest news is positive. As expected, the trade war was short-lived, and the US and Europe have also reached an agreement on 10% tariffs.

NQ Power Range Report with FIB Ext - 6/17/2025 SessionCME_MINI:NQU2025
- PR High: 22177.25
- PR Low: 22065.25
- NZ Spread: 250.25
Key scheduled economic events:
08:30 | Retail Sales (Core|MoM)
Contract rollover week
Session Open Stats (As of 12:45 AM 6/17)
- Session Open ATR: 385.81
- Volume: 47K
- Open Int: 178K
- Trend Grade: Neutral
- From BA ATH: -3.5% (Rounded)
Key Levels (Rounded - Think of these as ranges)
- Long: 22096
- Mid: 20383
- Short: 19246
Keep in mind this is not speculation or a prediction. Only a report of the Power Range with Fib extensions for target hunting. Do your DD! You determine your risk tolerance. You are fully capable of making your own decisions.
BA: Back Adjusted
BuZ/BeZ: Bull Zone / Bear Zone
NZ: Neutral Zone
New Dealing Range in HTFAs I Expect The Po3 in my previous analysis and it perfectly projected after that price retraced with daily volume imbalance and tryin to come down...also I found a new dealing range on 4Hr

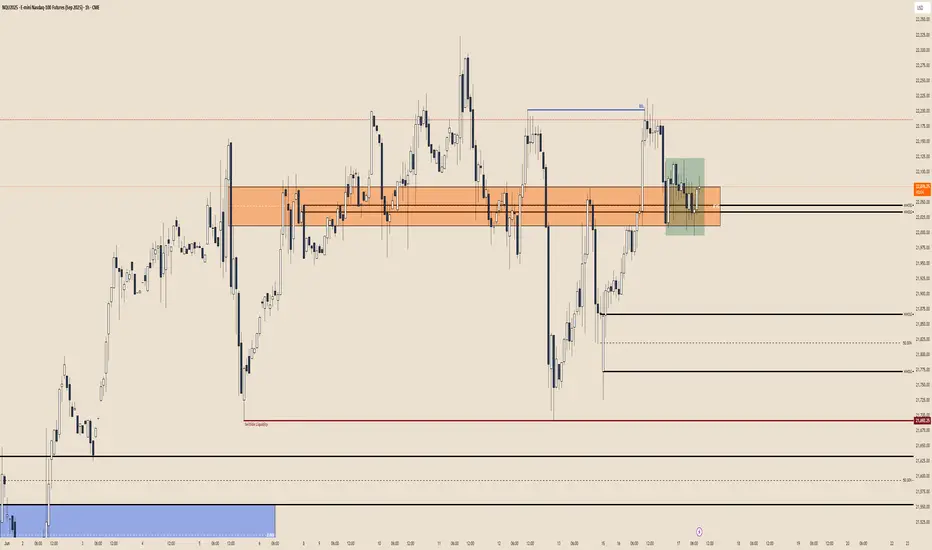
NQ studyI am quite sure the sharp move is coming... which way will it happen we will see, for longer term positions there are no reasonable entries, so once we get a breakout of this distribution or consolidation either way we are likely to see the bigger traders joining along which will accelerate the movement, so far we are looking bullish and ld like to see prices remain above the measured imbalance from 24th of february and its 50 % level, as well as going higher should let us overtake the pink imbalance positioned higher and the minor buyside though we have already received the rejection from that area.
in this case
Looking for sellside delivery first of all I am interested in the minor sellside (20945) as we have formed the equal lows down there, breaking this level will likely put us in shorts for a period of time receiving so called correction to the upward movement we had.
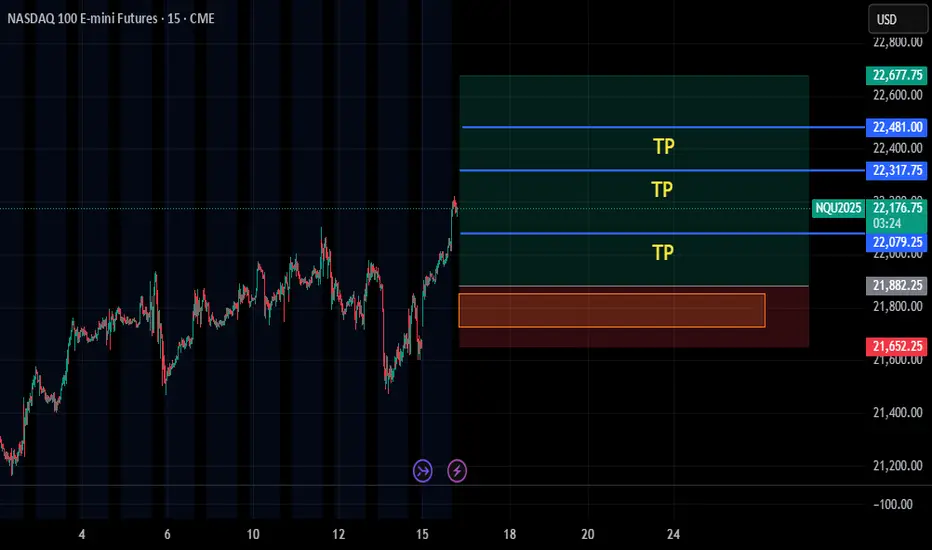
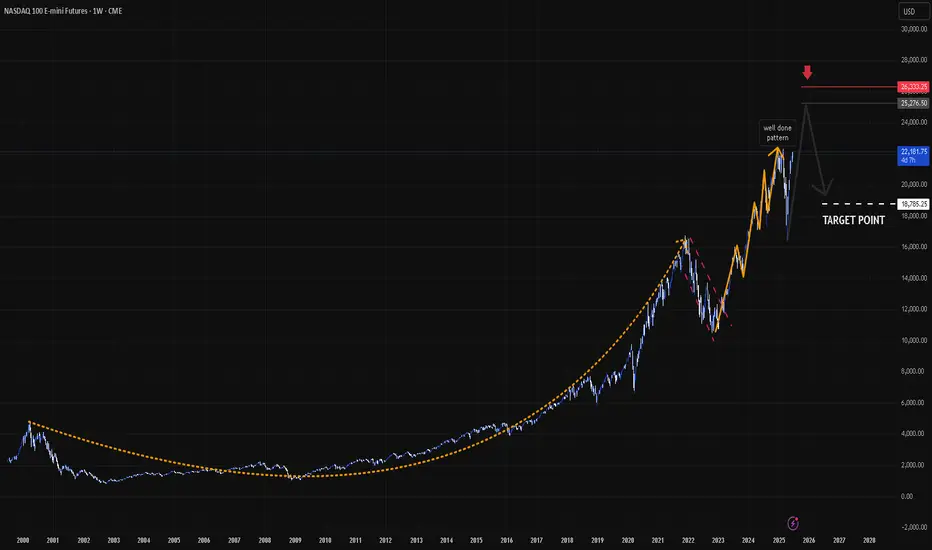
E-mini Nasdaq-100 Trading Setup for sellers ^)We have completed cup and handle pattern here...
So after the price is still high!
We may see some price gain additional, something like 13-18% .
So we have two option here for the sellers, wait and sell from marked point 1 or 2 .
P.S. This is very long time range position. ( Something like 200-800 day ).
Have a profit in your day!
Thanks.
6.16.25 Weekly LevelsES Expected Range: 5993.16 - 6169.64
ES Skew: +.86% 6123.19
NQ Expected Range: 21,692.92 - 22,463.12
NQ Skew: +1.06% 22,258.40

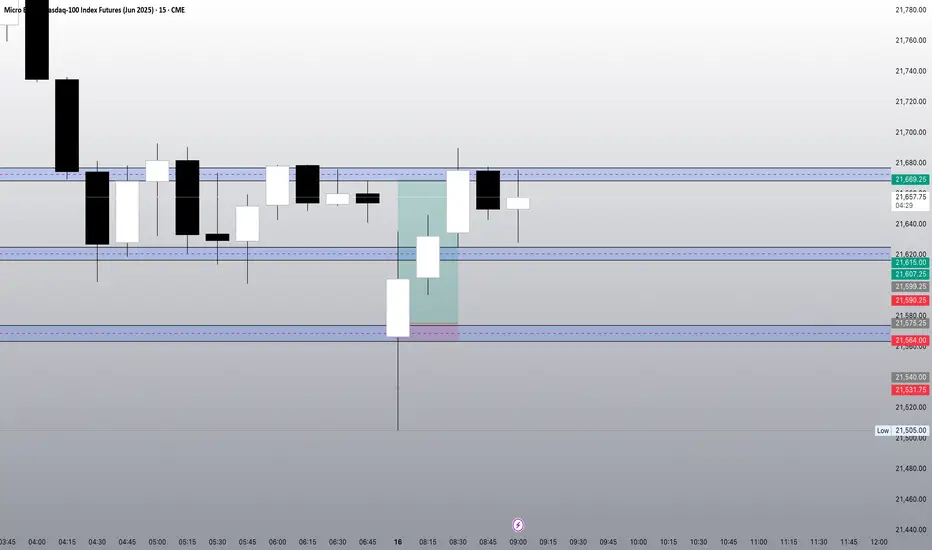
Po3I See a Perfect Accumlation, Manipulation,Distribution On The MNQ Chart After The Sweep of a LOW at 21,471...... LET SEE ON NY OPEN..

NQ Power Range Report with FIB Ext - 6/16/2025 SessionCME_MINI:NQU2025
- PR High: 21903.75
- PR Low: 21726.00
- NZ Spread: 396.75
No key scheduled economic events
Contract rollover week
Session Open Stats (As of 12:15 AM 6/16)
- Session Open ATR: 382.14
- Volume: 18K
- Open Int: 62K
- Trend Grade: Neutral
- From BA ATH: -4.1% (Rounded)
Key Levels (Rounded - Think of these as ranges)
- Long: 22096
- Mid: 20383
- Short: 19246
Keep in mind this is not speculation or a prediction. Only a report of the Power Range with Fib extensions for target hunting. Do your DD! You determine your risk tolerance. You are fully capable of making your own decisions.
BA: Back Adjusted
BuZ/BeZ: Bull Zone / Bear Zone
NZ: Neutral Zone
NQ Analysis for the past weekNasdaq has been volatile in the last week and the price didnt decisively break the ATH and tested it. Further with the evolving geo political scenario lets see what happen in the coming week.

NQ trades with 350+ ticks in profit for longCaught a solid long setup on NQ during the Asia open session, following clean price action and key demand zone confirmation. Two take-profits were hit, and one position closed at break-even — locking in 350+ ticks overall.
Patience and precision paid off today. Zones marked in advance using my custom supply/demand indicator.
#NQ #NasdaqFutures #FuturesTrading #SupplyAndDemand #DayTrading #MicroFutures #PriceAction #TradingViewIdeas #AsiaSession
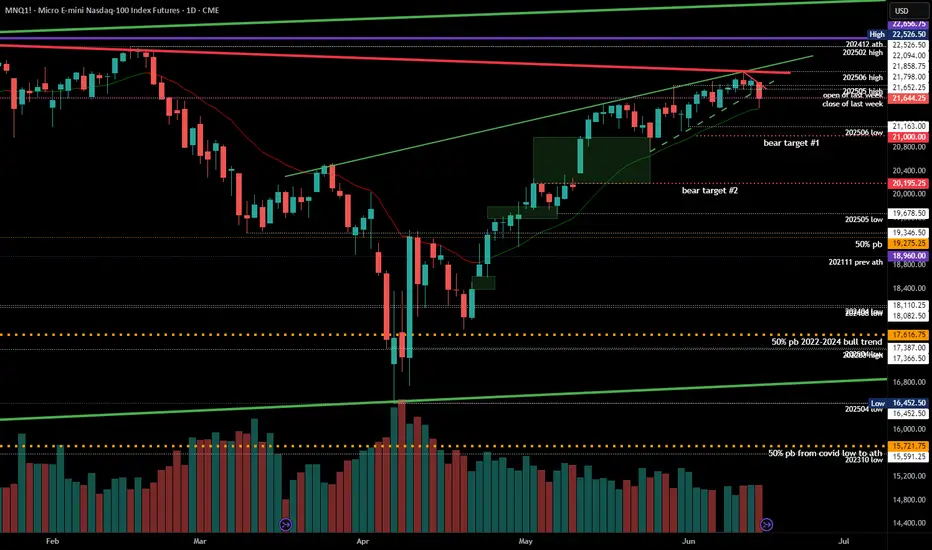
#202524 - priceactiontds - weekly update - nasdaq e-mini futuresGood Day and I hope you are well.
comment: I do think we will continue to print lower highs from 22094. Very clear invalidation price for that thesis is a print above 21855. 21000 is my target for the next days/weeks. A strong daily bear close below the daily 20ema around 21450 would be my confirmation. Above 21855 we continue to chop sideways and could retest 22094.
current market cycle: trading range most likely for now until we have a daily close below 20ema
key levels for next week: 21450 - 21855 (below 21450 - next target is 21000 and above 21855 next target is 22000)
bull case: Bulls outdid themselves by almost completely reversing the strong sell-off on Friday. That certainly was unexpected but now is decision time. Can they keep the market above 21500 a second time? If so, most bears will likely be quick to give up again and we can continue sideways 21500 - 22100 or even higher. Since we did not close below the daily ema, bulls remain in control.
Invalidation is below 21450
bear case: Bears see the bull wedge as broken and want to trade down from here. The top we have formed is a credible double top with ath 22656 and good for swing shorts. Bulls have been given two amazing macro numbers last week, especially the cpi print and we could not break strongly above. Instead we got a spike and it crumbled afterwards. Those are the type of things that don’t happen in bull trends.
Invalidation is above 21855
short term: Neutral for now and I wait for the breakout to either side. I want to favor the bears but they were so weak after the Globex sell spike on Friday, it’s not wise to hope they suddenly become strong.
medium-long term - Update from 2024-06-15: Daily close below 21450 is my validation for the new bear trend which has the first bigger target at 21000 but I think we will printed below 20000 again this year. Structure is obviously not yet bearish, so don’t be early if you want confirmation and can’t/won’t scale in to shorts higher.