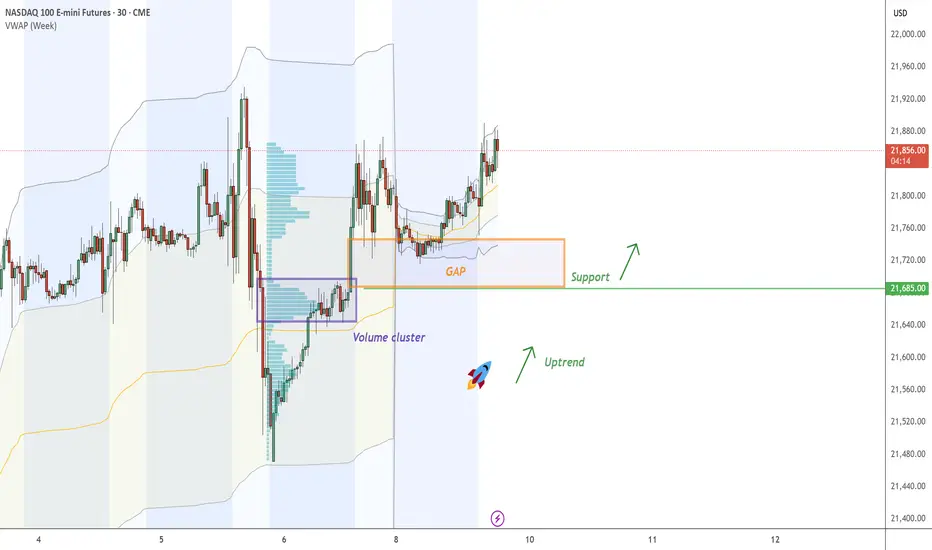
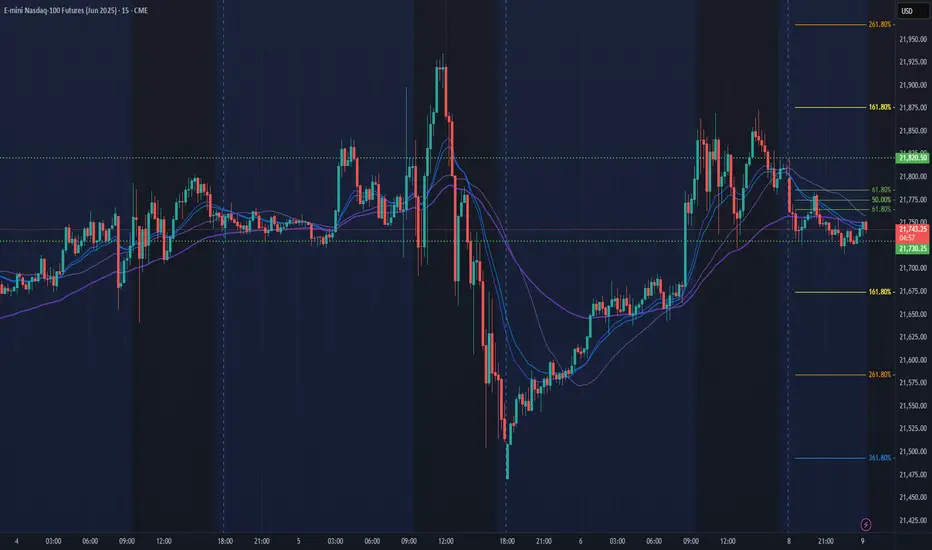
NQ - (FVG) - Fair Value GAPOn NQ , it's nice to see a strong buying reaction at the price of 21685 .
There's a significant accumulation of contracts in this area, indicating strong buyer interest. I believe that buyers who entered at this level will defend their long positions. If the price returns to this area, strong buyers will likely push the market up again.
(FVG) - Fair Value GAP and high volume cluster are the main reasons for my decision to go long on this trade.
Happy trading
Dale
NDAQ100U2025 trade ideas
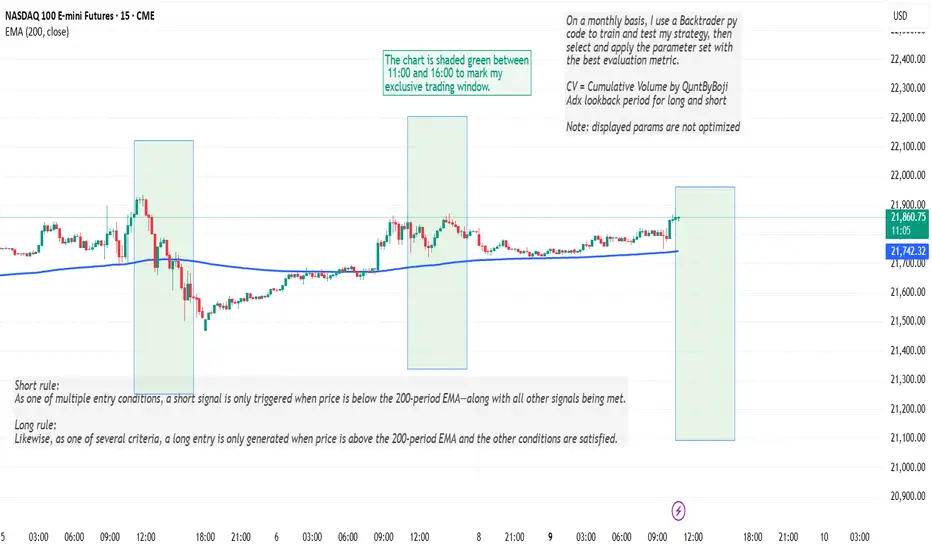
Intro to my python-tradingview strategyAfter three years working on multiple trading strategies, I decided to share my experience and my trades. But before going live, I think I need to explain the roadmap I’ve followed so far.
I initially started coding my strategy in PineScript, which is a powerful tool. It allowed me to simply code my ideas and turn them into trading signals using alerts and conditions. I’m sure you’ve already watched dozens of YouTube videos on how to use webhooks and TradingView to send signals to your trading platform. Anyway, I began developing my strategy in Pine and used webhooks to connect to Tradovate. I went live after a few months of testing—which, of course, was my first mistake. In January 2022, my algo went live. I traded on a strategy that was just tuned on seen data, manually flipping parameters to maximize PnL—a purely overfit model—and I went live with real money. Anyway, the first month was positive and I thought I was the best trader in the world. I even told my wife we were going to be rich, like nothing could stop us. But after three months of trading, I lost—obviously. It was a bummer, but I knew where the problem was: lack of proper backtesting.
So that was the moment I moved my code to Python. It took me a couple of weeks to build an end-to-end backtesting framework in Python. I used Backtrader as a backtesting tool, which is awesome. I’ll have some videos soon to explain more about that. Anyway, moving my code to Python gave me the luxury of backtesting and creating rolling walk-forward optimizations, allowing me not only to refine my strategies but also to test them on 5–6 years of historical data.
Long story short, working with Python enabled me to come up with five different strategies for NQ and ES. I plan to share those trades, but before that, I thought I should share my journey first.
Please leave comments and follow my channel. More to come.
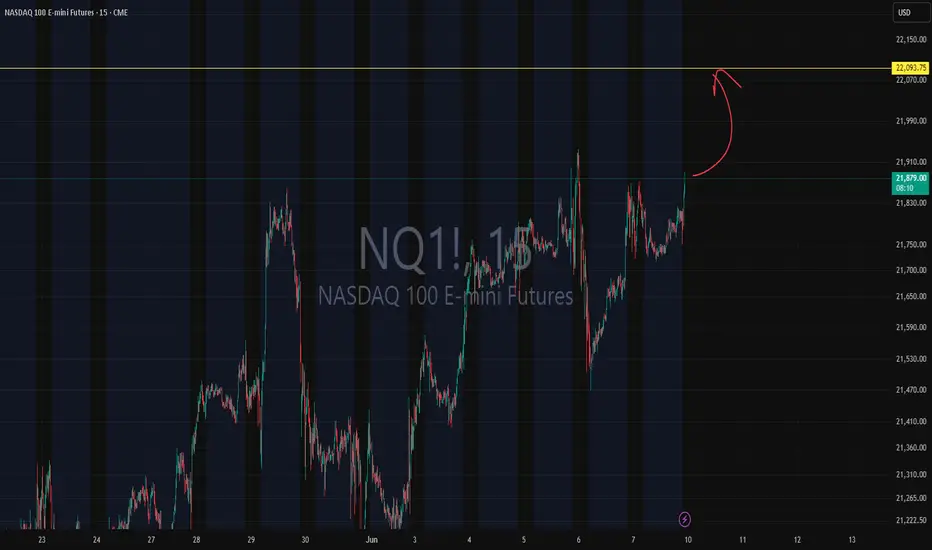
NQ1! ATH or what???NQ1! ATH or what?
optimism coming back or no? Chyna CHyna CHyna? or no CHyna? let us know~~
we caught april bottom now run ATH?
🐉We value full transparency. All wins and fails fully publicized, zero edit, zero delete, zero fakes.🐉
🐉Check out our socials for some nice insights.🐉
information created and published doesn't constitute investment advice!
NOT financial advice
ES/NQ 6.9.25 Weekly Range + Expected CloseES Weekly Range: 5941.78 - 6117.31
ES Weekly Expected Close: 6073.08 +.91% Skew
NQ Weekly Range: 21,483.56 - 22,265.57
NQ Weekly Expected Close: 22,048.41 +1.04% Skew

Long ideaDaily: We rejected from a Daily FVG (Daily TF) and found support with little to no pullback from the monthly trend, displaying the strong uptrend.
Today we still have bearish resistance off that reaction but bias is obviously bullish both short and long term facing mid trend, explaining why i'm expecting to long this area against the mid trend.

NQM June 9 Breakout in Play| Momentum Building Toward 22000📝 Description:
📅 Date: 09 June 2025
📊 Instrument: NQM2025 (Micro Nasdaq Futures)
NQM has successfully broken above the critical 21700 level, confirming a bullish breakout from the earlier consolidation zone (21605–21675).
This move has unlocked a fresh momentum zone — supported by strong bullish candles and higher timeframe RSI strength.
🔥 Active Bullish Outlook:
📌 Breakout Level: 21700 ✅
📈 Next Targets:
1)🎯 21850
2)🎯 22000
Above 22000
🛑 Temporary Pause Expected: 21980 – 22080
→ Market may range or pull back slightly in this zone
💥 Post-Pause Momentum: Targeting up to 22200
🔍 What to Monitor:
A clean breakout above 22000 may stretch up to 22020–22050, where we may see a short pause.
If the price holds above 21980, the next leg toward 22200 could begin.
Avoid chasing entries near 22000 — wait for either a dip to support or clear breakout continuation.
📊 Analysis Based On: Emperor Pivot + RSI Candle Setup
🔹 Emperor Candles confirm trend & Strength
🔹 Emperor Pivots define Buyer and Seller zones

NQ Power Range Report with FIB Ext - 6/9/2025 SessionCME_MINI:NQM2025
- PR High: 21820.75
- PR Low: 21730.25
- NZ Spread: 202.25
No key scheduled economic events
Session Open Stats (As of 12:15 AM 6/9)
- Session Open ATR: 406.53
- Volume: 25K
- Open Int: 272K
- Trend Grade: Neutral
- From BA ATH: -4.0% (Rounded)
Key Levels (Rounded - Think of these as ranges)
- Long: 22096
- Mid: 20383
- Short: 19246
Keep in mind this is not speculation or a prediction. Only a report of the Power Range with Fib extensions for target hunting. Do your DD! You determine your risk tolerance. You are fully capable of making your own decisions.
BA: Back Adjusted
BuZ/BeZ: Bull Zone / Bear Zone
NZ: Neutral Zone
#202523 - priceactiontds - weekly update - nasdaq e-mini futuresGood Day and I hope you are well.
comment: Same as last week, markets are all very similar. Nq is also in a wedge right under the big round number. I doubt bears can prevent the bulls from printing 22000 but bulls have certainly tried long enough now. Either they get it next week, or it won’t happen for couple of weeks/months.
current market cycle: trading range on the weekly tf, bull wedge on the daily tf
key levels for next week: 20700 - 22000
bull case: Can bulls find enough buyers above 21900 next week to push for 22000 or even a new ath above 22656? Right now bulls are still favored for everything but that does not mean buying above 21500 is a good trade. If you were to buy right now at 21789, your stop has to be 21720 or better 21655. You would be buying at the very top of an ascending triangle we have been in since Thursday. It’s certainly not a good short but I wouldn’t buy it either.
Invalidation is below 21300
bear case: Bears need to close the gap down to 21300 and then we can talk about the highs being in, maybe. For now they fail at making lower lows and letting the bulls make higher highs. They are selling new highs but market is still grinding higher. For couple of weeks now I have been writing that for bears to change the character of the market, they would need a strong gap down or sell spike and leave an open gap. I do think it’s not bad by the bears that we have still not printed 22000, which everyone expected on Thursday but instead bulls had to give up again and we sold for 700 points. Long story short, bears have nothing and no one would be surprised if we print 23000 next week.
Invalidation is above 22100
short term: Neutral around 21800. Longs closer to the wedge trend line 21600 are likely decent. I expect at least 22000 to get hit before we could maybe turn. Most insane thing would be to see a giant melt-up next week and continuing for 23000 over the next 2-3 weeks. Certainly much higher possibility of that happening than a weekly close below 21000.
medium-long term - Update from 2024-06-07: Market is refusing to go down but I can not see this going much more up. Maybe we hit 22000 maybe we don’t. My assumption is still that latest around mid/end of July we begin to decline over the summer.
NQ channel to watch today Channel is there with the previous highs & lows. There are also some trendlines to pay attention to. I hope this helps

NQ: 204th trading session - recapFriday was definitely better than thursday, but again: bad price action... it wasn't that bad, but context and lack of momentum made it definitely not good

NQ: 203rd trading session - recapI'm posting this late because I forgot to do it on thursday, I need to get my grip back. Im just really falling into bad habits, not really specific anything that is bad for my journey, but it is not good and it certaintly won't be good for my trading performance

The SECRET is Compounding Tiny Objectives & Finding SatisfactionIn this video I talk about what I don't really find people talking about, which is how important it is to find satisfaction in your trading. When I say 'satisfaction', I am talking about the monetary kind. What do I mean by this?
A problem I used to have in my earlier days was over-trading, revenge trading, blowing accounts, the usual story. I even had a decently high win-rate and I was good at understanding price. What I discovered was that I was not finding satisfaction because I was not risking enough on my trades. You see.. my strategy had a high win-rate with a positive R average, but the setups did not appear that often. Not as rare as a unicorn, but still, I'd have to sit around and wait and wait and wait. By the time my setup came, I put on a small risk, and I won small. Subconsciously, I found that quite frustrating, even though I was actually winning most of my trades. You can imagine how I felt when I lost a trade. I felt like I invested all that time for nothing. One could argue that I was being careful, but the problem was I was being too careful. I age the same as everyone else, and everyone else ages the same as me. I am investing my time into this strategy, time I will never get back. If I am not utilizing my time in relation to the earning potential, then that is a bad investment. Being a psychologically prone person, I made it a serious rule that all my criteria for my setup must be hit before I take that trade, no exceptions. I kept myself on the higher timeframes so that my mental state can safely process what I needed to process, whether it was analytical or just psychological.
Another point was getting over what others were showcasing or doing. Material luxuries and large wins are all subjective things. It was frustrating seeing people trade every single day, most of them with green days. I felt like I had to do the same too to be a good trader. I was WRONG. What I actually need to do was make my system work for me, and that included how I implemented risk and what was satisfying enough for me to pursue. Like I said in the video, if what you want to do is not interesting or attractive to you, you won't want to do it. As long as what you want to do makes sense and isn't you trying to go from zero to a hundred in 2.5 seconds. As the title says, compound tiny objectives but make it satisfying in terms of risk and your time invested.
- R2F Trading

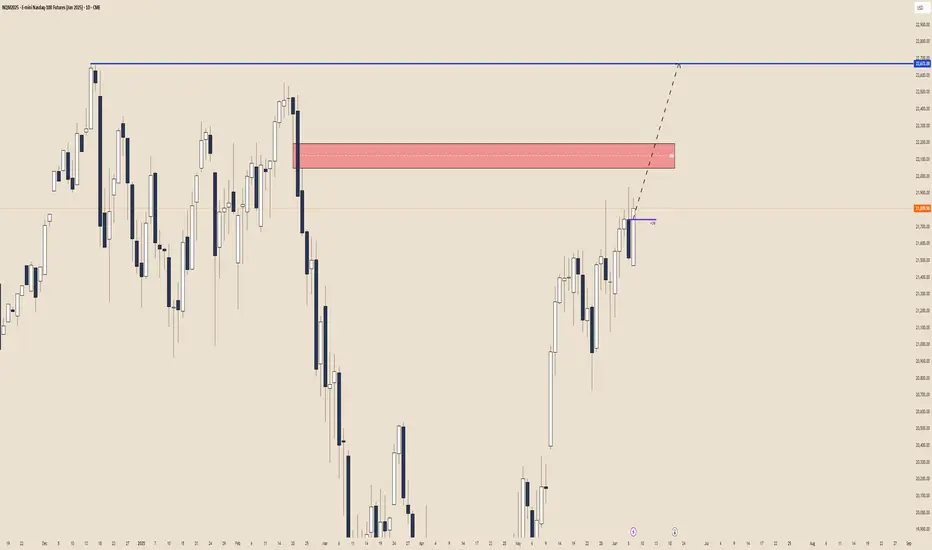
Week 23 Bullish speed delivery Bias on Nasdaq.Looking for speed to show up next week and expand higher to reach out 22, 672.00 breaching trough the D SIBI after a potential Mon-Tue LOW.
I don't really wants to see price gyration around the D +OB on Monday and Tuesday even if pre-CPI. Better it would be to see a opening gap higher and a retrace into the gap to form the Low of the week Mon-Tue and then rally.
+ We're 2 weeks a head of contract change. Acceleration towards liquidity before the change in contract is usual behavior
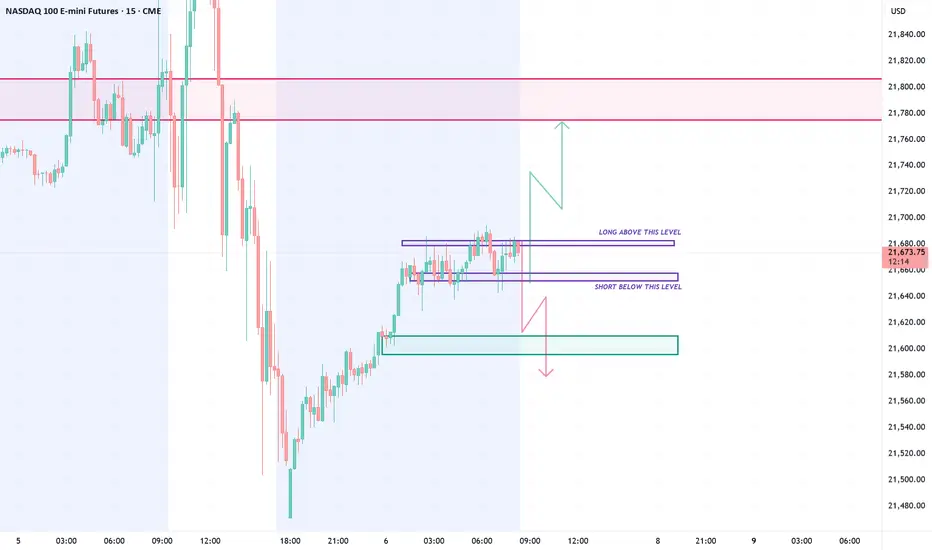
NDX - DAY TRADE - LONG & SHORT SET UPSGood Morning,
Day trade set up for Nasdaq. All long and short levels are listed in the chart!
Enjoy!
NQM June 6 Outlook: Break Above 21700 = Strong Uptrend📝 Description:
📅 Date: 06 June 2025
📍 Instrument: NQM2025 (Micro Nasdaq Futures)
NQM is currently trading inside a tight consolidation zone between 21605 and 21675.
This zone reflects indecision — but such ranges often precede strong directional moves.
🚨 Key Level to Watch:
➡️ Breakout Level: 21700
If price breaks and sustains above 21700, we could see a strong uptrend unfolding with:
📈 Target 1: 21850
📈 Target 2: 22000
💡 Trading Notes:
Breakout above 21700 should be supported by momentum or candle confirmation.
21605–21675 remains the consolidation zone — avoid trades within this choppy range unless clear signals appear.
This outlook is based on smart zone analysis using the Emperor Setup (Pivot + RSI Candle Logic) — designed to simplify trend reading and trade execution.

NQ Short (06-02-25)H/S playing out with drop test on deck. Short below KL 562 and Long above, expect the same tricks/games during the O/N and Dead Zone of Reg Session. Boring days as we wait for some selling to show up as the buyers are losing steam.

Will Musk–Trump Ceasefire Fuel Friday Rebound?Thursday’s Tesla-driven sell-off in Nasdaq 100 futures may flip into a Friday squeeze ahead of nonfarm payrolls, with Politico reporting that Elon Musk and Donald Trump have a scheduled phone call later today to broker a peace deal.
Given their sparring on Thursday was a key factor behind the Nasdaq nosedive, the headlines could help reverse the move into the European session.
Traders may look to establish longs with a stop beneath the intersection of minor horizontal and uptrend support near 21,436. Thursday’s session high screens as a potential target. If the headlines are refuted—or price action fails to respond—both could be grounds to cut the trade.
Good luck!
DS

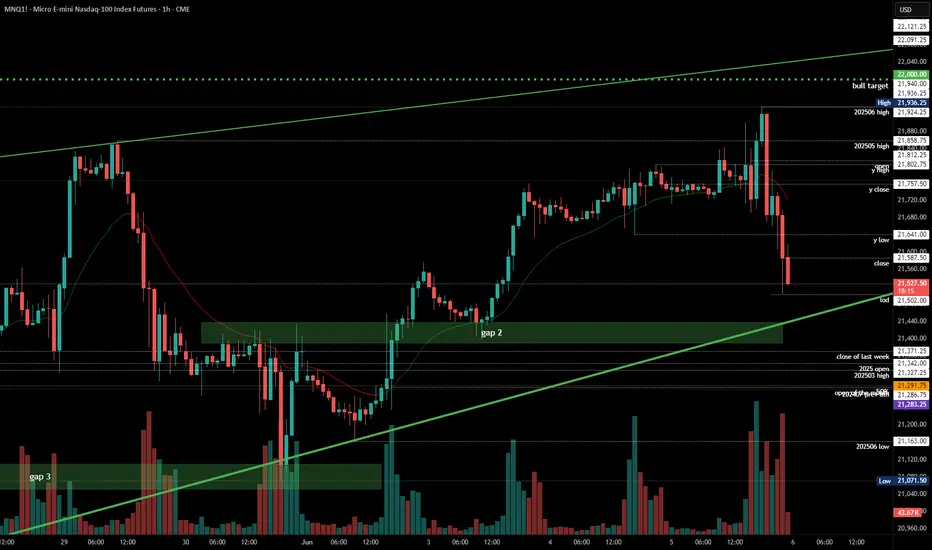
2025-06-05 - priceactiontds - daily update - nasdaqGood Evening and I hope you are well.
comment: Good day for the bears but if you look at the daily or 4h chart, do you really want to sell this? Of course not. Most traders will wait and see where the bears fail to long this for another try at 22000. Technically we had at least 3 legs up in this wedge and 21936 qualifies as a top. I would still not sell this yet. Favoring the bulls for some bounce, can be higher or lower high. Below 21390 I would be neutral and we could try to test down to 21200 or 21000.
current market cycle: trading range
key levels: 20700 - 22000
bull case: Bulls will likely be eager to buy close to the bull trend line which we have not touched since early Monday. Question then is, will we get a lower high or finally the 22000 print? You never know in advance. What you can know is that selling below 21600 is most likely a bad trade.
Invalidation is below 21390.
bear case: Bears getting more confident in shorting new highs since they make decent money doing so. Until we see 21000 again, they will still likely only scalp and not hold on to positions for longer. The bull wedge is too obvious to hold short and pray for a break. If bears would stay below 21700 tomorrow, that would certainly change their outlook and more bulls would start doubting that we can get to 22000. Daily 20ema is around 21200 and the bull trend line around 21400, those are the next targets for bears.
Invalidation is above 22100.
short term: Neutral but if I had to have a position, I’d be long with stop 21050. I will sit on hands and wait for bears to give up and scalp some longs tomorrow. If bears continue down, it will be without me because I don't like getting trapped.
medium-long term - Update from 2024-05-24: Will update this section more after the coming week but in general the thesis is as for dax. Down over the summer and sideways to up into year end. I don’t think the lows for this year are in.
trade of the day: Longing 21700 was a good trade a couple of times today. You could have made decent money doing so and then getting stopped out on the break below 21630 but that would have been still a profitable day. Get comfortable losing.
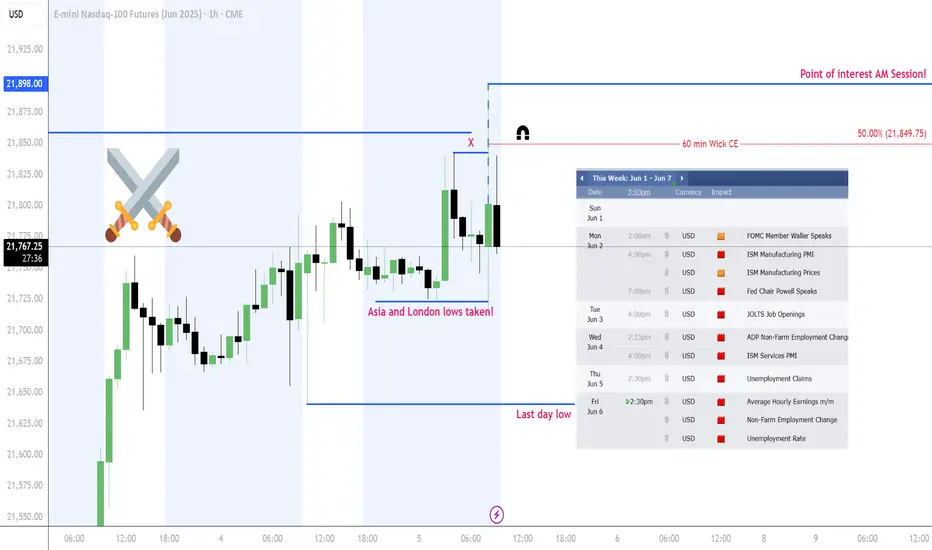
NQ Bullish!I´m bullish on NQ until 1H Wick CE at 21849,75.
We are longterm bullish and we just made a large hourly wick wich we used to visit at its midpoint!
Short MNQ/MNQ or /NQ broke 5 point upwards trend line earlier this week and is testing opposite trend line as I am writing this. This is also a retest of broken trend line. Stop loss above previous swing high and we’ll see if it dumps. If price breaks above opposite trend line theory is invalid.

NQ: 202nd trading session - recapI did skip school again, but unlike last time today wasn't as bad as expected. We did see some push-pull formation and I was focused and I did learn some stuff - so it's not a complete hopeless session.
Price action did look horrible in the aftermath tho: after news hit

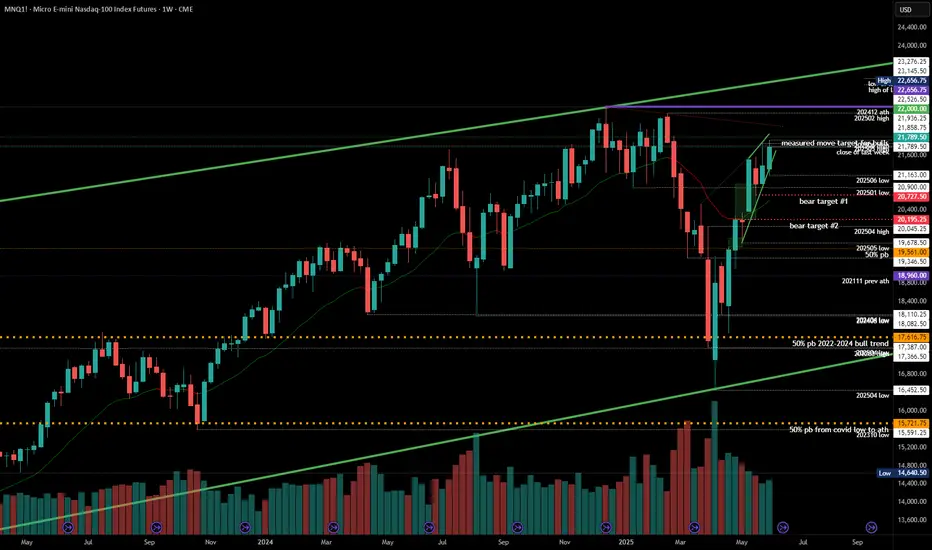
How to Identify Head and Shoulders?How to identify head and shoulders patterns?
We’ll use the current example from the Nasdaq or the US markets. We can quite clearly observe that a potential head and shoulders formation is developing. This means that if the price breaks below the neckline, we may see a deeper correction from the April low.
I will go through the rules on how to identify a head and shoulders formation.
We will also cover how to recognize when the pattern is invalid — meaning the market may continue pushing above its all-time high.
Finally, we’ll discuss how we can position ourselves early, before waiting for a break below the neckline for confirmation.
Micro Nikkei Futures
Ticker: MNQ
Minimum fluctuation:
0.25 index points = $0.50
Disclaimer:
• What presented here is not a recommendation, please consult your licensed broker.
• Our mission is to create lateral thinking skills for every investor and trader, knowing when to take a calculated risk with market uncertainty and a bolder risk when opportunity arises.
CME Real-time Market Data help identify trading set-ups in real-time and express my market views. If you have futures in your trading portfolio, you can check out on CME Group data plans available that suit your trading needs tradingview.sweetlogin.com
Trading the Micro: www.cmegroup.com
www.cmegroup.com

Volume Speaks Louder: My Custom Volume Indicator for Futures
My Indicator Philosophy: Think Complex, Model Simple
In my first “Modeling 101” class as an undergrad, I learned a mantra that’s stuck with me ever since: “Think complex, but model simple.” In other words, you can imagine all the complexities of a system, but your actual model doesn’t have to be a giant non-convex, nonlinear neural network or LLM—sometimes a straightforward, rule-based approach is all you need.
With that principle in mind, and given my passion for trading, I set out to invent an indicator that was both unique and useful. I knew countless indicators already existed, each reflecting its creator’s priorities—but none captured my goal: seeing what traders themselves are thinking in real time . After all, news is one driver of the market, but you can’t control or predict news. What you can observe is how traders react—especially intraday—so I wanted a simple way to gauge that reaction.
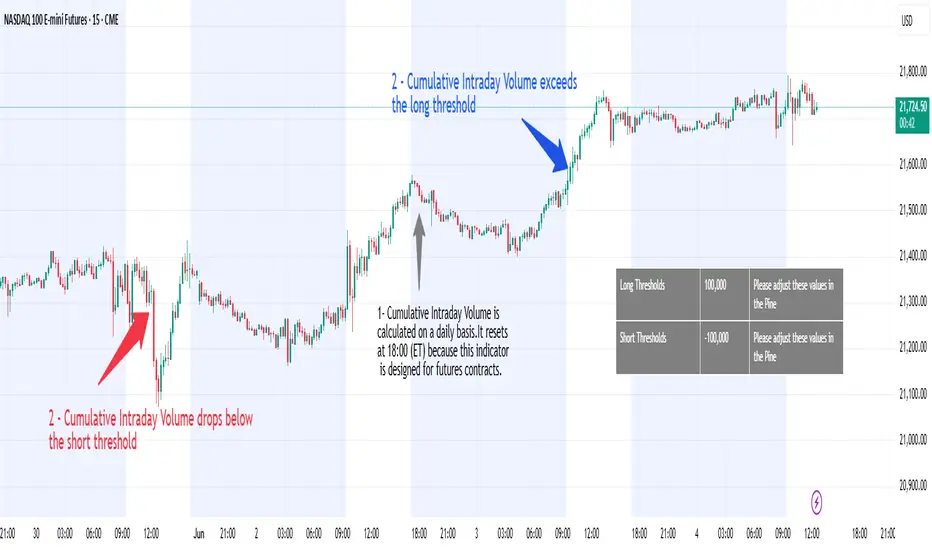
Why intraday volume ? Most retail traders (myself included) focus on shorter timeframes. When they decide to jump into a trade, they’re thinking within the boundaries of a single trading day. They rarely carry yesterday’s logic into today—everything “resets” overnight. If I wanted to see what intraday traders were thinking, I needed something that also resets daily. Price alone didn’t do it, because price continuously moves and never truly “starts over” each morning. Volume, however, does reset at the close. And volume behaves like buying/selling pressure—except that raw volume numbers are always positive, so they don’t tell you who is winning: buyers or sellers?
To turn volume into a “signed” metric, I simply use the candle’s color as a sign function. In Pine Script, that looks like:
isGreenBar = close >= open
isRedBar = close < open
if (not na(priceAtStartHour))
summedVolume += isGreenBar ? volume : -volume
This way, green candles add volume and red candles subtract volume, giving me positive values when buying pressure dominates and negative values when selling pressure dominates. By summing those signed volumes throughout the day, I get a single metric—let’s call it SummedVolume—that truly reflects intraday sentiment.
Because I focus on futures markets (which have a session close at 18:00 ET), SummedVolume needs to reset exactly at session close. In Pine, that reset is as simple as:
if (isStartOfSession())
priceAtStartHour := close
summedVolume := 0.0
Once that bar (6 PM ET) appears, everything zeroes out and a fresh count begins.
SummedVolume isn’t just descriptive—it generates actionable signals. When SummedVolume rises above a user-defined Long Threshold, that suggests intraday buying pressure is strong enough to consider a long entry. Conversely, when SummedVolume falls below a Short Threshold, that points to below-the-surface selling pressure, flagging a potential short. You can fine-tune those thresholds however you like, but the core idea remains:
• Positive SummedVolume ⇒ net buying pressure (bullish)
• Negative SummedVolume ⇒ net selling pressure (bearish)
Why do I think it works: Retail/intraday traders think in discrete days. They reset their mindset at the close. Volume naturally resets at session close, so by signing volume with candle color, I capture whether intraday participants are predominantly buying or selling—right now.
Once again: “Think complex, model simple.” My Daily Volume Delta (DVD) indicator may look deceptively simple, but five years of backtesting have proven its edge. It’s a standalone gauge of intraday sentiment, and it can easily be combined with other signals—moving averages, volatility bands, whatever you like—to amplify your strategy. So if you want a fresh lens on intraday momentum, give SummedVolume a try.