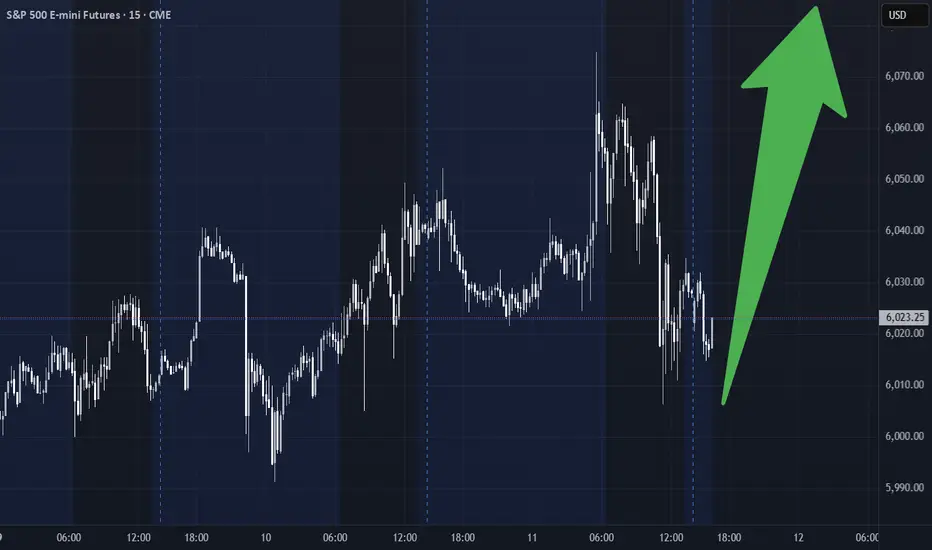
ES Futures Play – Long Bias Despite MACD Caution (June 11, 2025)📈 ES Futures Play – Long Bias Despite MACD Caution (June 11, 2025)
Ticker: NYSE:ES | Bias: ✅ Moderately Bullish
Setup Time: Market Open | Confidence: 65%
🔍 AI Model Consensus Breakdown
📍 Price: ~6,027.25
📊 Trend: Above 20-, 50-, and 200-day MAs
📈 RSI: 64.25 – bullish but nearing overbought
📉 MACD: Bearish crossover → possible short-term pullback
📎 Bollinger Band: Price near upper band – may act as resistance
✅ Majority Long Bias (3 of 4 Models Agree)
Grok/xAI, Llama/Meta, Gemini/Google:
• Solid technical structure (higher highs/lows)
• High open interest and positive momentum
• Slight MACD concern, but bullish setup intact
• R:R ≈ 1.5:1 with upside target in 6,100 area
⚠️ Contrarian View – DeepSeek:
• Warns of overextension after a 30-day rally
• Suggests bearish MACD could drive pullback
• Recommends short targeting 5,930
📌 Recommended Trade Setup
🎯 Direction: LONG
📥 Entry: 6,027.25 (at market open)
🛑 Stop Loss: 5,980.00 (below short-term support)
🎯 Take Profit: 6,098.00 (R:R ≈ 1.5:1)
📊 Size: 1 contract
📈 Confidence: 65%
⚠️ Risk Watch
• 📉 MACD crossover = potential short-term weakness
• 🧊 Near upper Bollinger Band = possible resistance
• 💨 Volatility at open can cause whipsaw → manage risk strictly
• 🌐 Monitor news/macro events for any directional shift
📣 Are you taking the NYSE:ES long today or fading it like DeepSeek?
Drop your view ⬇️ | Follow for more AI-powered market setups.
SPX500U2025 trade ideas
Short SP500 SPYI am net short SPY here. I believe we will cut rates and this will be a sell the news. The market approaches overvalued land yet again. This is why stock picking is so important. I believe we range between 5600-6000 for the next two quarters and we resume a very bullish 2026.
Getting readyThe S&P 500 daily chart is getting ready for fundamentals that will come out on Wednesday. In the Asia session were seeing evidence of selling coming in as the market prepares for Wednesday announcements. This selling could be buyers selling to take profits prior to the fundamentals.

06/10/25 Trade Journal, and ES_F Market analysisEOD accountability report: +2575
Sleep: 9 hours
Overall health: Good
What was my initial plan?
I was neutral going into market open, I expected market to pullback a bit if we had lost 6016 but it never truly got lost.
remained neutral and just watched my levels of 6028 and 6045.
**Daily Trade recap based on VX Algo System from (9:30am to 2pm)**
— 9:30 AM Market Structure flipped bearish on VX Algo X3!
— 10:00 AM VXAlgo YM X3 Sell Signal
— 10:58 AM VXAlgo ES X1 Sell Signal
— 11:32 AM VXAlgo ES X3 Sell Signal (triple sell x3) B+ set up
— 12:00 PM Market Structure flipped bearish on VX Algo X3!
1:03 PM VXAlgo ES X1 Sell Signal
— 1:20 PM VXAlgo ES X1 Sell Signal
Next day plan--> Above 6000 = Bullish, Under 5990 = Bearish
Video Recaps -->https://tradingview.sweetlogin.com/u/WallSt007/#published-charts

What do we think about this buy after taking Ny liquidity?Looking for buys around this area possibly. Want price to take Ny liquidity and gravitate towards daily fair value gap

AMP Futures - Order types, and how to place a stop on the DOM.In this idea we will cover the different order types you can use in Tradingview, also explaining the placement of the different order types, and how to place a stop order on the DOM.

06/09/25 Trade Journal, and Where is the Stock Market going tomoEOD accountability report: +1800
Sleep: 9 hours
Overall health: Good
What was my initial plan?
Bearish going into the market since we had bearish structure, but missed the short at the start of the market. So just waited for gamma levels to hit orr 1 min MOB to be lost before shorting.
Daily Trade recap based on VX Algo System from (9:30am to 2pm)
— 9:30 AM Market Structure flipped bearish on VX Algo X3!
— 10:20 AM VXAlgo YM X1 Buy Signal,
— 11:00 AM Market Structure flipped bullish on VX Algo X3!
— 1:17 PM VXAlgo NQ X1 Sell Signal (triple sell signal by 1:20)
Next day plan--> Above 6000 = Bullish, Under 5990 = Bearish
Video Recaps -->https://tradingview.sweetlogin.com/u/WallSt007/#published-charts

A market at easeThe daily structure in the S&P 500 implies balance and a market at ease as it awaits information about the trade talks with the US and China going on in London.

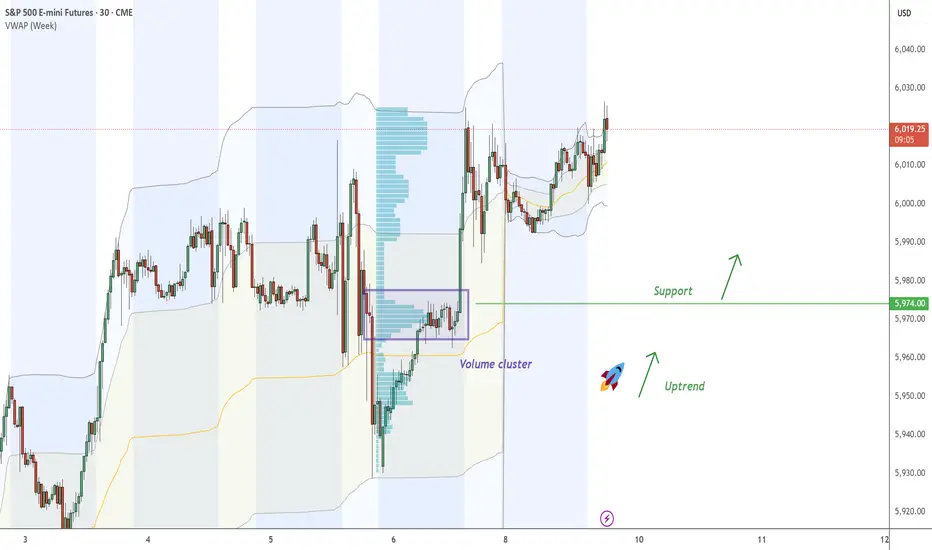
ES - continue with the UptrendOn ES , it's nice to see a strong buying reaction at the price of 5974.00 .
There's a significant accumulation of contracts in this area, indicating strong buyer interest. I believe that buyers who entered at this level will defend their long positions. If the price returns to this area, strong buyers will likely push the market up again.
Uptrend and high volume cluster are the main reasons for my decision to go long on this trade.
Happy trading
Dale
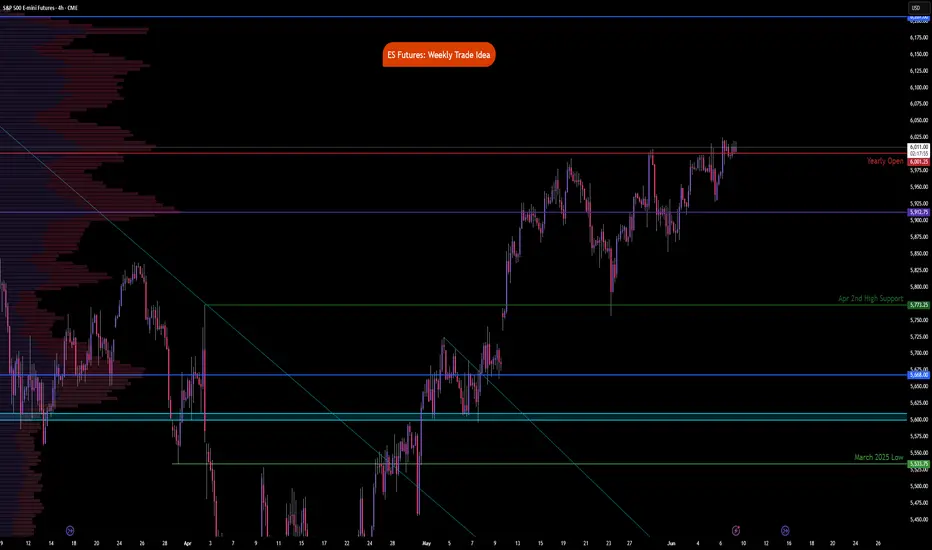
ES Futures-Weekly OutlookCME_MINI:ES1!
Fundamentals and Economic Calendar
Data Recap:
• Friday: 06/06/2025
o US Non-Farm Payrolls (May) 139k vs. Exp. 130k (Prev. 177k, Rev. 147k)
o US Unemployment Rate (May) 4.2% vs. Exp. 4.2% (Prev. 4.2%)
o US Average Earnings YY (May) 3.9% vs. Exp. 3.7% (Prev. 3.8%, Rev. 3.9%)
• Overnight Monday: 06/09/2025
o Chinese Trade Balance (USD)(May) 103.22B vs. Exp. 101.3B (Prev. 96.18B)
o Chinese Exports YY (USD)(May) 4.8% vs. Exp. 5.0% (Prev. 8.1%)
o Chinese Imports YY (USD)(May) -3.4% vs. Exp. -0.9% (Prev. -0.2%)
o Chinese CPI MM (May) -0.2% vs. Exp. -0.2% (Prev. 0.1%)
o Chinese PPI YY (May) -3.3% vs. Exp. -3.2% (Prev. -2.7%)
o Chinese CPI YY (May) -0.1% vs. Exp. -0.2% (Prev. -0.1%)
Looking ahead this week on the calendar, notable economic data releases are as follows:
• Wednesday: 06/11/2025
o US CPI YoY (May)
o US CPI MoM (May)
o US 10 year Note Auction
• Thursday: 06/12/2025
o US PPI MoM (May)
o US PPI YoY (May)
o US 30 year Bond Auction
• Friday: 06/13/2025
o Michigan Consumer Sentiment (Jun)P
o Michigan 1-year and 5-year Inflation Expectations (Jun)P
On the trade and tariff front, we have China-US trade talks continuing in the UK today. The Chinese Vice Premier is visiting the UK from June 8th-13th.
There has been progress made which is visible in terms of China relaxing export controls on rare earth minerals and President Trump stating that they are very far advanced on the China deal ahead of high level talks in London today.
The FED is in a blackout period until the FOMC meeting. Trade, tariffs, and geopolitical risks still need to be monitored.
Technical:
What has the market done?
With NQ leading, ES has also reclaimed yearly open. It held above yearly open in the overnight session.
What is it trying to do?
Climb higher, overlapping bars and yearly VPOC shifting higher denote acceptance at higher prices.
How good of a job is it doing?
Overlapping bars, headline risks and leveraged positions also point towards potential for prices moving lower before resuming higher or remaining range bound. TACO acronym traders may be in for max pain.
What is more likely to happen from here?
Given the data above, we would iterate given our previous explanation that recent data including CPI, PPI, Trade imports, exports is skewed due to trade tensions and this being reflected in business and consumer behavior. FED is likely to remain on hold while it waits and averages out the impact on growth, inflation and labor market.
Scenario 1: Push higher
Prices continue to push higher, if CPI comes in lower than expected, this may prompt a short-term continuation higher.
Scenario 2: Range bound
Markets remain in wait and see mode this week having climbed above yearly open. Markets build value higher and we expect VPOC to shift higher too.
Scenario 3: Sell-off
A mix of factors could e.g., trade talks stalling, weaker than expected US 10 year and 30 year auctions could foreshadow cracks appearing in the bonds market. This may fuel a wider sell-off if yields climb back higher.
Glossary:
ES - emini-S&P 500 Futures
NQ - emini-NASDAQ 100 Futures
VPOC - Volume Point of Control: The most traded price by volume in a given range. Represents acceptance or consensus
Tiqgpt signals for today! Starting with the 1D timeframe, the S&P 500 E-mini Futures have shown a progressive upward movement, indicating a strong bullish market structure. The presence of consecutive bullish candles suggests a dominant buying interest, likely from institutional players. This upward trajectory is supported by the formation of a significant Order Block (OB) around the 5,975 level, which has not been revisited, indicating a lack of mitigation and a strong upward drive.
Drilling down to the 4H timeframe, we observe a consolidation pattern forming just below the 6,000 level, which acts as a psychological round number and potential liquidity pool. The market has made several attempts to breach this level, suggesting an accumulation of buy orders and potential preparation for a liquidity sweep above this zone.
On the 1H chart, the price action has developed a tighter range, oscillating around the 6,004 level. This consolidation near a high indicates a potential inducement zone, where smart money might be trapping retail traders into premature bearish positions before a possible upward expansion.
The 15M timeframe shows a recent Break of Structure (BOS) above the previous high at 6,004, confirming a bullish bias in the lower timeframes. This BOS is crucial as it suggests a shift in market structure favoring continued bullish momentum.
Finally, the 5M chart provides a granular view of the buying pressure. A sharp upward move followed by a small retracement forms a Fair Value Gap (FVG) around 6,004, which has not been filled, indicating that the price might revisit this area to mitigate the imbalance before continuing upwards.
INSTITUTIONAL THESIS:
The overarching smart money intent appears to be targeting the liquidity above the 6,000 level, using it as a springboard for further bullish expansion. The setup across multiple timeframes suggests a coordinated effort to induce bearish sentiment near this key psychological level, only to trap those positions and drive the price higher through a liquidity sweep.

+/-618smack dab in the middle...place your bets, place your bets... come line pays 2x.... 7 craps u outtttt!!!

#es_f $6k holding or we are pulling back cant wait !!main area i am looking for is conf for the $6k area
Mean Reversion + Alternative Long Set-Up MES🔁 MES Mean Reversion Setup – Fade the Gamma Pin
• Trend Bias: Neutral-to-Bearish
• Entry Zone: $6,012–$6,016
• Stop-Loss: $6,020
• TP1 / TP2: $5,998 / $5,985
• R:R Ratio: ~1:2
• Confidence Score: 7.5/10
• Reasoning:
Price is stalling inside top of Fib zone and SpotGamma’s gamma ceiling.
Vol is crushed and mean reversion dominates without fresh upside catalyst.
Clean rejection of 6,012 area intraday offers high-conviction fade down to VWAP zones and liquidity pools under 6,000.
⚠️ Alternative Long Setup – Only on Break + Hold of 6,020
• Trend Bias: Bullish breakout continuation
• Entry Zone: $6,022–$6,025
• Stop-Loss: $6,015
• TP1 / TP2: $6,050 / $6,075
• R:R Ratio: ~1.5:1
• Confidence Score: 6.5/10
• Reasoning:
Would signal breach of gamma wall (unusual without major news).
Requires follow-through volume and tape support from HIRO or strong opening drive.
🧠 Key Notes Going Into the Week:
SPX pinned at 6,000 = no trend yet, just controlled chop.
JPM 5,905 call (June 30 expiry) still anchoring downside gamma. If MES > 6,012 holds on volume, prepare for potential chase.
Next macro catalyst: Wednesday’s CPI (6/11). Until then, expect low realized vol and grind behavior.

Buyers set the toneBuyers set the tone in the Asia session for the S&P 500 daily chart. It implied confidence going into the labor reports on Friday. This confidence carried over to a close above 6000. The next objective to the upside is 6035.

S&P – Bearish outlook, correction coming next week?A lot of chatter recently suggests traders don't trust this rally, I can see why. From both a technical and macro perspective, things are beginning to look shaky.
The S&P 500 is hovering around the psychological 6000 level, moving in and out with little conviction. The index has already broken its first upward trendline, and while it’s attempting to hold a second, momentum appears to be fading.
We’re currently seeing the formation of a rising wedge pattern. More importantly, RSI is diverging from price action, suggesting weakening momentum.
While inflation has come down from its peak, monetary policy remains tight. Rates have been high for a while now, and the effects may be surfacing.
Hiring appears to be slowing. Initial jobless claims have been ticking up for months. Challenger job cuts just spiked above 200K, a level we haven't seen since COVID or 2008.
Interestingly, the recent JOLTS report shows that job openings increased, but quits declined, perhaps suggesting workers are less confident about job-hopping?
Despite this, unemployment held steady at 4.2% today. Historically, unemployment tends to lag Challenger job cuts by a few months, so we could be in for a jump in July or August, similar to the pattern we saw last year, which caused a huge correction.
From a technical standpoint, I’ve entered a small short position here. Momentum is fading, and the wedge breakdown looks interesting. With that said, with macro uncertainty and the possibility of QE-style stimulus returning if economic data worsens, I’m cautious. We’ve seen markets rally on bad news before, especially in crisis environments, like covid times.
The CPI report next week is interesting. If inflation surprises to the upside, the bearish case strengthens. If it cools more than expected, markets might push higher before any real correction.
Interesting times going into summer.
volume profile trading idea test spxthis is a test for my volume profile strategy. the idea is to respect the P shape and the lower side of POC for an uptrend

$SPX trying to break out of the range$ SPX is trying to break out the range, having tested both sides with upside and downside false breakouts.
Choppy action till a decisive breakout happens
Good signs for the stock market opening?S&P 500 E-mini Futures: The range breakout hit its target below perfectly. Now, we're trading back within the range and above the mid-band on the 4-hour timeframe. This looks incredibly bullish, imo!
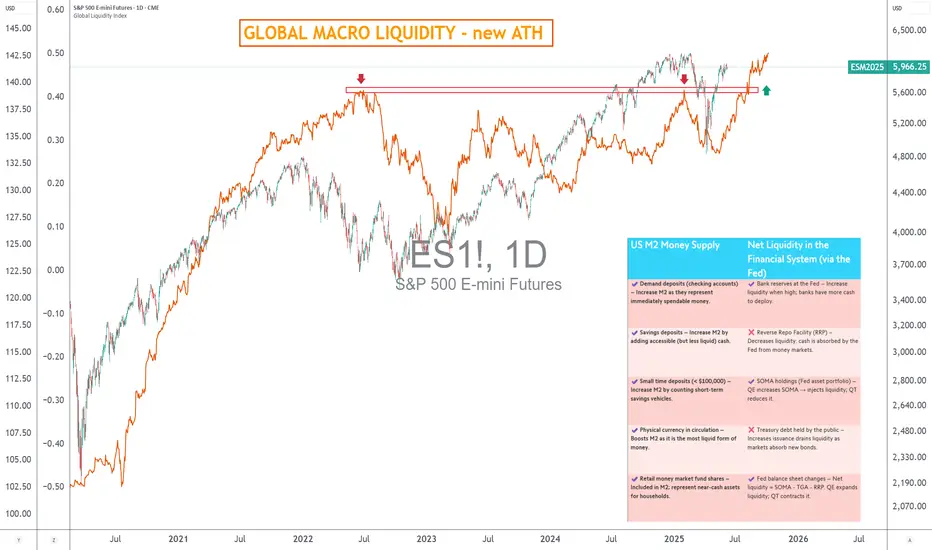
Stock market cycles & liquidity, understand it all in 3 minutesLiquidity is a key factor in market finance. Without it, risky assets in the stock market, equities and cryptocurrencies lose their fuel. Over the cycles, one thing has become clear: the direction of financial markets is strongly correlated with that of global liquidity. But liquidity is not a single indicator: it is organized into three complementary layers. Understanding these layers enables us to better anticipate major trends. Level 1 is global monetary liquidity (M2). Level 2 concerns net liquidity within the financial system, and level 3 encompasses overall macro-liquidity, through activity and credit indicators. Together, these three dimensions form the markets' “bloodstream”.
The chart below compares the S&P 500 trend with the global money supply M2
Level 1: Global monetary liquidity (global M2)
The first stage of the rocket: global M2. This monetary aggregate measures the sum of the money supply (M2) of the major economies - USA, China, Eurozone - converted into US dollars. It includes sight deposits, savings accounts and certain short-term instruments, representing the gross liquidity immediately available in the global economy.
This level of liquidity is directly influenced by monetary (key rates, QE/QT), fiscal and wage policies. The evolution of the US dollar plays a crucial role: a strong dollar mechanically reduces global M2 in USD, while a weak dollar increases it. In this respect, Chinese and American dynamics are often divergent, as they are driven by different credit logics (centralized planning on the Chinese side, rate-based adjustment on the US side).
But beyond the absolute level, it is above all the momentum of M2, its first derivative (annual variation), that serves as a compass. An uptrend coupled with positive momentum strongly favours risky assets. Conversely, stagnation or a negative divergence between trend and momentum (as at the end of 2021) anticipates a contraction in valuations. Over this cycle, there is even a correlation coefficient of 0.80 between global M2 and Bitcoin, projected 12 weeks into the future: liquidity leads, markets follow.
Level 2: Net liquidity of the financial system
The second level is more subtle, but just as decisive: net liquidity within the financial system. This is the effective credit capacity, i.e. the funds actually available to irrigate the real economy after withdrawals, excess reserves and regulatory mechanisms. Unlike M2, this measure does not reflect gross liquidity, but rather the liquidity “actionable” by financial institutions.
In the United States, this net liquidity depends, among other things, on FED mechanisms such as the reverse repo program (RRP), which temporarily sucks in or releases liquidity, and on the level of banks' excess reserves. Its evolution is strongly linked to the central bank's restrictive or accommodating monetary policy, QE cycles and QT cycles.
The correlation of this net liquidity with the S&P 500 and Bitcoin, although slightly lower than that of global M2, remains significant. It acts as a filter for gross liquidity: even if M2 is high, if credit capacity is blocked by excessively high rates or constrained reserves, the impact on markets can be neutralized.
Level 3: Global macro liquidity
Finally, the third level: global macro liquidity. It includes barometers of economic conditions that directly influence risk perception and investor appetite: PMI indices (manufacturing and services), credit conditions, employment levels, default rates, etc. It is less monetary, more conjunctural. It is less monetary, more cyclical, but its impact is real, as it shapes the context in which financial liquidity is expressed.
It is this level that contextualizes the first two: a rising M2 in a deteriorating economic environment (PMI below 50, falling employment) may have a limited effect. Conversely, signs of economic recovery may reinforce the transmission of liquidity to the markets. In this sense, the timing of the FED's rate cuts becomes a key macro catalyst. As long as US policy remains restrictive, M2 will plateau and net liquidity will remain constrained, even if the ECB or PBoC relax their conditions.
Conclusion: Global liquidity cannot be summed up in a single indicator. It's an ecosystem structured on three levels: global gross liquidity (M2), effective credit capacity (ECC) and net liquidity.
DISCLAIMER:
This content is intended for individuals who are familiar with financial markets and instruments and is for information purposes only. The presented idea (including market commentary, market data and observations) is not a work product of any research department of Swissquote or its affiliates. This material is intended to highlight market action and does not constitute investment, legal or tax advice. If you are a retail investor or lack experience in trading complex financial products, it is advisable to seek professional advice from licensed advisor before making any financial decisions.
This content is not intended to manipulate the market or encourage any specific financial behavior.
Swissquote makes no representation or warranty as to the quality, completeness, accuracy, comprehensiveness or non-infringement of such content. The views expressed are those of the consultant and are provided for educational purposes only. Any information provided relating to a product or market should not be construed as recommending an investment strategy or transaction. Past performance is not a guarantee of future results.
Swissquote and its employees and representatives shall in no event be held liable for any damages or losses arising directly or indirectly from decisions made on the basis of this content.
The use of any third-party brands or trademarks is for information only and does not imply endorsement by Swissquote, or that the trademark owner has authorised Swissquote to promote its products or services.
Swissquote is the marketing brand for the activities of Swissquote Bank Ltd (Switzerland) regulated by FINMA, Swissquote Capital Markets Limited regulated by CySEC (Cyprus), Swissquote Bank Europe SA (Luxembourg) regulated by the CSSF, Swissquote Ltd (UK) regulated by the FCA, Swissquote Financial Services (Malta) Ltd regulated by the Malta Financial Services Authority, Swissquote MEA Ltd. (UAE) regulated by the Dubai Financial Services Authority, Swissquote Pte Ltd (Singapore) regulated by the Monetary Authority of Singapore, Swissquote Asia Limited (Hong Kong) licensed by the Hong Kong Securities and Futures Commission (SFC) and Swissquote South Africa (Pty) Ltd supervised by the FSCA.
Products and services of Swissquote are only intended for those permitted to receive them under local law.
All investments carry a degree of risk. The risk of loss in trading or holding financial instruments can be substantial. The value of financial instruments, including but not limited to stocks, bonds, cryptocurrencies, and other assets, can fluctuate both upwards and downwards. There is a significant risk of financial loss when buying, selling, holding, staking, or investing in these instruments. SQBE makes no recommendations regarding any specific investment, transaction, or the use of any particular investment strategy.
CFDs are complex instruments and come with a high risk of losing money rapidly due to leverage. The vast majority of retail client accounts suffer capital losses when trading in CFDs. You should consider whether you understand how CFDs work and whether you can afford to take the high risk of losing your money.
Digital Assets are unregulated in most countries and consumer protection rules may not apply. As highly volatile speculative investments, Digital Assets are not suitable for investors without a high-risk tolerance. Make sure you understand each Digital Asset before you trade.
Cryptocurrencies are not considered legal tender in some jurisdictions and are subject to regulatory uncertainties.
The use of Internet-based systems can involve high risks, including, but not limited to, fraud, cyber-attacks, network and communication failures, as well as identity theft and phishing attacks related to crypto-assets.
Buyers are showing an attitudeBuyers are showing an attitude in the S&P 500 daily chart by showing their presence in the Asia session for a Friday trade date. This implies follow-through to the upside going into Friday's reports.

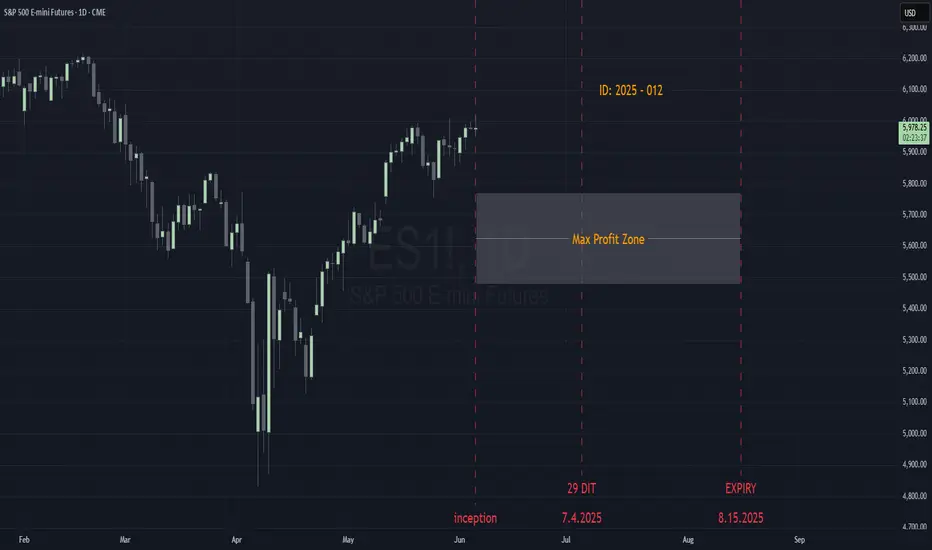
ID: 2025 - 0126.5.2025
Trade #12 of 2025 executed.
Trade entry at 71 DTE (days to expiration).
Excellent fills this morning, well under mid.
Target profit is 5% ROI
Happy Trading!
-kevin
ES Trade Idea and Upcoming NFP ReportCME_MINI:ES1!
• What has the market done?
ES futures are lagging compared to tech heavy index NQ futures. ES futures are still below yearly open. Yearly open has been a strong area of resistance since the rally of April 6th Lows in futures complex.
• What is it trying to do?
ES futures are in consolidation mode, building value higher. VPOC has shifted higher since the gap up from May 11th open. VPOC and 0.786 fib level provide a base for a continuation higher.
• How good of a job is it doing?
Markets seem to be slowing its rally. After such a strong rebound, participants are wary of any pull-backs. Although a strong trend higher, consolidation or a pullback is not illogical at these levels.
• What is more likely to happen from here?
o Scenario 1: Hold steady and NFP provides needed boost for markets to get across yearly open resistance and climb higher.
o Scenario 2: A mixed NFP report may point towards further consolidation. Key level 5873 as support on move lower before reverting higher.
o Scenario 3: A hawkish NFP report that signals higher for longer rates, may be interpreted by market participants as less monetary stimulus and dwindling rate cut bets for this year. We anticipate a sell-off towards 0.618 fib level in this scenario, moving to the lower edge of micro composite volume profile.
In all the above scenarios, there is a clear LIS at yearly open. Other key levels are defined cleanly on the higher time frame. Important thing for traders to note here is to trade what you see and not what you think. Having an alignment between fundamentals and technicals is sound but the markets do what they do, and price moves where it should. Painting narrative to any move may sound fancy but it gets less important at intraday time frames in our opinion. Hence why we view all this considering auction markets and volume profile.
Glossary:
ES - emini-S&P 500 Futures
NQ - emini-NASDAQ 100 Futures
VPOC - Volume Point of Control: The most traded price by volume in a given range. Represents acceptance or consensus
NFP - Non-Farm Payroll: Released by the US Department of Labor around the 1st Friday of every month. It reports on Unemployment, Productivity and other key metrics. Key economic release
LIS - Line In the Sand: A key zone that might tip buyers or sellers to act to cover risk and might change the overall bias of our analysis
