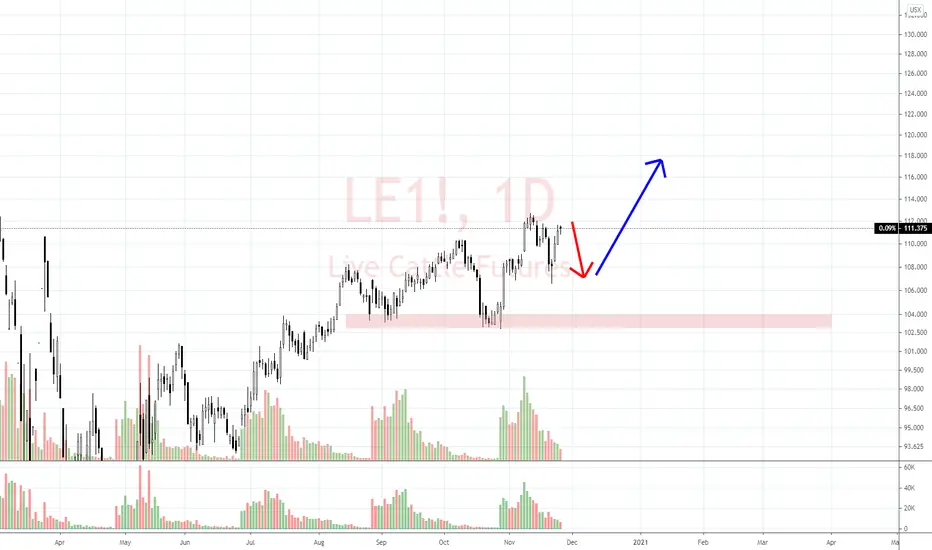
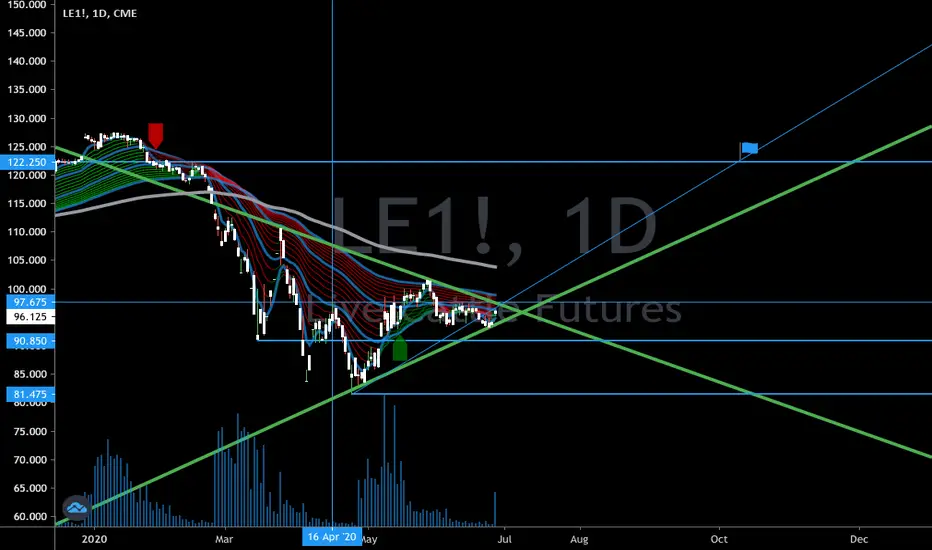
Traditional|LE1!|Long and shortLong and short LE1!
Activation of the transaction only when the blue zone is fixed/broken.
The author recommends the use of anchoring fixed the blue zone, this variation is less risky.
If there is increased volatility in the market and the price is held for more than 2-3 minutes behind the activation zone after the breakdown, then the activation of the idea occurs at the prices behind the activation zone.
Working out the support and resistance levels of the consolidation zone.
* Possible closing of a trade before reaching the take/stop zone. The author can close the deal for subjective reasons, this does not completely cancel the idea and is not a call to the same action, you can continue working out the idea according to your data, but without the support of the author.
+ ! - zone highlighted by the ellipse is a zone of increased resistance, in this area there is a possible reversal for a correction, please take this factor into account in this transaction.
The "forecast" tool is used for more noticeable display of % (for the place of the usual % scale) of the price change, I do not put the date and time of the transaction, only %.
The breakdown of the upper blue zone - long.
Breakdown of the lower blue zone - short.
Working out the stop when the price returns to the level after activation + fixing in the red zone.
Blue zones - activation zones.
Green zone - take zone.
Red zone - stop zone.
Orange arrows indicate the direction of the take.
Red arrows indicate the direction of the stop.
Priority - The value of the priority parameter implies the author's subjective opinion about the more likely activation zone on this idea, this does not mean that this idea will be 80% activated by this parameter, the purpose of the parameter is to provide for the risk of the inverse of the zone parameter.
Example: "Priority Long: So the author inclines more in the direction of the activation zone open long trades, in this case, when reaching the activation zone in short you should be very careful, because this area may be highly likely to be punched about the breakdown/do not get to take/activate transaction from go to stop."
Please consider this parameter if you use my ideas.
SUM PNL: This parameter displays the total % of all closed ideas of the "new" format (according to the author) for this sector at the time of publication of the idea. The calculation is very "clumsy" just the sum of the profits of all the ideas, based on this indicator, you can more accurately assess the risks when working with my ideas of this sector. I present you the construction of the idea, you can use it yourself as you like based on your subjective view and risks, the calculation of the PNL indicator is carried out only on transactions that the author closed on TV in manual mode or by take.
P.S Please use RM (risk management) and MM (money management) if you decide to use my ideas, there will always be unprofitable ideas, this will definitely happen, the goal of the system is that there will be more profitable ideas at a distance.
LE1! trade ideas

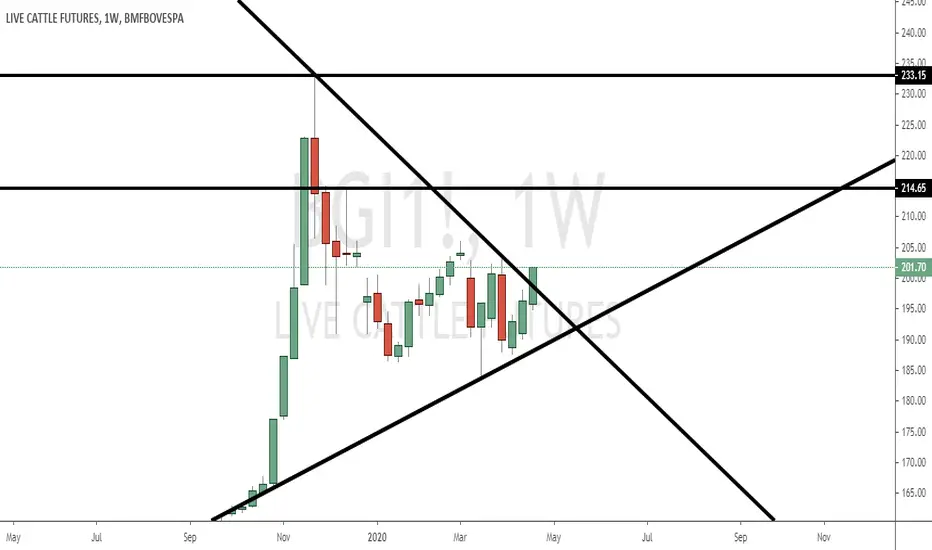
Brazilian Cattle consolidationBr cattle has got a nice uptrend but now is showing some weakness for moment its a neutral position and take a profit if you ride it
LEJ2021. Live Cattle Daily. In the golden pocket.Any dedicated live cattle traders, I would love to hear your take! If you are there is no need to read what I have below. You would probably find it very stupid.
------
I do not understand the fundamentals surrounding this market as far as when the high prices are. Doing a quick google search I see from the first image brought up that typically live cattle is falling right about now and getting ready to rebound. We have been rising steadily for a while, so I think it's safe to say the market is not behaving to expectation. That makes me a little uncertain, but I am falling back on TA entirely for any decisions here.
I hate to buy anything before I see the momentum in my favor, but if I ever were to buy a zone, this wouldn't be a bad one. I have picked this apart thoroughly, and as non-biased as possible, and I think I did a really good job so I hope you enjoy.
-------
One thing I notice is that whenever I say "this wouldn't be the worst" or "this wouldn't be a bad one" historically it has been a bad one. If this goes against me I will have to make some conscious decisions to change just a little in that department.
---------

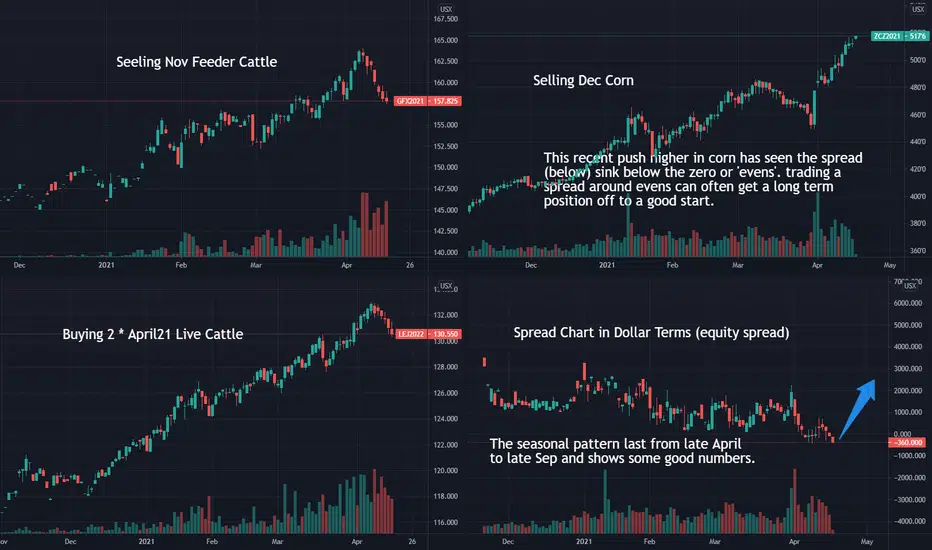
Cattle and Corn: An Obscure Spread With Interesting NumbersAn interesting spread here. I’ve traded this one on and off over the years. It’s a long-term hold and some years this spread just has a nice smooth trend.
Think of this spread as a cost of carry, in a way. Or perhaps: wholesale versus retail is a better way to look at it.
Feeder Cattle (young moo cows) + Corn (food) + time equals Live Cattle (grown up ones).
It’s like that math parents do when say “do you realize how much it costs to have a teenager and send him/her to college?”
In futures we can trade that, for cattle and corn at least. We can see where base cost of production is over or undervalued and with a bit of patience, these kinds of trend trades reveal themselves.
This one has a great seasonal pattern. That is, it tends to repeat itself each year. Not every year, but most years. Research says selling Feeders and Corn and buying live Cattle can be quite profitable. On average, an entry late April and exit late Sep has been profitable every year since 2005.
From 2006 onwards: 100% strike rate, average profit $3374 for one spread.
Formula:
(+2*400*Live Cattle) – (1*50* Corn) – (1*500 * Feeders)
Essentially it says one contracts of feeders (50000lbs) plus one of corn (5000 bushels) makes about two live cattle (80000lbs).
Some also trade a 1 Corn: 2 Feeders and 4 Live Cattle. Its’ essentially halving the corn requirement from above.
Remember, there are no rules in spread trading. Our job is to find the correlations and trade them.
Risk:
Hmmm, there are two ways to look at that. The stats say the worst drawdown in the last 15yrs in $5400 and that is about double of most other years in that time. So it’s not a small risk trade.
The other way is to eyeball a chart. That recent move from +2000 to 0 did not take long at all. Unless get a well-timed entry, then stops will have to be wide - a few thousand at least (about 3.3 times ATR). It’s one where you would start with a wide stop and bring it in should you see some equity.
Entries and exit need finesse since it’s not an exchange traded spread. Experienced spreaders only, with knowledge of seasonality. In you are new to these kinds of spreads, mark it down as market knowledge and come back for a look later on.
Continuous Live CattleWeekly Cont. Cattle: The shaded boxes represent the previous 4 years of price action. Observe: Price trends up into early February. Cattle broke resistance against the (dashed) downtrend line and is attempting to break above the (solid) uptrend parallel line.
A break above the solid up trend parallel will be fighting the larger structure of a long term bear. **When it makes a swing low, the reaction high has failed to take out the up trending parallel line above. After marking the swing high, price action eventually moves lower taking out its current up trending line. Can Feb or April Cattle buck the trend?
A solid move above the current parallel would target the $130 area at the next light gray uptrend parallel. A move lower targets the lowest solid uptrend parallel between 95 and 100. End of March and July will be time frames to watch for potential cycle highs or lows.
**Put/Call Spreads or 3 way spread may be ideal at this current area**

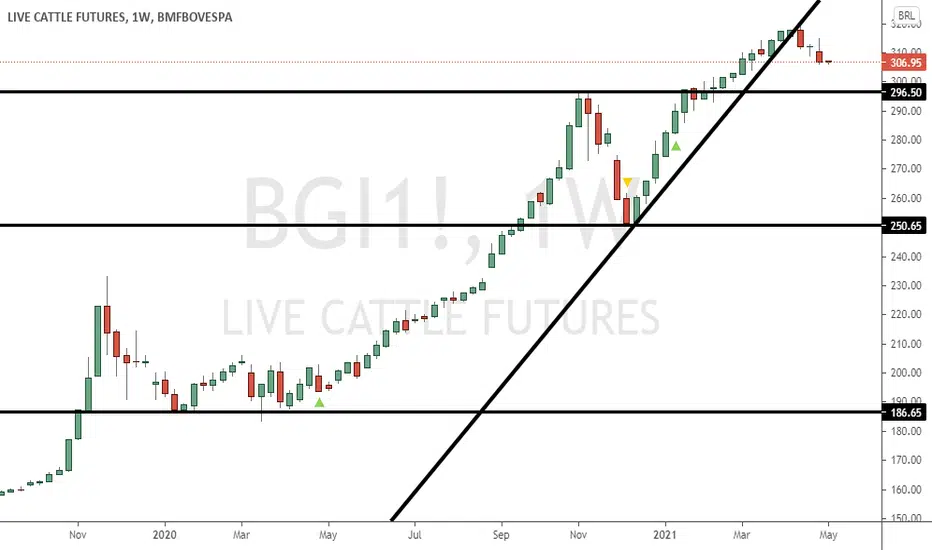
Brazilian Cattle resumes its trend upBrazilian cattle has got continuation over its main trend up for moment now its a up trend in direction or 345 prices... bad for customers in brazil that will pay higher prices over main meat!
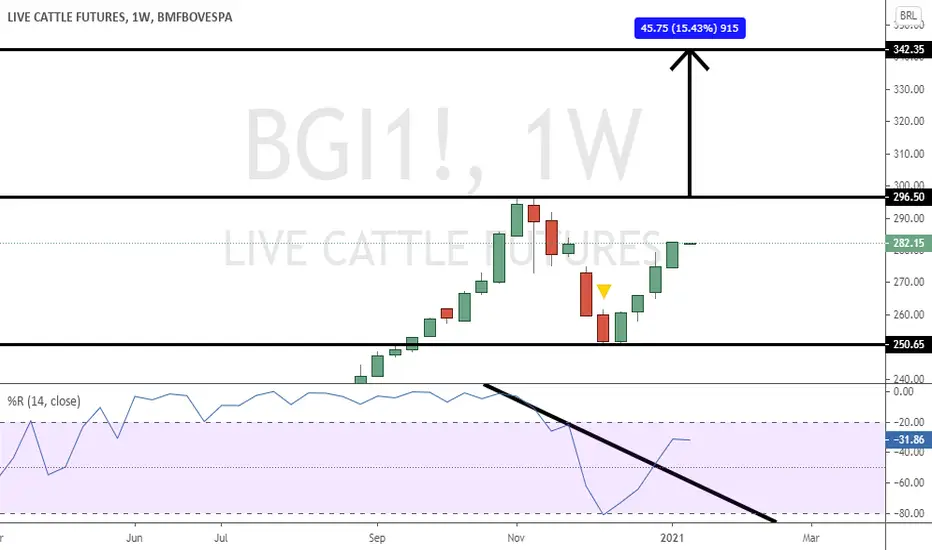
Catlle Up trend.... I know few people here might trade cattle but in brazil its quite a nice market to pay attention as we are the top cattle market in the world.
From now its a long position.
Brazilian Cattle.... indecisionFor moment if you ride my call on catlle from april.. now its moment to take profits and wait for another decision.. for moment is out

View on Live Cattle (26/11)Likely to see price drop in this and next week
Looking for potential buying set up at the start of 2nd week of december.
remain bullish bias unless price breaks below 102.5
Disclaimer:
The information contained in this presentation is solely for educational purposes and does not constitute investment advice. We may or We may not take the trade.
The risk of trading in securities markets can be substantial. You should carefully consider if engaging in such activity is suitable to your own financial situation.
I am not responsible for any liabilities arising from the result of your market involvement or individual trade activity
Live Cattle Lean Hog December ContractsWith seasonality behind our back as well, I see the December Live Cattle Lean Hog Contracts on a potential turn here this coming week. Keep an eye on the key levels and trendlines to see if the market turns at that level and continues in its short downtrend.


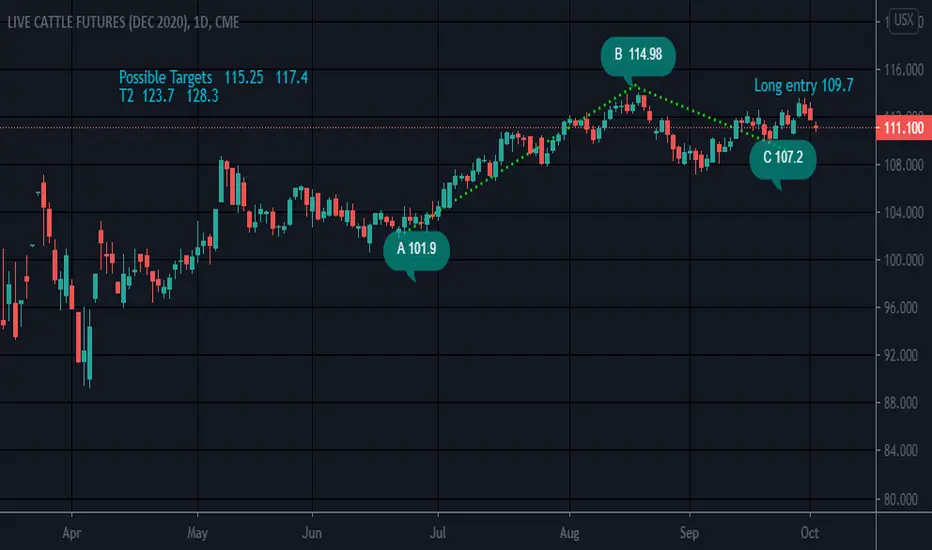
ABC BullishContinuous contract 12/20
Possible stop below 107.17 is long entry level met
Not a recommendation
Live Cattle trade ideaLE1!
Potential long trade here on cattle, rejection off the 0.786 fib extension, though there is some trendline support potentially, so this can be longed on the trend, or if trend is broken, short. Be fluid, be water when trading. Limit bias and trade what you see.

live cattle futures daily analysisHi friends
the daily chart of this market shows that it will experience a downtrend in the next few days with a very high probability at the same time it is better to be vigilant of the change of direction towards the opposite
please subscribe to receive more analysis

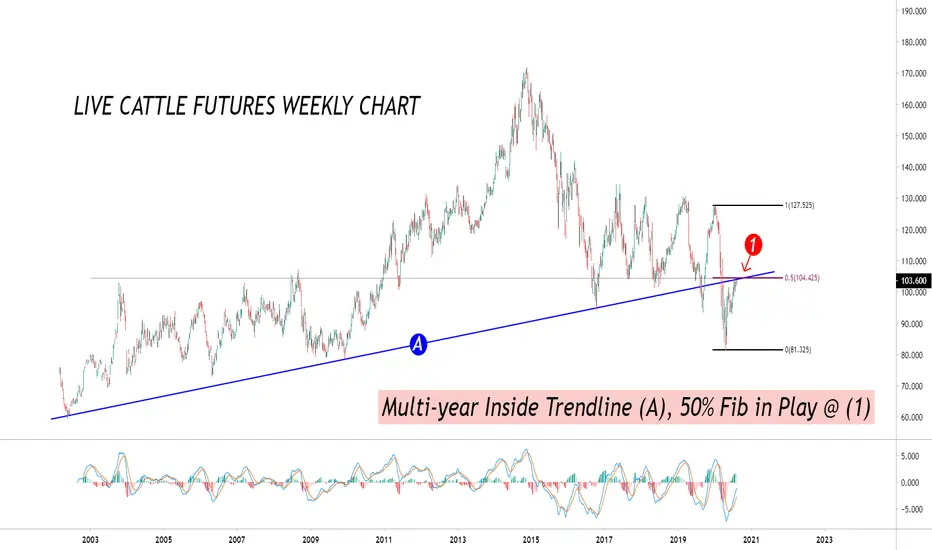
USMEF anticipates strong rebound for beefJune beef exports were on par with the May lows, down 33% from a year ago. Exports were lower than the previous year to most markets except for Canada, China and South Africa where official figures showed an increase. Exports accounted for 9.7% of beef production in June, down from 15.4% a year ago, the lowest in 10 years.
Historic Seasonality data shows August returns an average of 0.071%, September 0.428%, October 1.387%, November 0.925% and December 0.623%. Multi-year Inside trendline support (A) (now resistance) junctions with 50% fib level (1), taken from the January highs of this year and the April lows. Watch for increased buying pressure above this resistance zone, with a first weekly target of 114s. Weakness around these current levels will most likely result in revisiting first significant support at 100.475.
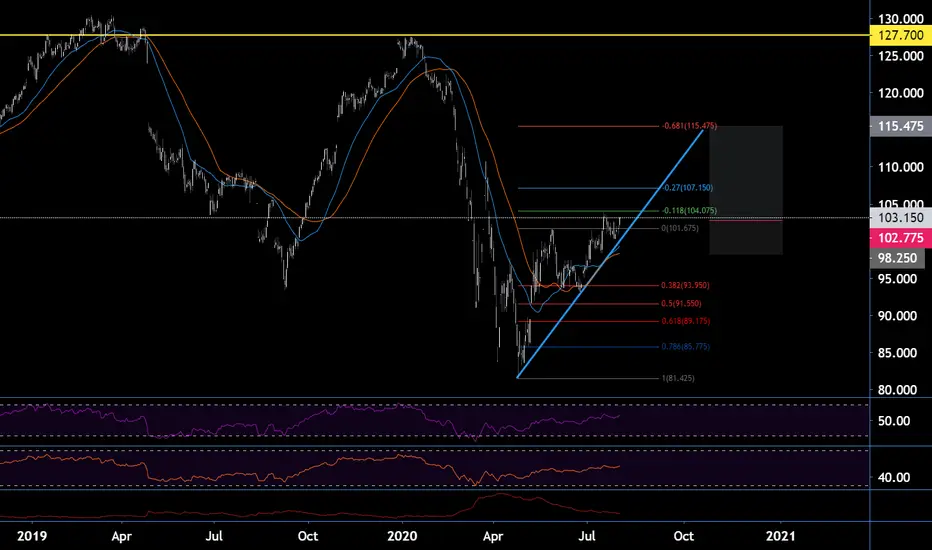
Live Cattle LongLive Cattle has seen prices at a high of 127-130 over the last 3 years. Price has bottomed at the end of April 2020 and since been on the rise.
Looking for price to retrace back towards the prior swing high.
1. Enter - on next candle
2. Stop - around 98.35 ( 3 atr )
3. Target - around 115.50 ( .618 extension )
4. Risk Reward = 2.8
Cattle prices in Brazil. Time for a REVERSAL!!!!With the high demand from China and some plants closing down due to COVID, the cattle prices in Brazil have just gone up since April. Today was the first real candle but it stopped at he 21 exp mov average.
The country has started to reopen the plants, COVId infection likely reached its plateau and we can expect the imbalance of demand supply to go to normality.
It is totally achievable to see prices of 210 or 200 very soon. Cattle prices in the US will bbe highly dependable of USDBRL correlation.

Live Cattle Looking for more Selling TodayDaily Live Cattle looks still like wants to test lows again before any signs of bullishness.
These are just my opinions and do not take as trade advice.
Good luck this week everyone!


Live Cattle is bullLive cattle is bull.
Early May it jumped from 87 to 94, and next day hitting 98.
This breakout caused in the days to follow some oscillating within the 92-100 band, forming a clear up channel.
Market hit 100 yesterday, found support on the mid channel level and closed just below 100. I’m pretty sure we will test it again today.
My believe is this breakout, plus the upward channel, will result in new local high’s.
We have clearly broken out of the downward trend of the last months.
Once we break the 100 level, others will step in and this could lead to a decent bull trend.

LIFE CATTLE LONG PREVAIL based on COT LIFE CATTLE LONG
Based on COMMITMENT of TRADERS (contracts from: 05/05/2020)
Long:70630
Short; 41289
LONG IS PREVAILING
potential target level 110,350
WinRateRatio 2,51

Bottom of the ChannelWe hit the bottom of the channel on the monthly and weekly charts for Cattle futures. We are putting on a long June contract, and short October contract to profit on the mean reversal.
