$BTC - Cup and Handle?Yes, bitcoin prices have dropped but it is moving along nicely with our handle... just saying... do you guys see something different? Please share!
MBT1! trade ideas

Bitcoin Flag!CME:BTC1!
CRYPTOCAP:BTC is printing a falling wedge on 1D and looks like possible retest at pullback area 25.2k.
On the 12h the wedge looks like a bearish retest of the Head & Shoulders which can be viewed here: tinyurl.com
You don't have to be in a trade. Let Price show you and execute your edge.
Waiting for direction with Plan A Plan B in place.
Potential for:
Long:
Breakout of wedge with target to 31k
Bullish Retest of 25.2k zone
Short:
Bearish Retest of 25.2k with possible target to 21.5k area near the Gap between 20330 and 21110
Breakdown of current level and bearish retest for move to and breakdown of 25.2k level.
200D MA must hold to prevent further downside.
Always having Plan A and Plan B scenarios so we can react once the markets provide an opportunity to execute our edge.
If you liked this idea or if you have your own opinion about it, write in the comments.
The information and publications are not meant to be, and do not constitute, financial, investment, trading, or other types of advice or recommendations.

$BTC drop has been expected, 4Hr oversold, bounce soon?CRYPTOCAP:BTC has decent sell volume, AGAIN
Sell volume COULD be waning for the moment
Best to keep an eye on the pattern & the buys
#BTC 4Hr is pretty oversold
#bitcoin shorts covered end of May but there's a slight bump atm
#Crypto

HOW PRICE OF BITCOIN WOULD REACH FOR $34KPrice takes out the Buyside Liquidity on Tuesday and now heading for the Sellside Liquidity.
Whenever price takes a Liquidity, there is always a Higher time frame PDArray that it directly trade off from and that is the Bullish OrderBlock
I want to see price of Bitcoin to take off to $34k from the Bullish OrderBlock
Take a Look at my previous analysis on Bitcoin

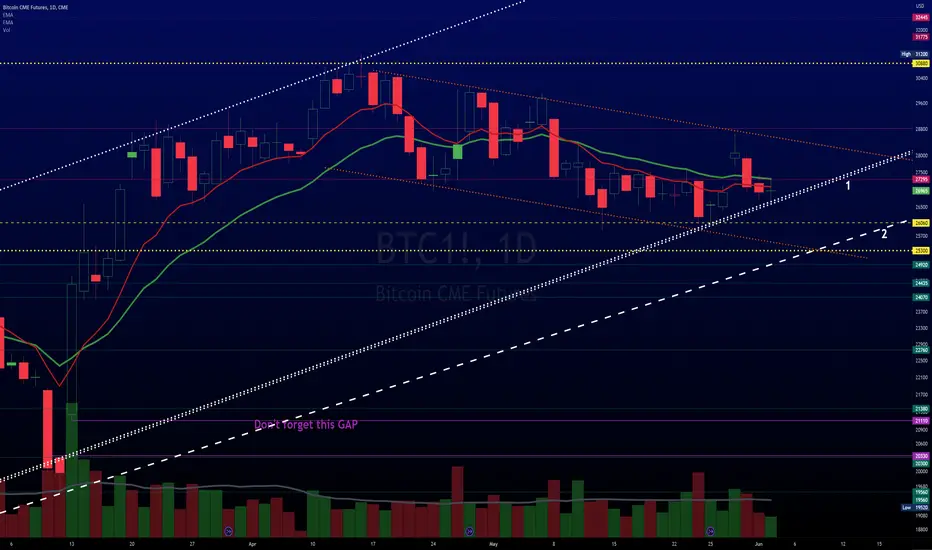
$BTC still looks okay, IMO don't listen to naysayersMany are saying #crypto doesn't look good
We've called almost every top & bottom this year, so far, & Some have been almost to the hour
IMO #cryptocurrency looks okay and is experiencing a NORMAL correction
CRYPTOCAP:BTC stuck between 2 trends atm
Which one will win?
If #1 breaks #BTC is @ 25k
#bitcoin sells have been more recently but nothing out of ordinary
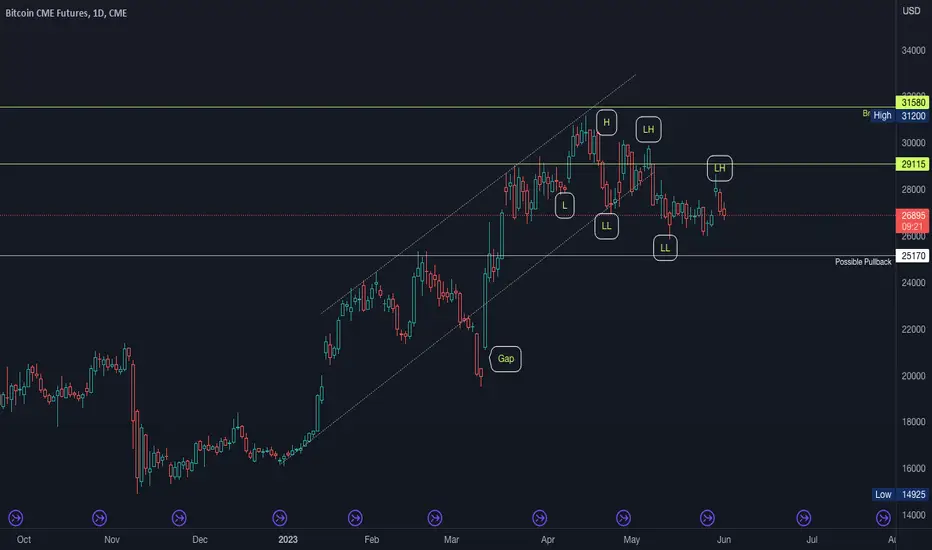
Bitcoin Head & Shoulders Still in Play!CME:BTC1!
CRYPTOCAP:BTC is still in the head and shoulders.
My original idea was posted on this link: tinyurl.com and can be referred to.
Price Action is printing a downward channel providing ideas for a possible retest at the 25.2k zone.
But the price action stays in the pattern until break of structure.
Plan A: Short to 24k and possibly 21k ... (you could possibly get higher entries if the price is going sideways).
Plan B: Long on successful retest with first target to 31k and on successful SR Flip to 45/48k!!
Step by step - let the price come to you at an area of value and enter on trigger.
Always having Plan A and Plan B scenarios so we can react once the markets provide an opportunity to execute our edge.
If you liked this idea or if you have your own opinion about it, write in the comments.
The information and publications are not meant to be, and do not constitute, financial, investment, trading, or other types of advice or recommendations.
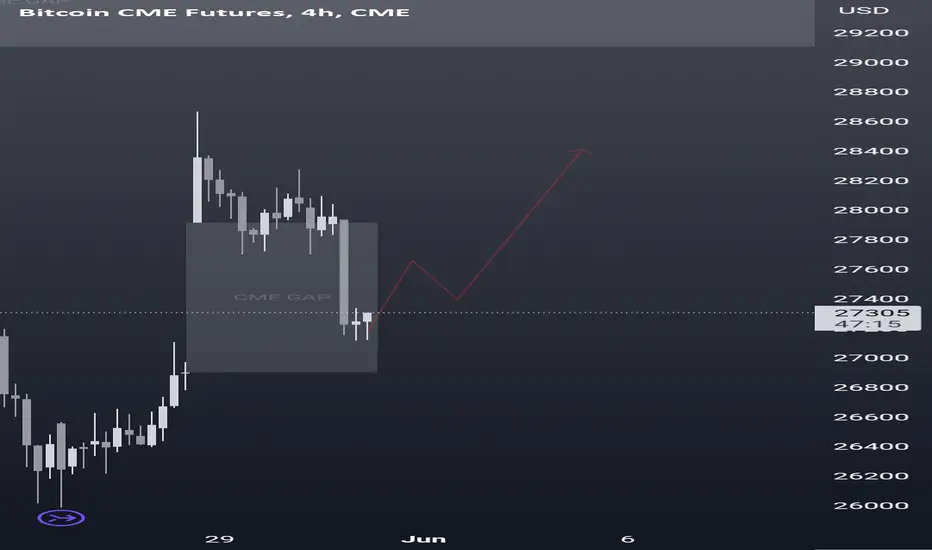
BTC CME 29000Hello, friends! I want to share the latest news about BTC. Today, a gap was closed on CME (Chicago Mercantile Exchange). Currently, the market is developing according to expectations and the scenario of closing this gap.
The levels that remain relevant at the moment are 29000 and 34440 on the upside, as well as 20300 on the downside. It is within this range that my limit orders are set.

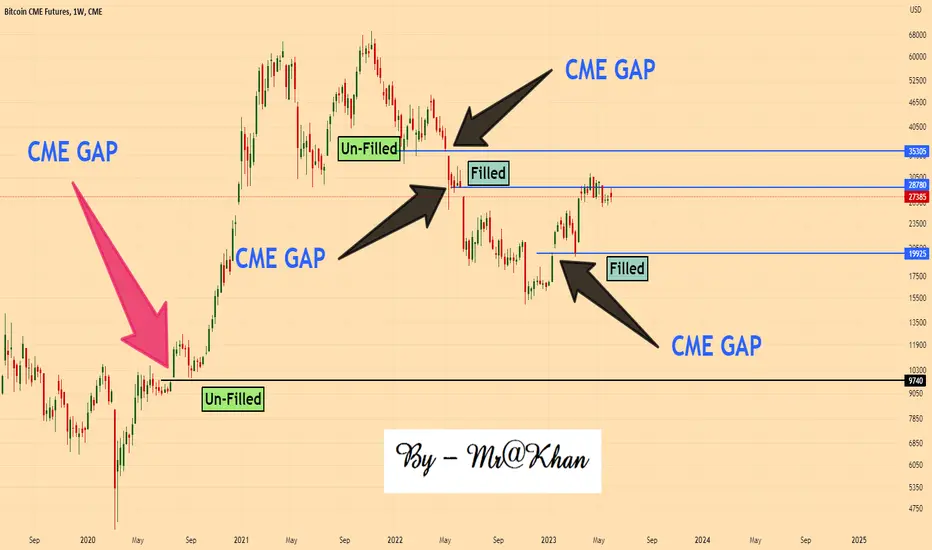
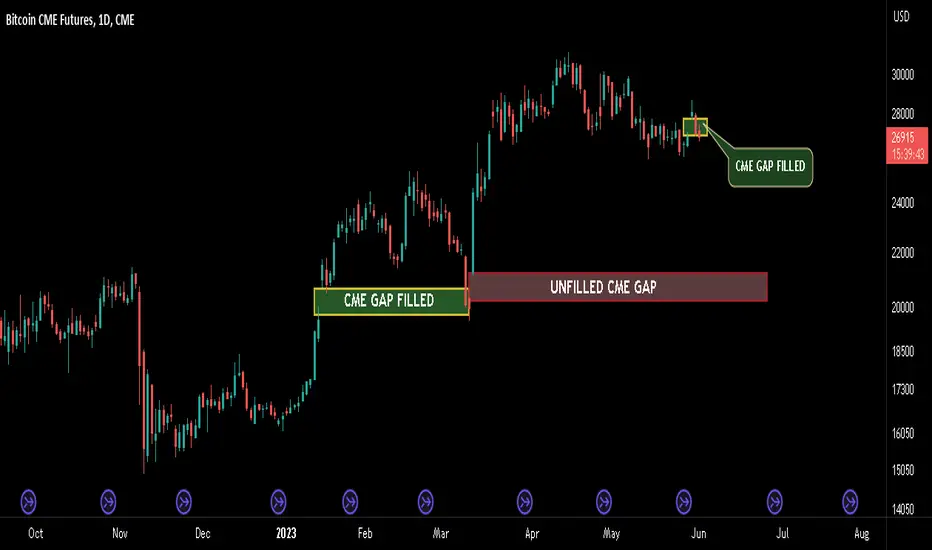
BTC CME GAP UPDATE! UNFILLED CME GAP AT $20K....Hello everyone, if you like the idea, do not forget to support it with a like and follow.
Welcome to this BTC CME update. Before moving further we must know what is CME gap and how it works. So let's try to understand it first.
What is CME Gap?
A CME gap for bitcoin refers to a price discrepancy that occurs on the Chicago Mercantile Exchange bitcoin futures chart between the closing price of one trading day and the opening price of the next trading day.
How to identify CME Gap?
Look at the chart carefully, you will see that last Friday on 26th May Price closes around FWB:27K and after that on 30th May Price opens at $27.8k which will leave a gap in the chart and yesterday we filled this gap.
Now our big question is whether all CME Gaps are filled or not. These CME gaps have a tendency to get "filled” – meaning that the market corrects back into the gap. While sources struggle to agree on the exact percentage, most of them agree that at least 60-70% of CME gaps are filled eventually.
So according to the chart, we have filled our recent CME Gap which is around the $26.8k level so there is a chance that we might see a relief rally now up to the $28k- FWB:29K from here.
But we also have a huge Gap left around $20k which might be filled sooner or later imo.
Hope this update will clear all your doubts about the CME GAP.
What do you think about this $20k Unfilled CME Gap?
Do you also think that we filled this gap sooner or later or do you think that we left it unfilled?
Share your views in the comment section.
If you like this idea then do support it with like and follow.
Thank You!
BTC filled current CME gap now what!BTC traded down and almost filled the current CME GAP...this is the best Area for BTC to pump from...if BTC started to pump then we might see it go up for another CME GAP...on 1st June U.S have debt ceiling date...if debt ceiling is raised then we'll see the market turns green..
Bitcoin CME Futures Gap Filled!Traders,
One more negative indicator has been eliminated. You'll remember that in yesterday's post I pointed out this gap created a couple of days ago. 99% of all gaps are filled, and they are usually filled sooner rather than later. To have our gap to the downside filled so quickly is rather bullish IMO. We now have a new pivot high on our daily charts on Bitcoin as well as many/most altcoins, and we are forming what appears to be bull flags on many of these same charts.
Stay tuned as always. You know where to follow me for all the latest trades. I don't always post everything here.
Stew

$BTC - Weekly (Potential Cup and Handle)I know, I know... I am quite wary of anything crypto, even the King of Crypto CRYPTOCAP:BTC but in analyzing the chart, there may be a potential Cup and Handle formation forming with a price target of 47,000.
Recall that CRYPTOCAP:BTC halves every four years and the next halving cycle is 2024.
Happy trading!

BTC CME GAP 30/5/2023There's a CME gap between 27900 - 27000. If u hv long order on hand, Move SL to Breakeven.
If you have short order can consider take profit 30-50% at this zone.
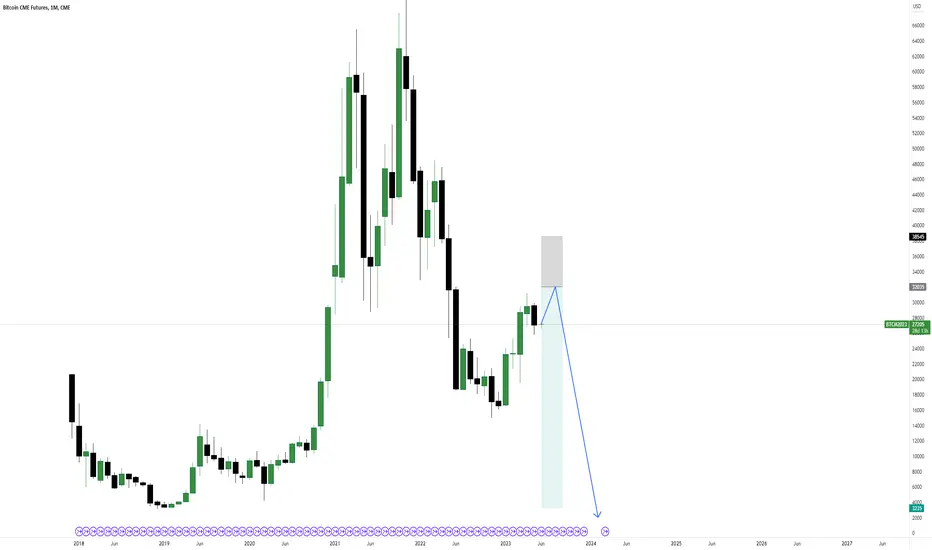
What does a bear market look like?“A bear market starts with greed, followed by confusion, sells on fear and ends with hopelessness” - By me!
'Bull markets are born on pessimism, grown on skepticism, mature on optimism, and die on euphoria." - John Templeton
Apply this bear to bull transition with good market sense because some of the bears went into hibernation, not able to wake up at all, for example the recent collapsed of some banks.
Able to recognize at what stage the market is… at any particular point helps me to determine whether to take on the market with some risks or not at all.
Reference of Bitcoin Trading:
CME Bitcoin Futures
Minimum fluctuation
$5.00 per bitcoin = $25.00
BTIC: $1.00 per bitcoin = $5.00
CME Micro Bitcoin Futures
Minimum fluctuation
$5.00 per bitcoin = $0.50
BTIC: $1.00 per bitcoin = $0.10
Disclaimer:
• What presented here is not a recommendation, please consult your licensed broker.
• Our mission is to create lateral thinking skills for every investor and trader, knowing when to take a calculated risk with market uncertainty and a bolder risk when opportunity arises.
CME Real-time Market Data help identify trading set-ups in real-time and express my market views. If you have futures in your trading portfolio, you can check out on CME Group data plans available that suit your trading needs tradingview.sweetlogin.com

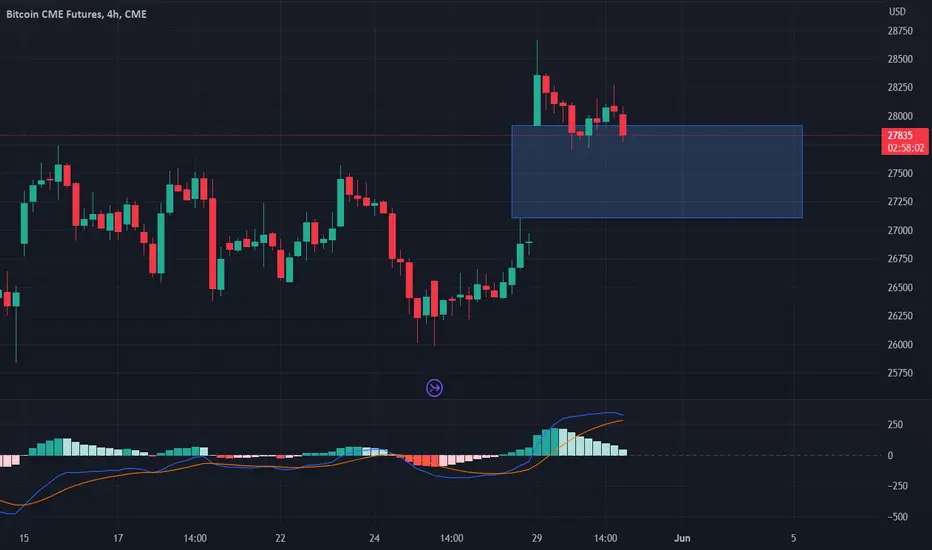
BTC CME GAP to be filled!BTC has pumped and left a huge CME GAP between 26900 & 27900..
It might pump more towards the CME GAP at $29100 and then dump to fill the CME gap which is below as mentioned above..might follow the direction which is marked.
