Extended rally off April lows should be completing imminentlyEvery so often, a market move defies conventional expectations of retracement—and the rally off the Liberation Day lows is exactly that. It’s extended longer and climbed higher than even the most bullish forecasts imagined in early April. No one remembers the calls for an imminent recession by most
About S&P 500 E-mini Futures
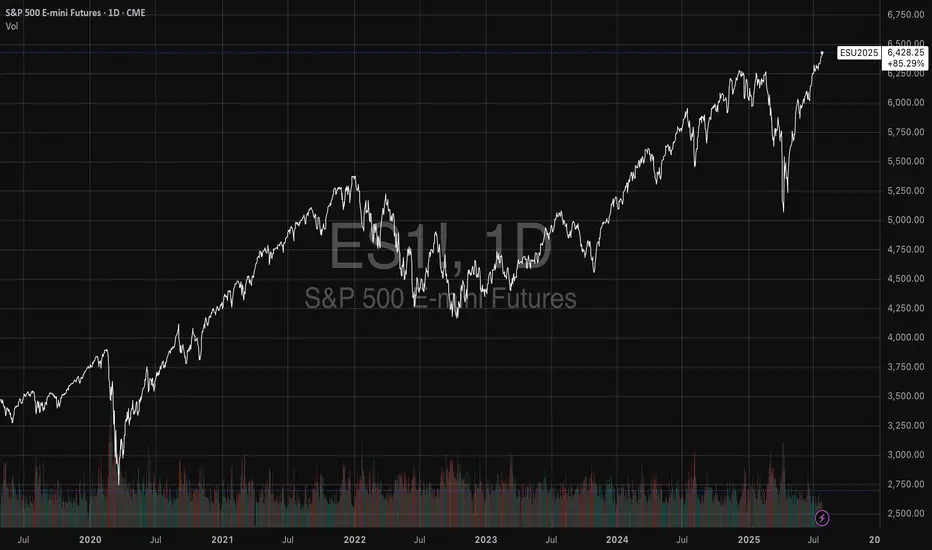
S&P 500 — short for Standard and Poor's 500, is a United States stock market index based on the market capitalizations of the top 500 companies that have common stock listed on the New York Stock Exchange or NASDAQ. With its headquarters in New York City and dating back to 1860, Standard and Poor's has offices in 23 countries and maintains the SP 500 index. Over $1.25 trillion USD is indexed to Standard and Poor's portfolio of indices, which includes the S&P 500. The S&P 500 index seeks to reflect the status of the whole stock market by tracking the return and volatility of the 500 most commonly held large cap company stocks on the NYSE, capturing approximately 80% of total market capitalization. The 500 companies comprising the SP500 span all major industries and are selected based on their market capitalization, liquidity, ability to be traded, as well as other factors. Additionally, the importance of the SP500 is highlighted by its use as an economic indicator of the health of the United States economy.
Related futures

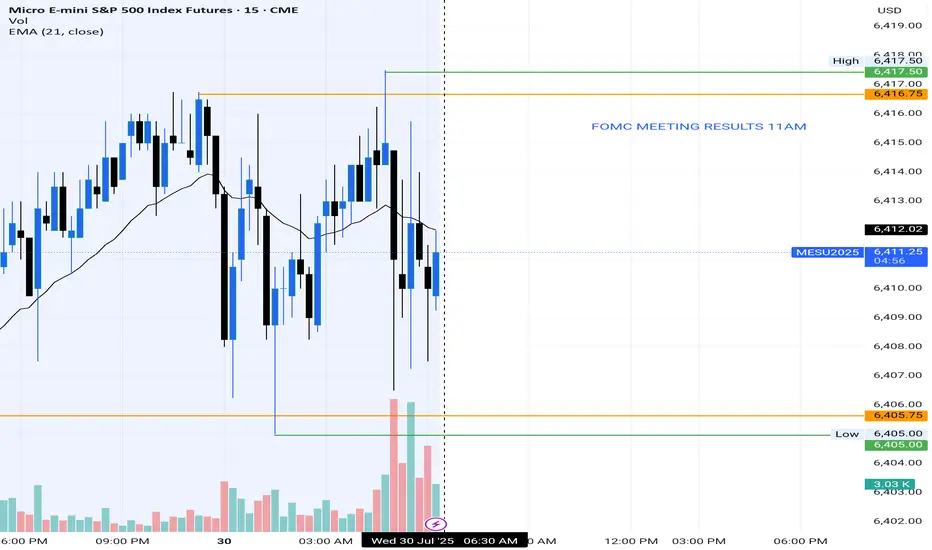
S&P 500 (ES1): Post FOMC, Buyers Pushing Back To The Highs!In this video, we will analyze the following FX market for July 31 - Aug 1st.
S&P 500 (ES1!)
In the Weekly Forecast for the S&P 500, we highlighted:
- price is bullish, and expected to go higher. It did move to ATH before pulling back.
- the sell side liquidity under the ascending lows would dr
Stop-Loss Strategies in Retail TradingA Comprehensive Scientific Analysis of Risk Management Effectiveness
This essay provides a comprehensive analysis of stop-loss strategies in retail trading environments, synthesizing empirical evidence from behavioral finance and quantitative risk management literature. Through examination of over
07/29/25 Trade Journal, and ES_F Stock Market analysis EOD accountability report: +734
Sleep: 5 hours
Overall health: Been struggling with sleep due to heat waves
VX Algo System Signals from (9:30am to 2pm)
— 8:00 AM Market Structure flipped bearish✅
— 9:30 AM VXAlgo NQ X3 Buy Signal✅
— 9:36 AM Market Structure flipped bullish on VX Algo X3! ❌

Choppy all day till 11AM PTLooks like it'll be one of those days until 11 :(
What are your thoughts?
Call trade nasdaq? Curious to know how other sectors are. I only track Mes
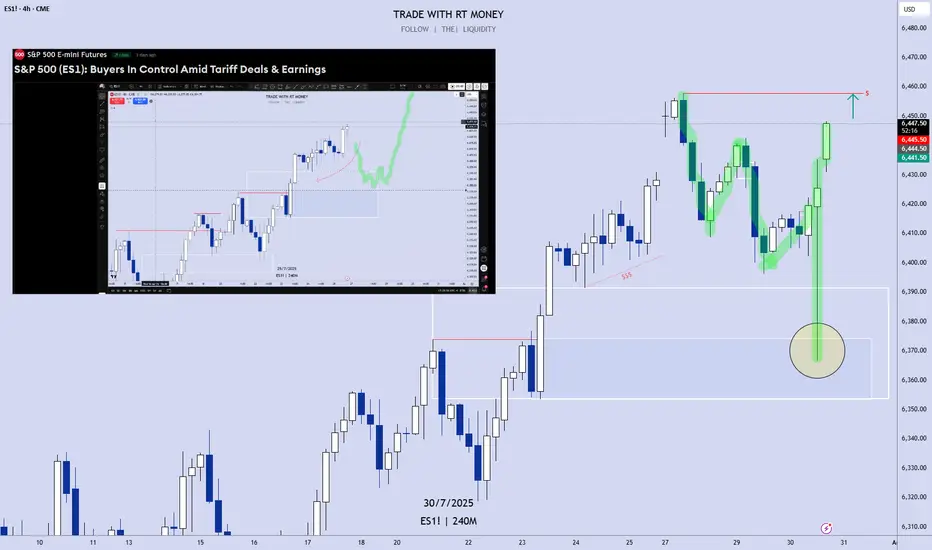
S&P 500 (ES1): Buyers In Control Amid Tariff Deals & EarningsWelcome back to the Weekly Forex Forecast for the week of July 28 - Aug 1st.
In this video, we will analyze the following FX market:
S&P 500 (ES1!)
The S&P 500 rose Friday to fresh highs, following a busy week of tariff updates and earnings. The S&P ended the week with its fifth straight record

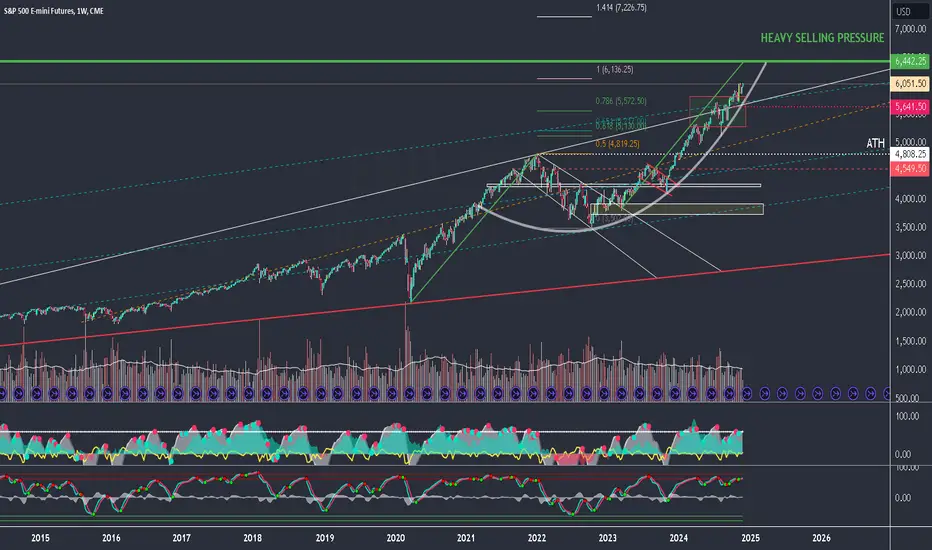
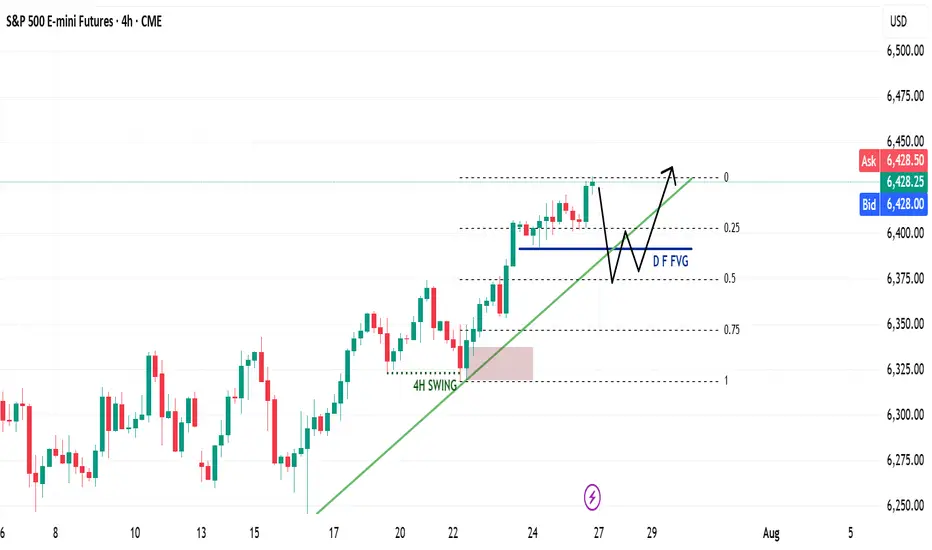
SP500 E-Mini Futures will pump to 6,442.00 and then dump hardSP500 E-Mini Futures is showing in the lower timeframes a possible continuation at least more 6,30% reaching the 6,442.00 mark and at the same time with some bearish divergences in the higher time frames that if the price gets there could iniate a pullback between 30% and 40% to bring the price back
AMP Futures - How to view Deep level 2 data (DOM)In this idea we will discuss what is required in order for you to access deep level 2 data on the Depth of Market (DOM) using Tradingview.

ES Weekly Recap & Gameplan – 27.07.2025🧭 Market Sentiment
The overall sentiment remains bullish, supported by:
• Declining inflation figures
• Trump’s pivot toward aggressive rate cuts
This shift reinforces a risk-on environment across U.S. indices.
🔙 Previous Week Recap
• ES continued its price discovery journey
• Price ran the 4H swin
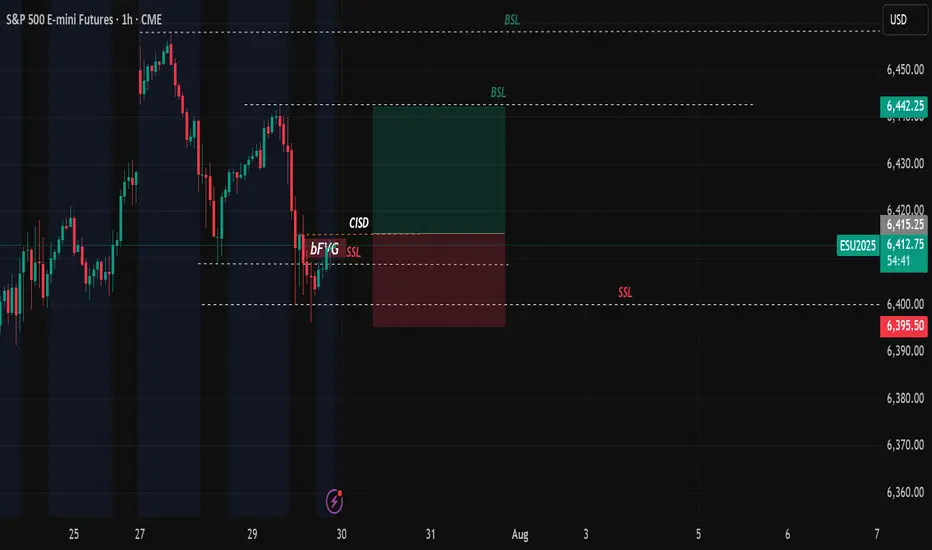
Long ES.. Probably a long in play if we cross/close above CISD as marked.. target the internal BSL as our target.. we sweep to ERL .. If you think i have drawn these incorrectly, i am happy to learn. Thank you
See all ideas
Summarizing what the indicators are suggesting.
Neutral
SellBuy
Strong sellStrong buy
Strong sellSellNeutralBuyStrong buy
Neutral
SellBuy
Strong sellStrong buy
Strong sellSellNeutralBuyStrong buy
Neutral
SellBuy
Strong sellStrong buy
Strong sellSellNeutralBuyStrong buy
A representation of what an asset is worth today and what the market thinks it will be worth in the future.
Displays a symbol's price movements over previous years to identify recurring trends.
Frequently Asked Questions
The current price of S&P 500 E-mini Futures is 6,256.25 USD — it has fallen −0.21% in the past 24 hours. Watch S&P 500 E-mini Futures price in more detail on the chart.
The volume of S&P 500 E-mini Futures is 1.54 M. Track more important stats on the S&P 500 E-mini Futures chart.
Open interest is the number of contracts held by traders in active positions — they're not closed or expired. For S&P 500 E-mini Futures this number is 1.93 M. You can use it to track a prevailing market trend and adjust your own strategy: declining open interest for S&P 500 E-mini Futures shows that traders are closing their positions, which means a weakening trend.
Buying or selling futures contracts depends on many factors: season, underlying commodity, your own trading strategy. So mostly it's up to you, but if you look for some certain calculations to take into account, you can study technical analysis for S&P 500 E-mini Futures. Today its technical rating is sell, but remember that market conditions change all the time, so it's always crucial to do your own research. See more of S&P 500 E-mini Futures technicals for a more comprehensive analysis.