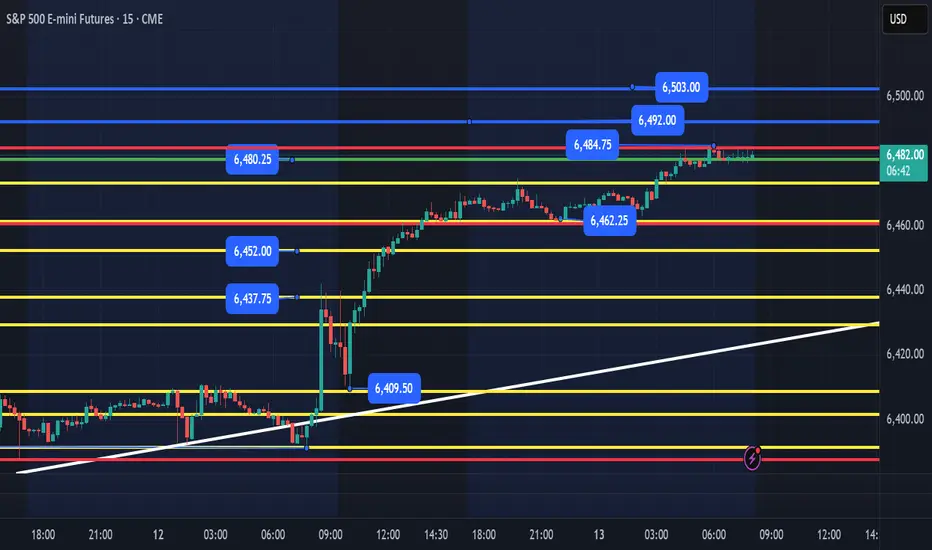
ES - August 13th - Daily Trade PlanWe built an overnight base between 6462 and 6475. We broke out of this and have grinded higher into the 6484 target we have been looking for this week. PPI coming out this am and we could keep grinding higher or Ideally we get a loss of 6462 and reclaim to setup a nice opportunity for 10+ points and retest the highs of the day and potential target 6492, 6503+.
I will update my thoughts after PPI is released. I am first looking for a flush below overnight low and reclaim or looking at 6452, 6437 or 6424 level as shown by the yellow support levels on the chart as areas we could flush and move higher. Below 6397 and we could continue lower.
My lean is we continue higher, but first need a flush to scare holders and push prices higher as we head into Friday OPEX.
Update around 10am EST.
ESH2016 trade ideas
ES Futures — Week Ahead Playbook (Aug 11–15)Macro Drivers to Watch
Tue Aug 12 @ 8:30 AM ET — CPI (July)
Key inflation print; expect sharp vol expansion in NY AM.
Wed Aug 13 @ 2:00 PM ET — FOMC Minutes
Insight into Fed’s July 29–30 meeting tone.
Fri Aug 15 @ 8:30 AM ET — PPI (July) + Retail Sales (July)
Two high-impact releases within minutes.
Geopolitics:
US–China tensions over AI chip export controls & Russian oil tariffs
Possible Alaska summit with Trump, Putin, Zelenskyy Friday.
Bias & Structure
Trend (30m / 15m / 5m): Still bullish but pressing into 6415–6425 supply / weak-high zone.
Demand below: ~6410, ~6397, ~6386, ~6374.
Supply above: ~6425, ~6442–6446, ~6460–6465.
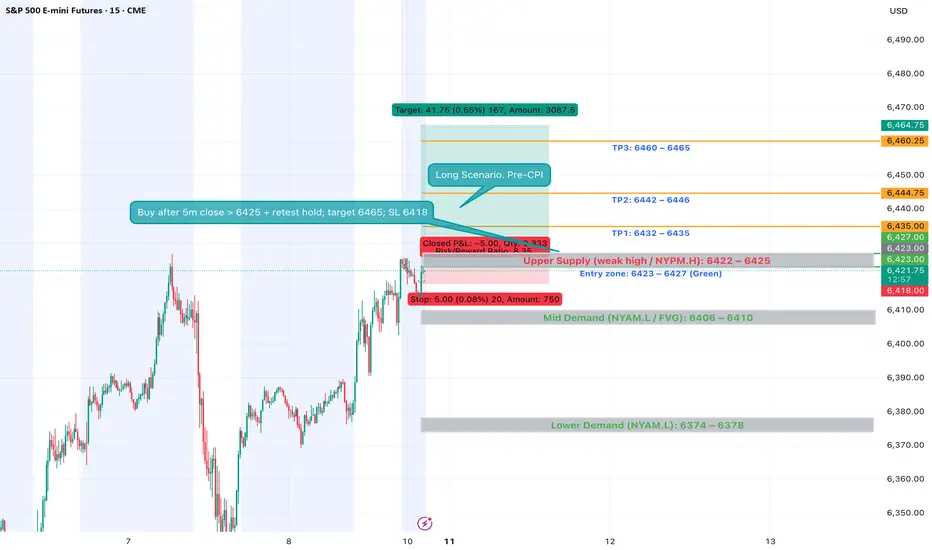
Setup 1 — Post-CPI Continuation Long
Trigger: First 5m close above 6422–6425 after CPI, then retest holds.
Entry: 6423–6427 (retest).
Invalidation: 5m close < 6418.
Targets:
TP1: 6432–6435
TP2: 6442–6446
TP3: 6460–6465
Notes: Needs bullish displacement, BOS hold, and Bookmap absorption on retest.
Setup 2 — Post-CPI Reversal Short
Trigger: Hot CPI or failed breakout → 5m close < 6406–6410, then retest from below.
Entry: 6406–6410.
Invalidation: 5m close > 6413–6415.
Targets:
TP1: 6388–6392
TP2: 6376–6378
TP3: 6358–6362
Notes: Needs trend flip on 30m/15m (CHoCH/BOS down) & heavy offer-side aggression.
Day 7 Trading Only S&P Futures — Trusting Structure Over GreedWelcome to Day 7 of Trading Only S&P Futures!
Today was a mixed day with a small loss of -$16.65. I started strong, up $133 early on, but after a big push up, I expected the market structure to flip bearish and missed a key long entry. Later, I shorted the 6451 resistance but let greed get the best of me, holding too long and turning a winner into a loss.
The key lesson? Trust the market structure and the double down (DD) signals — don’t fight the system.
📈 What you’ll learn
Why trusting structure and signals beats guessing the market
How greed can sabotage even well-planned trades
The importance of taking profits on key moves
Reading VX Algo signals for better trade timing
⏰ Timestamps
0:00 — Intro & Day 7 Recap
0:30 — Trading Wins & Mistakes
1:30 — VX Algo Signal Review
2:30 — Market News & Impact
3:30 — Key Levels for Tomorrow
🔔 VX Algo Signals (9:30am – 2pm EST)
8:29 AM Market Structure flipped bullish on VX Algo X3!
10:10 AM VXAlgo NQ X1 Buy Signal
10:20 AM VXAlgo NQ X1DD Buy Signal (double buy)
11:30 AM VXAlgo ES X1 Sell Signal
11:50 AM VXAlgo ES X1 Sell Signal
12:10 PM VXAlgo NQ X1 Sell Signal (double sell)
12:40 PM VXAlgo NQ X1 Sell Signal
📰 News Highlights
S&P 500 closes at a new record high.
🔑 Key Levels for Tomorrow
Above 6410 = Remain Bullish
Below 6390 = Bearish

AMP Futures - Heikin Ashi meets bar Replay!In this idea we will demonstrate how to access the NEW Heikin Ashi bar replay feature in Tradingview.

ES Fails to Break ATH – Possible Reversal Ahead?
The S&P 500 futures (ES) made another attempt at the all-time high but failed to push through. This rejection at resistance could signal potential exhaustion from buyers.
Key points I’m watching:
Strong rejection at ATH zone.
Momentum slowing on shorter timeframes.
Increased selling pressure in the last few sessions.
Potential for a pullback toward recent support levels.
If sellers step in with volume, we could see a healthy correction before any new ATH attempt. On the flip side, a strong breakout above this level with sustained buying could invalidate the short bias.
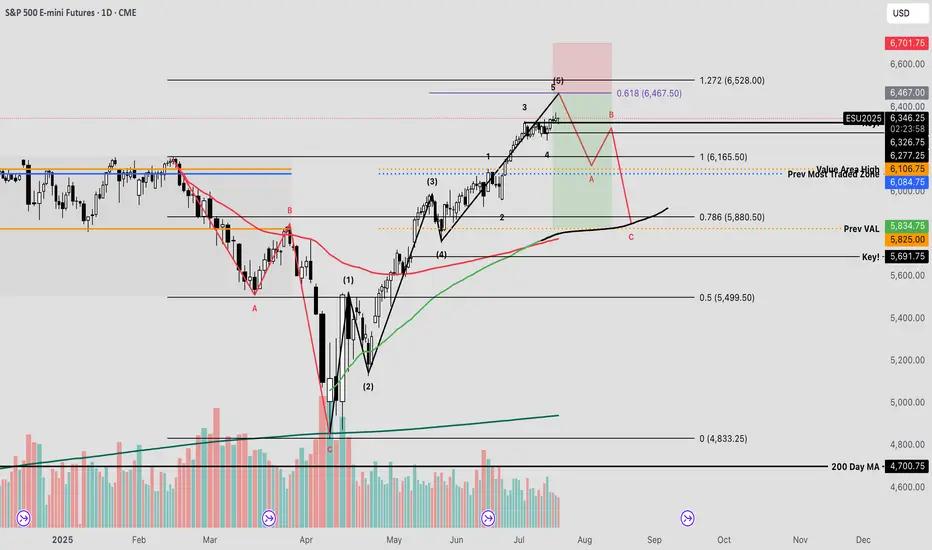
SPY The Final Countdown Since the April lows, equity markets have exhibited strong performance, with many stocks appreciating by nearly 100%—some even exceeding that threshold. Given the velocity of this rally, a corrective pullback may be imminent before the broader uptrend resumes.
The current reading on the Fear & Greed Index places market sentiment firmly within the "extreme greed" territory—historically a zone where investors often begin to lock in profits or initiate contrarian positions against the prevailing trend.
From a technical standpoint, I’ve conducted an Elliott Wave impulse analysis to evaluate the recent price structure. This method, which utilizes Fibonacci-based mathematical relationships, provides insight into the expansion and contraction phases of market cycles.
Using the trend-based Fibonacci extension tool, one can estimate potential termination zones for impulse waves. In the current scenario, the fifth wave appears to be approaching completion. By analyzing the proportional relationships between waves 1, 3, and 4, a key confluence level emerges at the 61.8% extension—commonly referred to as the “golden pocket”—just above the 6400 level on the futures chart.
I plan to set alerts at this price level to secure profits, hedge existing positions, and potentially initiate a short trade—should market structure confirm a reversal through a valid breakdown trigger.
ES Rejection Setup: Volume Profile & Fair Value Gap StrategyOn ES, it’s nice to see a strong buying reaction at the price level of 6352.00.
There’s a significant volume cluster in this area, showing strong buyer accumulation. I believe buyers who entered here will defend their long positions. If the price returns to this level, strong buyers will likely push the market up again.

Corrective Dip or New Downtrend on the S&P 500 Futures?🟣 1. Impulses vs. Corrections – The Classical View
When price trends, it doesn't move in a straight line. Instead, it alternates between directional movements called impulses and counter-directional pauses or retracements known as corrections. Most analysts define an impulse as a sharp, dominant move in the direction of the trend—typically accompanied by rising volume and momentum indicators. Corrections, on the other hand, tend to be slower, overlapping, and often occur with declining volume.
Common methods to identify impulses vs. corrections include:
Swing structure: Higher highs and higher lows suggest impulse; overlapping lows suggest correction.
Fibonacci retracements: Corrections often retrace up to 61.8% of a prior impulse.
Moving averages: Price above a rising MA is often viewed as impulse territory.
Volume analysis and oscillators such as RSI or MACD are used to confirm price behavior.
Despite the abundance of methods, the distinction between impulses and corrections often remains subjective. That’s where the Directional Movement Index (DMI) provides an objective lens—especially when paired with price action.
🟣 2. Rethinking Impulses with the DMI Indicator
The Directional Movement Index (DMI), developed by J. Welles Wilder, offers a quantitative way to assess the strength and direction of price movement. It breaks down market activity into three components:
+DMI (Positive Directional Movement Index): Measures the strength of upward movements.
−DMI (Negative Directional Movement Index): Measures the strength of downward movements.
ADX (Average Directional Index): Quantifies overall trend strength but is optional in this discussion.
The key to applying DMI lies in the crossover between +DMI and -DMI:
When +DMI > -DMI, upward price moves dominate—suggesting bullish impulses.
When −DMI > +DMI, downward moves dominate—suggesting bearish impulses.
Calculation is based on a comparison of successive highs and lows over a specific lookback period—commonly set to 14 or 20 periods.
While EMAs track trend direction and momentum, DMI helps dissect who’s in control. This makes it a powerful filter when evaluating whether a breakdown or breakout is likely to become an impulsive trend—or just another correction in disguise.
🟣 3. Case Study – Two Breakdowns, Two Outcomes
Let’s apply this logic to two recent moments on the E-mini S&P 500 Futures (ES) daily chart.
🔹 Feb 21, 2025 Breakdown
Price broke sharply below the 20-period EMA. At first glance, this looked like a potential trend reversal. The DMI confirmed this suspicion: −DMI surged above +DMI, signaling downside impulses were in control. The market followed through with a clear downtrend, confirming the move was not just a pullback—it was a shift in market structure.
🔹 Aug 1, 2025 Breakdown
A similar sharp break below the 20 EMA just occurred again. However, this time +DMI remains above −DMI, despite the bearish price action. This divergence tells a different story: the breakdown may not be impulsive in nature. Instead, it's likely a corrective dip within a broader uptrend, where buyers are still the dominant force.
This is a textbook example of how a moving average crossover without DMI confirmation can mislead traders. By combining these tools, we’re able to make more informed decisions about whether price action is signaling a true shift—or just a pause.
🟣 4. CME Product Specs – ES vs. MES
Traders can express directional views on the S&P 500 using two primary CME futures contracts: the E-mini S&P 500 Futures (ES) and the Micro E-mini S&P 500 Futures (MES). Both track the same underlying index but differ in size, capital requirement, and tick value.
✅ E-mini S&P 500 Futures (ES)
Symbol: ES
Contract Size: $50 x S&P 500 Index
Tick Size: 0.25 index points
Tick Value: $12.50
Initial Margin: Approximately $21,000 (varies by broker and through time)
Market Hours: Nearly 24/6
✅ Micro E-mini S&P 500 Futures (MES)
Symbol: MES
Contract Size: $5 x S&P 500 Index
Tick Size: 0.25 index points
Tick Value: $1.25
Initial Margin: Approximately $2,100 (varies by broker and through time)
The Micro contract provides access to the same market structure, liquidity, and price movement as the E-mini, but with a fraction of the exposure—making it ideal for smaller accounts or more precise position sizing.
🟣 5. Risk Management Matters
Understanding whether a market move is impulsive or corrective isn’t just academic—it’s the difference between positioning with the dominant flow or fighting it. Traders often get trapped by sharp moves that appear trend-defining but are simply noise or temporary pullbacks.
Using tools like DMI to confirm whether directional strength supports price action provides a layer of risk filtration. It prevents overreaction to every EMA crossover or sudden price drop.
Stop-loss orders become vital in both impulsive and corrective conditions. In impulsive environments, stops help lock in profits while protecting from reversals. In corrective phases, they act as circuit breakers against breakouts that fail.
Moreover, knowing the product you're trading is critical:
A single ES contract controls ~$320,000 of notional value.
An MES contract controls ~$32,000.
This disparity means poor sizing on ES can magnify errors, while proper sizing on MES can offer flexibility to test, scale, and hedge with tighter capital control.
Whether you're reacting to price or preparing for continuation, risk management is the only constant. It’s what turns analysis into disciplined execution.
When charting futures, the data provided could be delayed. Traders working with the ticker symbols discussed in this idea may prefer to use CME Group real-time data plan on TradingView: tradingview.sweetlogin.com - This consideration is particularly important for shorter-term traders, whereas it may be less critical for those focused on longer-term trading strategies.
General Disclaimer:
The trade ideas presented herein are solely for illustrative purposes forming a part of a case study intended to demonstrate key principles in risk management within the context of the specific market scenarios discussed. These ideas are not to be interpreted as investment recommendations or financial advice. They do not endorse or promote any specific trading strategies, financial products, or services. The information provided is based on data believed to be reliable; however, its accuracy or completeness cannot be guaranteed. Trading in financial markets involves risks, including the potential loss of principal. Each individual should conduct their own research and consult with professional financial advisors before making any investment decisions. The author or publisher of this content bears no responsibility for any actions taken based on the information provided or for any resultant financial or other losses.

Why You’re Not Successful as a Trader(And What Nobody Tells You)A lot of people want to know how to succeed at trading. They jump into day trading thinking it’s super easy. Just click a button and make money, right? And in a way, it really is that simple because every trade has about a 50/50 chance of being right or wrong. But here is the thing most people do not realize.
To be truly successful long term (a month or more) you have to treat trading like a business and perform like a top athlete.
Let me explain why by sharing a story from my own life.
Back in high school I was one of the top two athletes in my city. Imagine a sport similar to tennis. There were others who were taller, stronger, more naturally gifted in every way. But they were not as consistent as I was. That consistency gave me the edge.
Here is what I did differently.
I worked out every day building cardio and training specific muscles in my arms, shoulders, and legs for explosive power.
I practiced really difficult shots hundreds and hundreds of times. When I made those shots during games people called it luck. But I knew better. I had rehearsed those shots so much that there was almost a 99 percent chance I would make them.
I also played mind games with my opponents. I talked to them before matches and gave them false confidence by saying I had injuries or wasn’t feeling great. Sometimes I praised a shot they had but secretly I had studied it carefully and knew exactly how to counter it. I was setting them up to lose.
The stock market is just the same.
It is a competition. The market is full of opponents, other traders, institutions, algorithms, all fighting for an edge. If you want to be in the top 10 percent who consistently make profits you have to be at the top of your game mentally, physically, and emotionally.
That is why so many traders fail. They don’t realize they need to train themselves like athletes. Having the right indicators or a big account is not enough. If you are tired, stressed, or emotionally drained, you are far more likely to make mistakes.
Ask yourself.
Did I sleep well last night?
Am I managing my stress and emotional environment like family issues or distractions?
Am I exercising enough to keep my heart and mind sharp?
Am I fueling my brain with the right nutrition and supplements?
Am I constantly learning and keeping my mind sharp enough to spot patterns and make quick decisions?
For me trading is like those athlete days. I take supplements to keep my mind sharp and my emotions steady throughout the day. I aim for 5,000 to 10,000 steps daily to stay physically fit. I carefully track my sleep with my Oura ring because getting good rest is critical to trading well.
Trading is a competition you show up to every single day. If you are not in your best shape losing that day is expected. And while even top athletes sometimes lose when they are at their best losing because you were not prepared is something you cannot accept.
Knowing the rules is just as important.
I once played a match where the sun was setting right on my side during the game. The other team had sun visors allowed by the rules. We only had hats but hats were banned. That small difference made a huge impact on the outcome.
Trading has its own rules and invisible players too like the Plunge Protection Team which steps in to prevent market crashes past a certain point. There are many hidden mechanics in the market you have to understand.
For example moving averages are not just about the famous 50 and 200-day crosses. There are many subtle details about how they are calculated and used that most traders miss unless they study deeply.
So honestly ask yourself these questions.
Do I really want to succeed in this market?
Am I willing to put in the time and effort it takes?
Am I treating trading like the serious business it is?
If your answer is yes then start treating yourself like the most important asset in your trading business. Train your body and mind. Learn the rules inside and out. Practice with discipline and consistency.
Success is not going to be easy. But it will be earned.

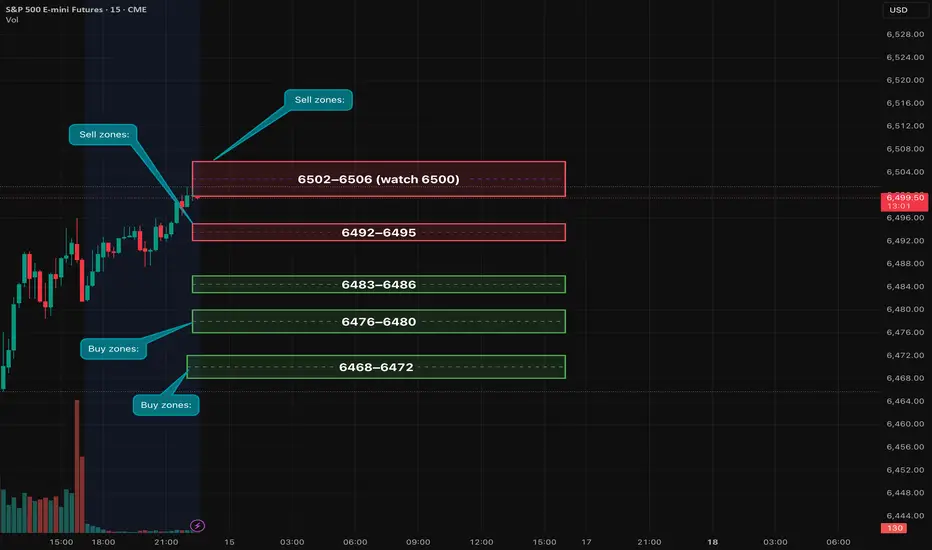
ES1! Plan — Fri Aug 15 | OPEX + U. Mich (10:00 ET). Key levelsES held above 6480 and is pressing into 6490s ahead of monthly OPEX and U. Michigan Sentiment at 10:00 ET. Yesterday’s hot PPI (3.3% YoY) keeps rates sticky; 6500 is a logical magnet/pin.
Levels:
• Sell zones: 6492–6495, 6502–6506 (watch 6500).
• Buy zones: 6483–6486, 6476–6480, 6468–6472.
A++ Setups (≥15-pt TP1):
1. Short 6492–6495 (or 6502–6506) on absorption + LH/ChoCH → TP1 6477–6480, TP2 6468–6472.
2. Long 6476–6480 (or defended 6483–6486) on absorption + HH/VWAP reclaim → TP1 6492–6495, TP2 6502–6506.
Risk: Stop 6–8 pts beyond zones or ≥1.25× 1-min ATR past last swing. Scale 40–50% at TP1; BE+2 on balance; trail swings.
Event risk: 10:00 ET U. Mich; late-day OPEX flows (14:00–16:00) and MOC around 15:50 ET.
Not financial advice.
S&P 500 (ES1!): Bullish! Look For Valid Buy Setups!In this video, we will analyze the following FX market for the week of Aug 11 - 15h:
S&P 500 (ES1!)
The S&P 500 rose Friday to close the week strong on a busy week of tariff updates and good earnings.
There is no reason to consider selling.
Wait for pullbacks to FVGs for high probability buys. Look for IRL to ERL, and repeat.
Enjoy!
May profits be upon you.
Leave any questions or comments in the comment section.
I appreciate any feedback from my viewers!
Like and/or subscribe if you want more accurate analysis.
Thank you so much!
Disclaimer:
I do not provide personal investment advice and I am not a qualified licensed investment advisor.
All information found here, including any ideas, opinions, views, predictions, forecasts, commentaries, suggestions, expressed or implied herein, are for informational, entertainment or educational purposes only and should not be construed as personal investment advice. While the information provided is believed to be accurate, it may include errors or inaccuracies.
I will not and cannot be held liable for any actions you take as a result of anything you read here.
Conduct your own due diligence, or consult a licensed financial advisor or broker before making any and all investment decisions. Any investments, trades, speculations, or decisions made on the basis of any information found on this channel, expressed or implied herein, are committed at your own risk, financial or otherwise.

Stock Index: S&P 500, Nasdaq & Dow Jones Weekly AnalysisBias For This Week:
ES: Bullish Up To $6,468.50
NQ: Bullish Up To $23,845
YM: Neutral

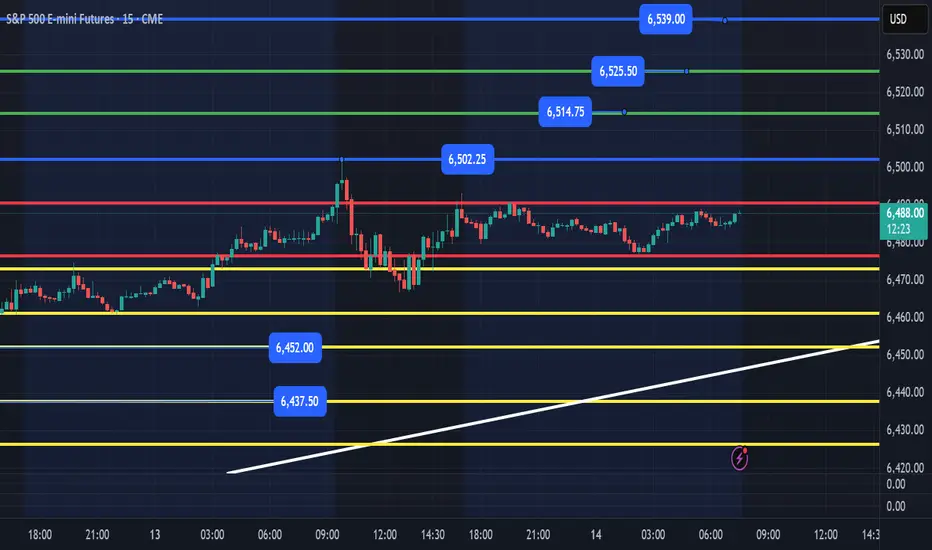
ES- August 14th - Daily Trade Plan7:25am EST
Price has built up an overnight base between 6476 and 6490. PPI coming out this am and we could keep grinding higher or Ideally we get a loss of 6477 and reclaim to setup a nice opportunity for 10+ points and retest the 6502 high yesterday with potential upside targets of 6514, 6525, 6539.
I will update my thoughts after PPI is released. I am first looking for a flush below overnight low and reclaim or we will need to see a quick flush of lower levels at 6452, 6437 or levels shown by the yellow support levels on the chart as areas we could flush and move higher. Below 6397 and we could continue lower. IF, price is falling fast, I would get out the way and let price find support at a level and put in a good base to build and work higher.
My lean is we continue higher but first we need a flush to scare holders and push prices higher as we head into Friday OPEX. I could see us potentially spiking to 6502, 6514 after PPI then come back into the overnight range after the NYSE open. I won't be guessing or chasing, I will just be focused on how price acts and will wait for my entry to enter. IF, price loses 6437 area and doesn't reclaim, it might need to head to 6409 or 6391 area to setup a strong back test.
Update around 10am EST.
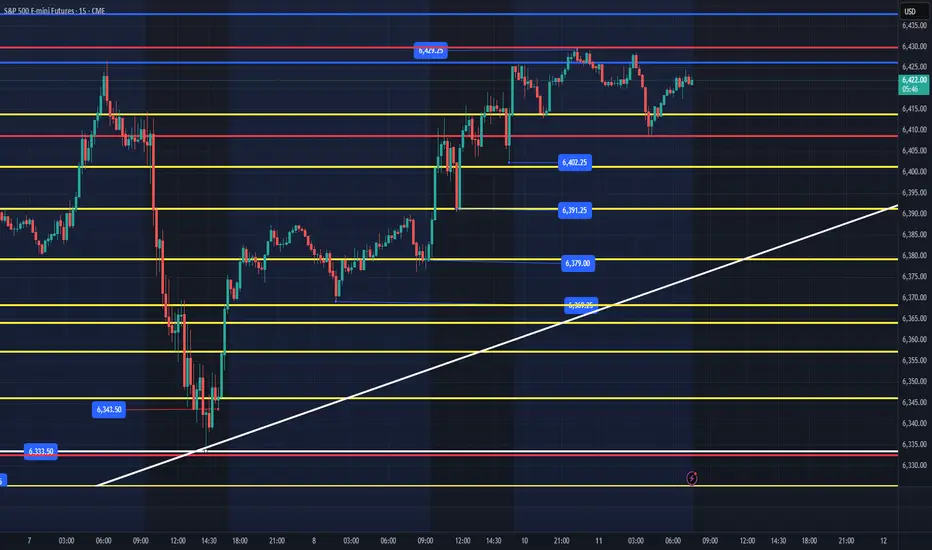
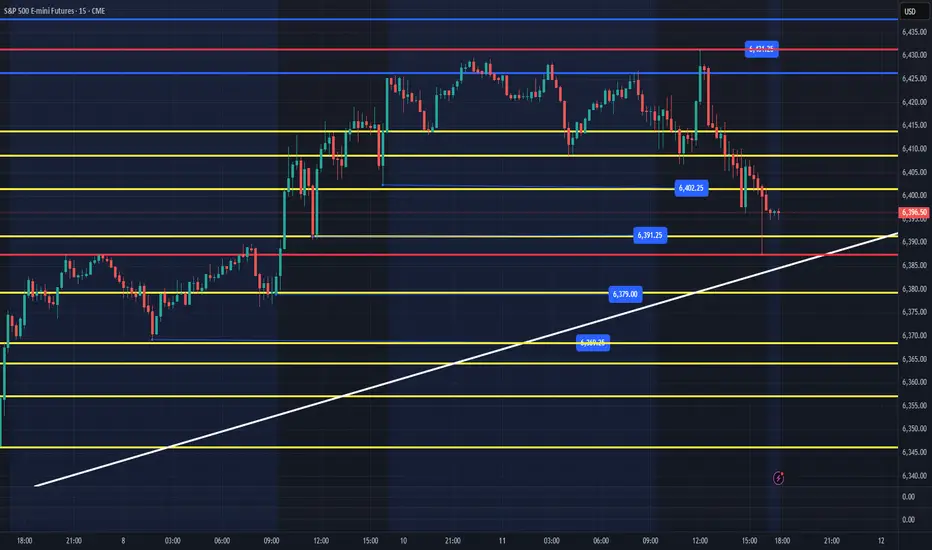
ES - August 11th - Daily Trade Plan7:30am EST - August 11th
I have posted my weekly trade plan that is available to read in the related publication section of this week daily plan posts.
I still believe that price can keep moving higher to my weekly targets of 6452, 6482. We have some economic numbers being released and its OPEX.
In the overnight session price dropped down to 6413 and bounced to 6430. When we came back down price was bought back up around 6408 and we put in a nice reclaim of the overnight low session level and rallied to 6425 around 7am.
I am looking for price to flush the 6402 level (possible 6397-99) and reclaim that level for a good 10pt+ move. I have marked the levels in yellow that I will be watching for a nice reaction to grab some points today. (6402, 6391, 6379) are the main levels I want to look for price to flush and reclaim. IF, price does break out before a pull back this am. You can look for a back test of the 6430 level as a potential entry on strength.
I will post more of an update around 10am once the NYSE opens and we see what price is trying to do in the first 30 mins.
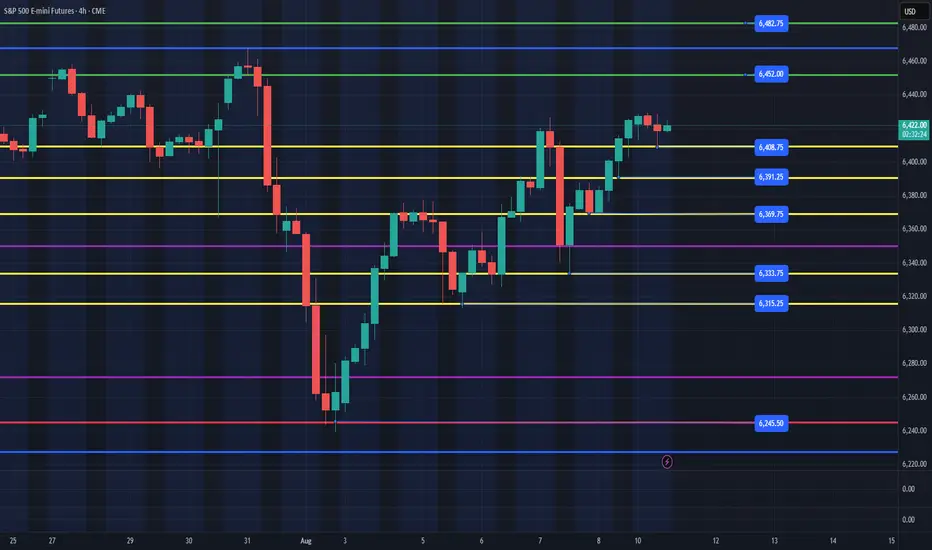
ES Weekly Trading Plan - August 11th-15th, 2025We have some upcoming key events this week.
CPI - 8:30am EST - August 12th
PPI - 8:30am EST - August 14th
OPEX - EOD - August 15th
As you can see on the 4hr chart, we have a very simple and strong up trend that institutions have been buying at the yellow lines since we bottomed around 6240 August 1st.
IF, price is to continue to be bullish, we should see some fake outs this week and buyers should step in at the areas in yellow. IF, we lose the 6333 level, then the bullish structure will have changed to short term bearish, until we can retest the 6240 level and reclaim.
I still believe that price can hit the green levels (6452,6482) this week. Big Picture, we are still in an uptrend, and we should be looking for opportunities on the daily chart to find where the institutions may be stepping in to drive price higher.
Follow for my Daily Plan that I will post by 8am EST each day this week.
ES - August 15th - Daily Trade Plan5:45am EST - Daily Trade Plan - Overnight Session
Our overnight session opened around 6488 and have grinded up to 6508 (6pts shy of original target) and are currently back testing the 6488-6492 support that was a strong resistance the past couple of days. I expect price to hold the overnight session support in red; flush then reclaim this level to continue to our targets in green above (6514, 6525). We really want to hold the next level down at the 6473 yellow support and trendline in white. Below there we will want to get out of the way, let price find a level in yellow, flush, build a base and rally after reclaiming the nearest yellow support/resistance line on the chart.
As mentioned, this week it is OPEX today. Can be a tricky trading day, so wait for price to come to the levels and work the plan as price dictates the direction it wants to go.
I will update around 10am after NYSE open settles out.

ES - August 12th Daily Plan - Session OpenWe kicked off the week with a choppy session that ended closer to the lows of the session range. 6387 - 6432 with 6414 being the magnet in between. We cant get moving to the upside until we can clear this choppy range. Price can still continue sideways until a catalyst breaks it out of this range. CPI is tomorrow at 8:30am and my lean is that we hold today's low overnight and continue to move sideways between 6387-6414. Ideally, we can flush down below 6380 and reclaim today's lows of 6387. The levels in yellow and a reclaim of the white trendline are the levels I am watching to trap shorts and move us up higher and out of the range. We will most likely get some fake outs tomorrow and I will only trade the reclaim of today's low or a level lower. I will update the plan tomorrow am before 8am EST and can provide more thoughts based on the overnight session action. Still bullish above 6333, but a loss of 6360 could be a signal that we need to go further down before we can keep momentum higher. Ideally, we build a base overnight, flush today's low and rally up to the 6430 resistance in the range.
Make sure to follow if you want to receive notifications of when I post my daily plan.
Day 8 — Trading Only S&P Futures — From -400 to +155Welcome to Day 8 of Trading Only S&P Futures!
Today was a battle of patience and discipline. I started the day with a -400 loss from an overnight short order that got stopped out before the market even opened. It was tempting to close up shop, but I traded small, stayed disciplined, and waited for the right setup.
Once I saw the X7 Sell Signal align with X3 Bearish Structure, I sized up — turning the day from deep red to +155 before fees.
📈 What you’ll learn
How to manage a big overnight loss without spiraling
The importance of sizing down until confidence returns
Using structure + signal alignment for A+ setups
Patience in clawing back losses
⏰ Timestamps
0:00 — Intro & Day 8 Recap
0:40 — The Overnight Loss & Mindset Shift
1:40 — Clawing Back With Small Trades
2:20 — The X7 + X3 Bearish Alignment Trade
3:00 — Market News & Impact
3:30 — Key Levels for Tomorrow
📰 News Highlights
DOW jumps over 400 points, VIX falls as stocks end higher on rate cut bets.
🔔 VX Algo Signals (9:30am – 2pm EST)
3:00 AM Market Structure flipped bullish on VX Algo X3!
9:30 AM VXAlgo ES X1 Sell Signal
9:42 AM VXAlgo NQ X1 Sell Signal
10:00 AM VXAlgo ES X1 Sell Signal
10:26 AM VXAlgo ES X7 Sell signal
10:30 AM Market Structure flipped bearish on VX Algo X3!
11:20 AM VXAlgo ES X1 Buy signal (double buy)
1:25 PM VXAlgo NQ X3 Buy Signal
2:13 PM Market Structure flipped bullish on VX Algo X3!
🔑 Key Levels for Tomorrow
Above 6440 = Remain Bullish
Below 6410 = Bearish

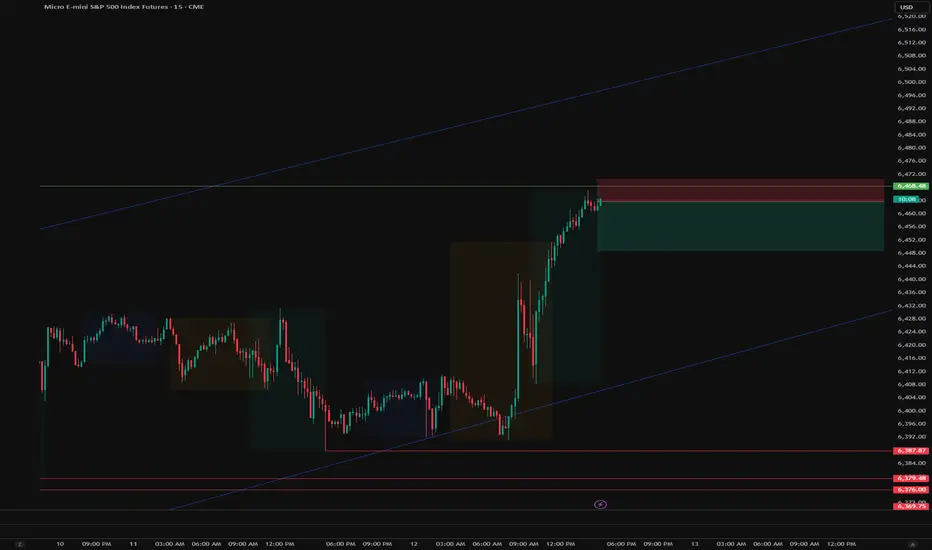
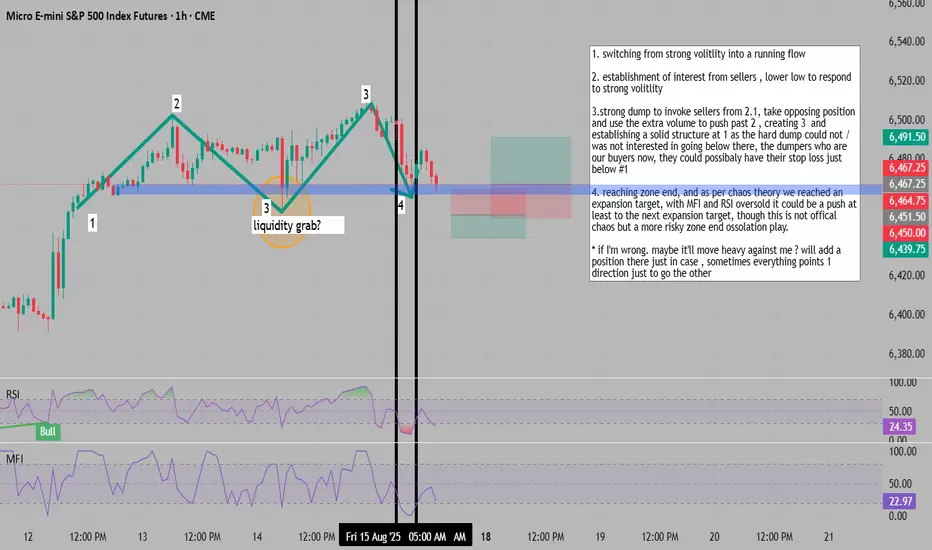
Liquididty grab points to potential big money positioning 1. **Pattern Recognition**: Identifying a transition from strong volatility into a running flow pattern.
2. **Seller Interest Established**: Lower low formation in response to the initial volatility spike, confirming seller presence at this level.
3. **Liquidity Grab and Reversal**: Strong dump designed to trigger sellers identified in point 2. Take the opposing (long) position here, using the increased volume from triggered sellers to push price past level 2, creating level 3. This establishes solid structure at level 1, as the dump showed no interest in breaking below it. The dumpers (now turned buyers) likely have stop losses positioned just below level 1.
4. **Zone End Target**: Approaching zone end with expansion target reached per chaos theory principles. With both MFI and RSI showing oversold conditions, expecting at minimum a push to the next expansion target. Note: This is an unofficial chaos theory application - a higher risk zone end oscillation play.
**Risk Management Note**: If the analysis is wrong, price may move heavily against the position. Consider adding a hedge position as insurance, as markets sometimes present all signals pointing in one direction only to reverse completely.
ES Bullish continuationHelly traders, I have seen quite a few PD arrays to anticpate long positions at the points mentioned in the chart, have your nerves strong and see for price action if your analysis say bthe same, get in! Cheers and good luck everyone.
2:1 on MES1! for an expected market miss on USD CPI yr/yrThe forecasted 2.8 USD CPI yr/yr looked too high. The 10 yr average of 2.68 and trend of market misses along with the price of oil suggested a potentially lower cpi yr/yr than forecasted. It setup for a trend following long on risk.

Day 9 — Trading Only S&P Futures — Small Win, Staying DisciplineWelcome to Day 9 of Trading Only S&P Futures!
Today was a slower day for me. I had a meeting in the morning, didn’t start trading until after 11, and took a loss right away on my first trade. Instead of forcing trades, I decided to step back, protect my gains from the week, and focus on other projects.
I still managed to close the day +93.03, keeping my consistency goal intact. The endgame here is to build a system where I can copy trade 10 accounts at once, making $100–$200 per day.
📈 What you’ll learn
Why stepping away can be a winning move
Importance of avoiding revenge trading after a loss
Long-term consistency over short-term action
Vision for scaling to multiple accounts
⏰ Timestamps
0:00 — Intro & Day 9 Recap
0:40 — Why I Started Late Today
1:20 — First Loss & Market Read
2:00 — Decision to Step Back Early
3:00 — Consistency Over Aggression
3:30 — Key Levels for Tomorrow
📰 News Highlights
Traders are still pricing in a 90% likelihood that the Fed will cut rates by 25bps next month despite the hottest PPI reading in three years.
🔔 VX Algo Signals (9:30am – 2pm EST)
8:32 AM Market Structure flipped bearish on VX Algo X3!
10:30 AM Market Structure flipped bullish on VX Algo X3!
10:57 AM VXAlgo NQ X1 Sell Signal
11:30 AM Market Structure flipped bearish on VX Algo X3!
11:50 AM VXAlgo NQ X1 Buy Signal (double signal)
12:30 PM VXAlgo ES X3DD Sell Signal
1:30 PM Market Structure flipped bullish on VX Algo X3!
1:40 PM VXAlgo NQ X1 Sell Signal
🔑 Key Levels for Tomorrow
Above 6460 = Remain Bullish
Below 6440 = Bearish

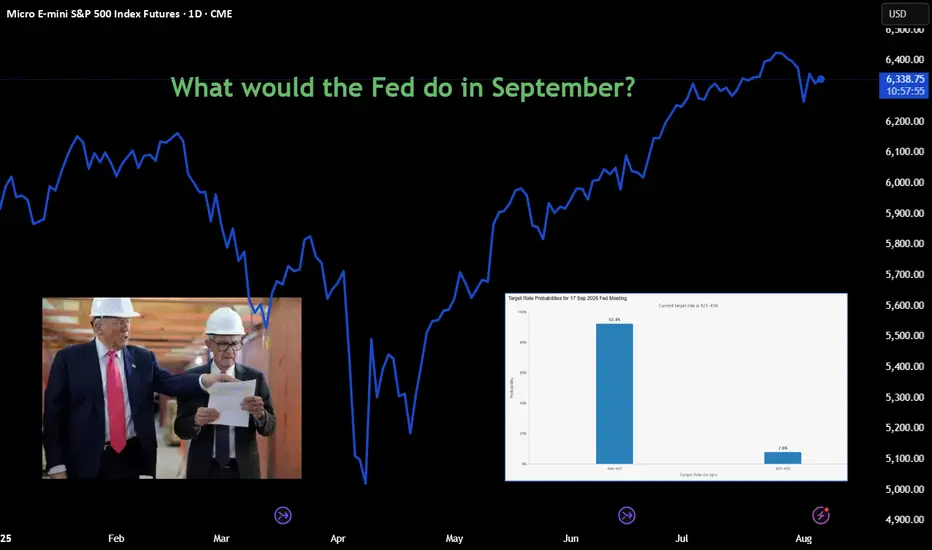
Approachable Contracts for Trading Around Fed DecisionsCME Group E-Mini S&P Options ( CME_MINI:ES1! ) and Micro S&P Futures ( CME_MINI:MES1! ), #microfutures
On July 30th, the Federal Open Market Committee (FOMC) decided to keep the Fed Funds rate unchanged at the 4.25-4.50% target range. Investors now turn their focus on whether the Fed will cut rates on the September 16th-17th FOMC meeting.
According to CME FedWatch Tool, as of August 6th, there is a 92.4% chance that the Fed will cut rates by 25 bps in September. My observation:
• Before July FOMC, market consensus was no rate cut, with the odds at 95.3% as of July 20th. Investors now overwhelmingly expect rate cuts to come at the next meeting.
• Two Fed governors broke the long-run consent and voted against the FOMC decision.
Today, I would like to explore two trading strategies focusing on the next Fed decision.
We will start by breaking down all possible Fed decisions as follows:
1) Cut rates by 25 basis points (92.4%)
2) No rate cuts (7.6%)
3) All others, such as cutting by 50 bps and raising rates by 25 bps (0%)
If we deem the 3rd option to be statistically insignificant, we now have an event with binary outcomes, namely, Cut and No Cut .
Since “Cut” is the market consensus, we will translate the possible outcomes as:
• Meet market expectations (Cut Rates)
• Exceed market expectations (No Cut)
Furthermore, financial markets will likely react calmly if the Fed decision meets expectations, while asset prices could swing widely if the FOMC exceeds expectations.
Typically, US stock market indexes, interest rate contracts and the US dollar exchange rates are very sensitive to the Fed decisions. Our discussion today will focus on stock indexes. I will follow up on the other two asset classes in future writings.
Based on the above analytical framework, we could design two sets of trading strategies:
Sell Call Options if a trader expects the Fed to cut rates
• Since the decision meets expectations, asset prices would not move a lot.
• Options may expire worthiness, which allows sellers to pocket the premium as profit.
Sell Futures if a trader expects No Cut
• Since the decision exceeds expectations, S&P prices could go down sharply.
• With build-in leverage in futures contracts, a trader could realize enhanced profit.
Now, let’s explore how to structure trading strategies using S&P futures and options.
Hypothetical Fed Decision 1: Meet Expectations
Cutting rates is bullish for S&P as it will lower borrowing costs for component companies. However, since market already priced in a Fed cut, stock prices will not move a lot.
If a trader shares this view, he could explore selling Out-of-the-Money (OTM) Call Options on CME E-Mini S&P 500 futures ( NYSE:ES ).
Each ES contract has a notional value of $50 x S&P 500 Index. On August 6th, the September ES contract (ESU5) is quoted at 6,341, making the notional value at $317,050.
• Call options at the 6500-strike are quoted at $42. By selling 1 call, options seller will receive $2,100 in upfront premium (= 42 x 50).
• Options expire on September 19th, two days after the FOMC. If ESU5 price does not exceed 6500, options seller will pocket the premium as profit.
• Warnings: selling options involves significant risks. Seller could lose more than the premium he collected. To cut losses, seller could buy back at the open market and exit the position. This will avoid losses to accumulate by expiration date.
Hypothetical Fed Decision 2: Exceed Expectations
Since rate cut is already priced in, an Unchanged decision will likely cause the S&P to fall sharply, as expected future borrowing costs will go up.
If a trader shares this view, he could explore selling CME Micro S&P 500 futures ( MSTAR:MES ).
Each MES contract has a notional value of $5 x S&P 500 Index. On August 6th, the notional value of ESU5 is $31,705. Buying or selling 1 futures contract requires an upfront margin deposit of $2,135 at the time of this writing.
Micro S&P 500 futures are 1/10 in notional comparing to its E-Mini counterpart. With smaller size and lower margin requirement, the micro contracts are more approachable for non-professional traders. At the same time, they also enjoy the leverage built-in the futures contracts. Micro S&P contracts tap into the liquidity pool with the broad S&P contract suite.
Hypothetical Trade
• Short 1MESU5 at 6,341, and set a stop loss at 6450
• Trader pays $2,135 for initial margin
A “Meet” Scenario: S&P go up 1.5% to 6,436
• Short position loss: $475 (= (6436-6341) x 5)
• The maximum loss will be $545 if the S&P moves higher, due to the stop-loss feature
An “Exceed” Scenario: S&P falls 5% to 6,024
• Short position gain: $1,585 (= (6341-6024) x 5)
• The theoretical return is 74.2% (= 1585/2135), excluding transaction fees
Happy Trading.
Disclaimers
*Trade ideas cited above are for illustration only, as an integral part of a case study to demonstrate the fundamental concepts in risk management under the market scenarios being discussed. They shall not be construed as investment recommendations or advice. Nor are they used to promote any specific products, or services.
CME Real-time Market Data help identify trading set-ups and express my market views. If you have futures in your trading portfolio, you can check out on CME Group data plans available that suit your trading needs tradingview.sweetlogin.com