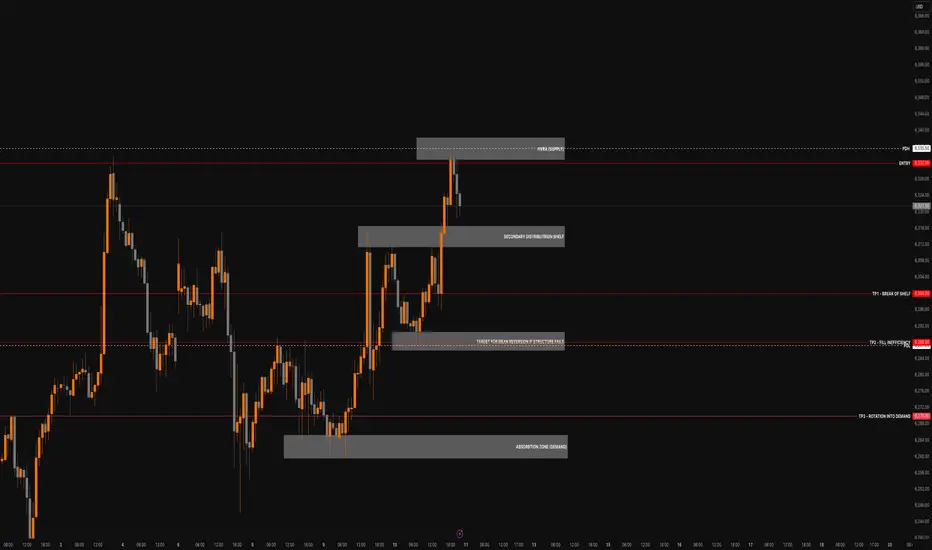
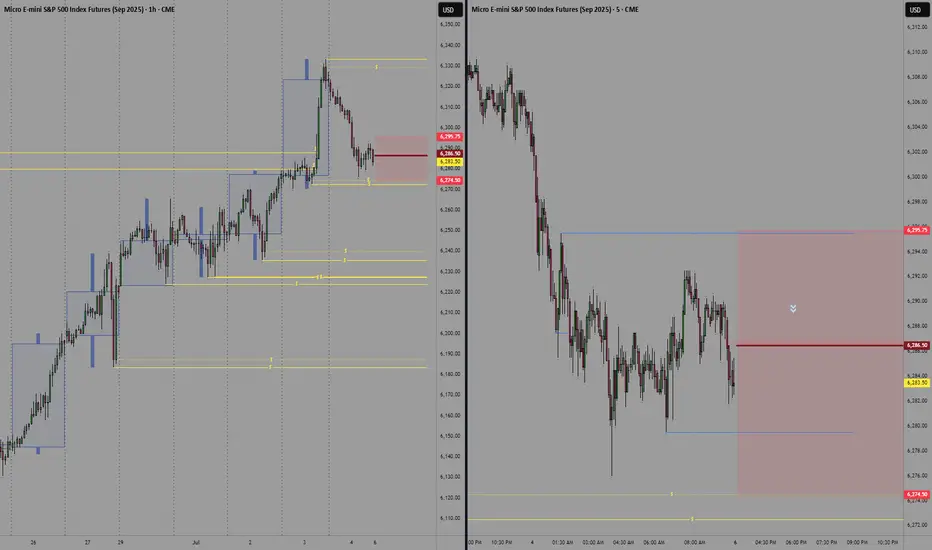
MES1! Stacked Rejection & Distribution into NY ClosePrice is stalling above PDH after tapping a clear HVRA (Supply) zone. We’re seeing layered rejection with a Secondary Distribution Shelf forming beneath it a classic signature of trapped longs and passive seller absorption.
If structure fails to hold above the rejection zone, we expect a reversion through the inefficiency and potential rotation into the demand base.
Key Zones & Structure
HVRA (Supply): 6345–6355 – Liquidity exhaustion, failed breakout
Secondary Distribution Shelf: 6315–6325 – Trap zone, weak re-test
Mean Reversion Target: 6285–6295 – Execution gap, inefficient rotation
Absorption Zone (Demand): 6260–6275 – Institutional long buildup
Bearish Trade Idea
Entry: 6332 (within HVRA)
Stop: 6342 (above HVRA high)
TP1: 6300 – Break of shelf
TP2: 6288 – Fill inefficiency
TP3: 6270 – Rotation into demand
R:R: Approx. 1:2.8 / 1:4.2 depending on target
Staakd Outlook
Stacked rejection with no volume follow-through above PDH. Unless NY reclaims 6330+ with force, structure favoUrs reversion to inefficiency and absorption zone below.
Follow for post-session confirmation and Friday morning bias update.
Staakd Bias: Bearish Lean ★★★★☆
ES1! trade ideas

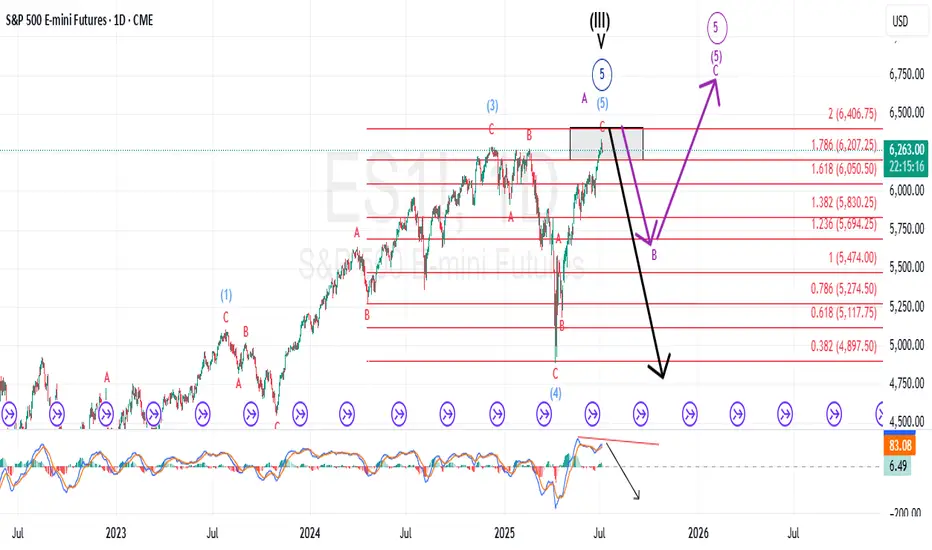
Accumulation to Acceleration ESThis chart shows a long-term market analysis using Elliott Wave Theory, suggesting the market is currently in Wave 4 and preparing for a big Wave 5 rally.
📈 Past yearly moves averaged 15–21%, with 30%+ currently and up to 66% historically.
🟩 A "rebalance" zone (accumulation phase) is forming before a possible breakout.
📊 The next move projects a +60% rally, targeting 7,112 to 7,570.
🔁 Historical patterns and past rallies are being used to support this bullish forecast.
Bottom line: If history repeats, a strong upward move is expected soon.

AMP Futures | OCO Bracket orders with Chart Trading.In this idea we will demonstrate how to apply an OCO bracket order on the Chart trader using TradingView.

DIYWallSt Trade Journal: Starting Down $400 & Patience Pays Off 07/09/25 Trade Journal, and ES_F Stock Market analysis
EOD accountability report: -271
Sleep: 4.5 hours
Overall health: Good
VX Algo System Signals from (9:30am to 2pm) 4/4 success
10:00 AM VXAlgo ES X1 Sell Signal
10:36 AM VXAlgo ES X3 Sell Signal
11:00 AM Market Structure flipped bearish on VX Algo X3!
1:33 PM Market Structure flipped bullish on VX Algo X3!
What’s are some news or takeaway from today? and What major news or event impacted the market today?
I took some short positions overnight and got caught in the big push up this morning and started the day with -400, I was very tempted to go big and tried to trade it back but decided it was better off just to wait for a better day to recover the account instead.
Consider yesterday was a big manipulation day and today was another one but squeezing to the upside for a rug pull downwards.
News
*(US) FOMC JUN MINUTES: COUPLE OF PARTICIPANTS NOTED THEY WOULD BE OPEN TO CONSIDERING A RATE CUT AS SOON AS THE JULY MEETING IF DATA EVOLVE AS THEY EXPECTED (Bowman and Waller have said as much since the FOMC meeting)
What are the critical support levels to watch?
--> Above 6290= Bullish, Under 6280= Bearish
Video Recaps -->https://tradingview.sweetlogin.com/u/WallSt007/#published-charts

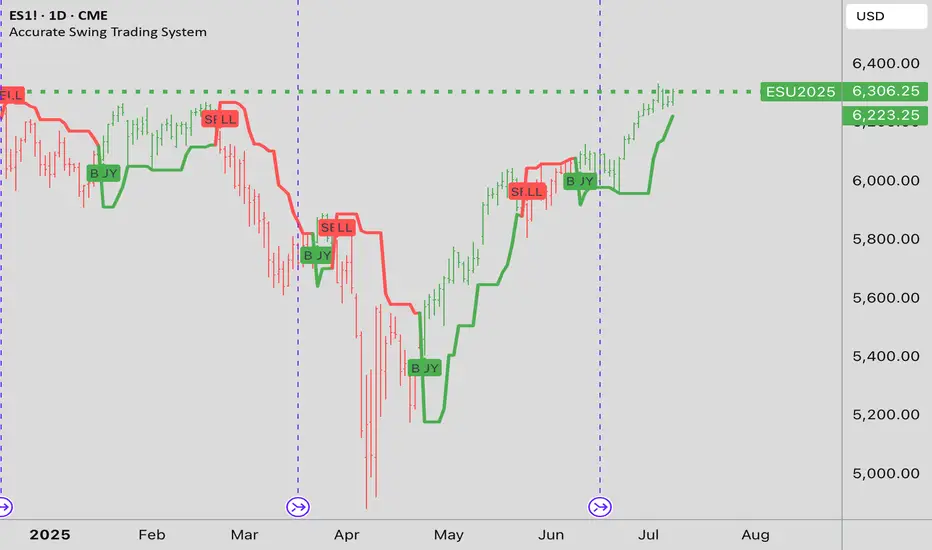
In forty years of trading, I have tried a lot of methods....In forty years of trading, I have tried a lot of methods. Over the years, things have changed. Right now, I swing trade S & P 500 Index ETFs through a commission free broker off this chart
GLOBEX FUTURES and this one single indicator. I always enter after the daily close, in the aftermarket. Trade at a price, a limit order "all or none". NOTE: You must chart FUTURES to get the signal at 6:00 PM NYC time in order to have it to position in the aftermarket. if you, chart SPX cash market, the TradingView "runtime" won't show the signal until the RTH opening "tomorrow". NO GOOD ...because overnight trading can gap the cash market. Try 5 minute chart for DAY trading Futures: use only RTH ! try configuring 3, 7, and 13, "swing" values. Happy trades! P.S. I am long right now SPX ETF.
How to Spot Flag Patterns on TradingViewLearn to identify and trade flag patterns in TradingView with this step-by-step tutorial from Optimus Futures. Flag patterns are continuation formations that help traders join existing trends by buying high and selling higher, or selling low and buying back lower.
What You'll Learn:
• How to identify bullish and bearish flag patterns on any timeframe
• Breaking down flag patterns into two parts: the flagpole and the flag
• Finding strong flagpole formations with fast, obvious price moves
• Spotting flag consolidation areas that form tight ranges
• Why flag patterns work: buyer and seller psychology explained
• Real chart examples showing how flag patterns develop and play out
This tutorial may help futures traders and technical analysts who want to trade with market trends rather than against them. The concepts covered could assist you in identifying opportunities to join strong price movements when they pause before continuing.
Learn more about futures trading with Tradingview: optimusfutures.com
Disclaimer:
There is a substantial risk of loss in futures trading. Past performance is not indicative of future results. Please trade only with risk capital. We are not responsible for any third-party links, comments, or content shared on TradingView. Any opinions, links, or messages posted by users on TradingView do not represent our views or recommendations. Please exercise your own judgment and due diligence when engaging with any external content or user commentary.
This video represents the opinion of Optimus Futures and is intended for educational purposes only. Chart interpretations are presented solely to illustrate objective technical concepts and should not be viewed as predictive of future market behavior. In our opinion, charts are analytical tools—not forecasting instruments. Market conditions are constantly evolving, and all trading decisions should be made independently, with careful consideration of individual risk tolerance and financial objectives.

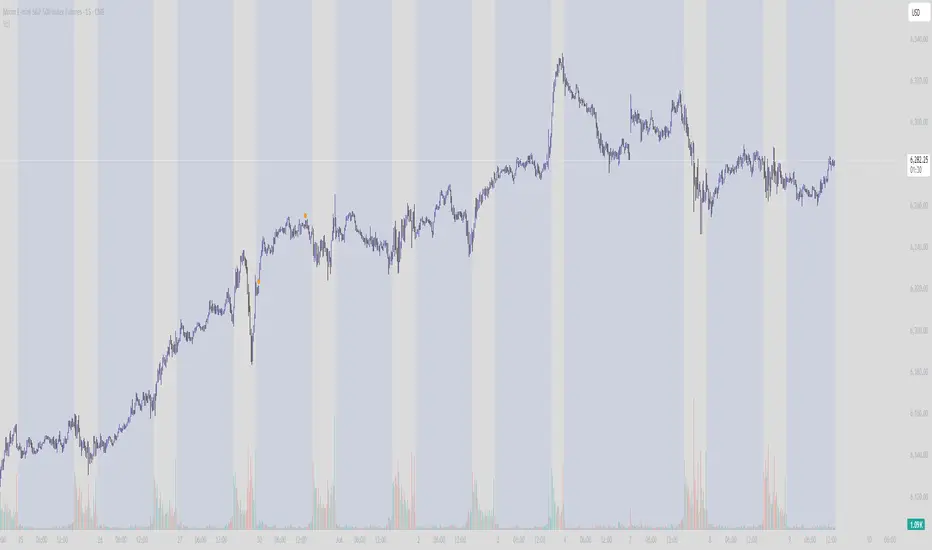
Backtest $ES 15 minTest for analysis of trend with OBR in 15 min. Testing the possibility to OBR in NYSE:ES
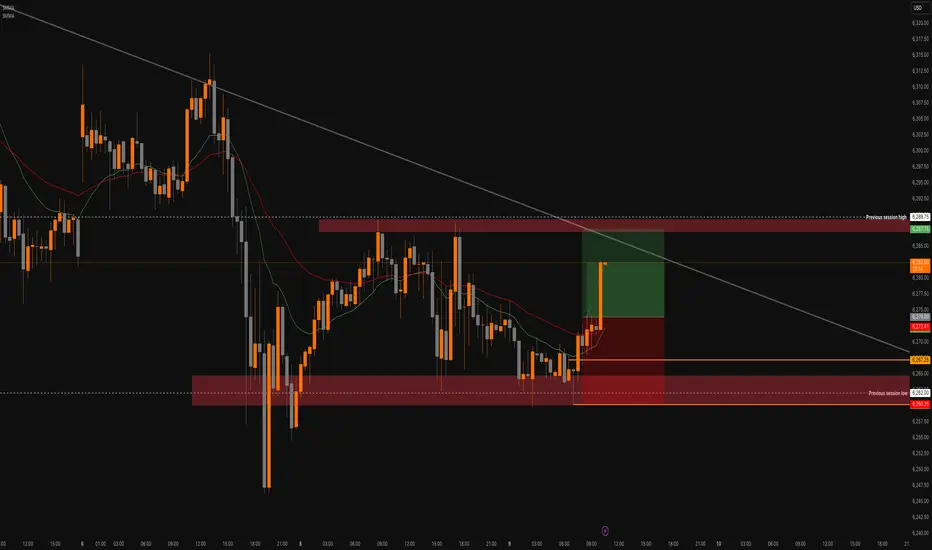
MES Futures – ORB Strategy Long from London Open Range BreakDescription:
Executed a clean ORB long trade on MES during the London session, with confirmation from the 5-min chart and structure mapped on the 15-min.
Setup Breakdown:
Session: London Open
Strategy: Opening Range Breakout (ORB)
Entry: Break of ORB high with confluence from 15-min demand zone + EMA support
Stop: Below session low and structural demand
Target: Previous session high & key 1HR supply zone
T echnical Context:
Price rejected from previous session low and formed a clear ORB range.
After consolidation, a strong bullish candle broke above the range high with increasing volume and EMA cross.
Trade was managed up to the previous session high and partials secured before price met the diagonal resistance trend line.
Key Zones:
✅ Entry Zone: 6270.00
🟥 Stop Loss: ~6260.25
🎯 Target Area: 6287.75 (Previous Session High)
🟥 15-min Supply overhead could pose resistance
Staakd Rating: ★★★★☆
(Rated 4/5 for textbook ORB play, clean risk:reward, and structure alignment)
DXY, EURUSD, ES1! Daily Trade SetupsIn this update we review the recent price action in the Dollar Index, EURUSD & E-mini SP500 and identify the next high-probability trading opportunities and price objectives to target. To review today's video analysis, click here!

Wait and seeThe S&P 500 daily chart structurally is in a “wait and see”mode. It is waiting for additional information regarding tariffs and the Fed minutes coming out on Wednesday. I think the bias is still for moved to the upside.

07/08/25 Trade Journal, and ES_F Stock Market analysis EOD accountability report: +220
Sleep: 7 hours
Overall health: Good
VX Algo System Signals from (9:30am to 2pm) 4/4 success
— 9:30 AM Market Structure flipped bullish on VX Algo X3! :check:
— 10:30 AM VXAlgo NQ X1 Buy Signal :check:
— 12:24 PM Market Structure flipped bullish on VX Algo X3! :check:
— 1:30 PM Market Structure flipped bearish on VX Algo X3! :check:
What’s are some news or takeaway from today? and What major news or event impacted the market today?
After taking losses, I usually set a lock out on my account after $200 profit to build back small wins and confidence. so luckily I was locked out pretty early today and avoided most of the market whipsaw. But on days like these, if you don't walk away after you make money, you could eventually get triggered and tilted by the whipsaw. a lot of orb traders probably died today.
News
*HOWARD LUTNICK ON TARIFFS: EXPECT ANOTHER 15-20 LETTERS TO GO OUT OVER THE NEXT 2 DAYS- CNB
*Trump announces 50% tariff on copper imports, threatens 200% tariff on pharmaceuticals and maybe chips
What are the critical support levels to watch?
--> Above 6280= Bullish, Under 6260= Bearish
Video Recaps -->https://tradingview.sweetlogin.com/u/WallSt007/#published-charts

Watch me trade NQ LIVE!This is a just a quick video showing what I look for in order to take a trade.
I entered a short on NQ minutes ago, looking for 2.44 RR!
Apologies for this rough cut video. It was spur of the moment, and I wanted to share with my followers and viewers!
Enjoy!
May profits be upon you.
Leave any questions or comments in the comment section.
I appreciate any feedback from my viewers!
Like and/or subscribe if you want more accurate analysis.
Thank you so much!
Disclaimer:
I do not provide personal investment advice and I am not a qualified licensed investment advisor.
All information found here, including any ideas, opinions, views, predictions, forecasts, commentaries, suggestions, expressed or implied herein, are for informational, entertainment or educational purposes only and should not be construed as personal investment advice. While the information provided is believed to be accurate, it may include errors or inaccuracies.
I will not and cannot be held liable for any actions you take as a result of anything you read here.
Conduct your own due diligence, or consult a licensed financial advisor or broker before making any and all investment decisions. Any investments, trades, speculations, or decisions made on the basis of any information found on this channel, expressed or implied herein, are committed at your own risk, financial or otherwise.

Profit takingMondays structure in the S&P 500 daily chart implies profit-taking in a move back toward the upside is expected.

Market UpdateI have had no trade signals on my strategy for two days.
The market is very so but it will not last forever.

Are We Completing the Larger Ending Diagonal Now?The last time I updated followers of my work; I stated that the pattern was advancing, but NOT with confidence, and that it is marked with choppy, overlapping price action that appears to be an ending diagonal. Those sentiments have not changed.
However, what has changed is I was forecasting a more pronounced drop first before getting to new highs. It is now possible; this move higher is completing that move on a more immediate basis. Although I cannot rule out the previous larger ABC... it is more likely once this high completes, it could represent the end of the bull market.
Only the structure of the decline will inform us what is playing out.
I will warn followers that once this more immediate high completes, I am expecting a forceful and swift reversal that will undoubtedly catch most traders off guard.
Best to all,
Chris
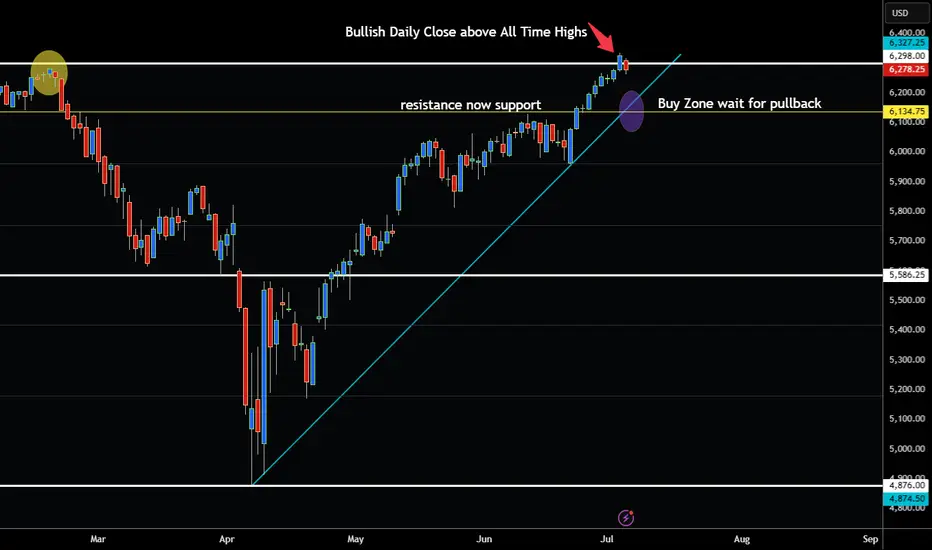
S&P 500 BULLISH BREAKOUT ABOVE ALL TIME HIGHS!Hey Traders taking a look at the S&P500 this week it is clear that we are in a strong bull market.
Notice that we broke above 6300 on the ES Futures Contract last week on July 3. This level is extremely important because it was the all time high from Feburary 2025. So now that the market has closed above this level buying opportunities can be considered at the trendline.
6135-6150 look like a good place to grab this bull again by the horns. 😁
So if your bullish wait for the pullback no need to chase the market imo. Eventually it will pullback lets see what happens July 9 WED with the Tarrifs.
Expect Volatility!
However if your bearish be very careful I don't think there is a good risk to reward ratio to shorting at this time.
Good Luck & Always use Risk Management!
(Just in we are wrong in our analysis most experts recommend never to risk more than 2% of your account equity on any given trade.)
Hope This Helps Your Trading 😃
Clifford
Stock Index: ES, NQ, YM Weekly Update📈 S&P 500, Nasdaq & Dow Jones – All-Time Highs, But Caution Creeping In
🟩 S&P 500 | Nasdaq | Dow Jones
All three indices hit new all-time highs to close out June.
Powered by:
🔋 AI optimism
💰 Solid earnings
🕊️ Dovish Fed tone and falling bond yields
SPX continued its breakout run
Nasdaq surged as big tech led the charge
Dow followed with slower but steady strength
⚠️ But Watch the Signs Beneath the Surface
Consumer confidence dropped sharply
Home sales weakened
Fed speakers remained non-committal on cuts
All three indices now look extended — particularly Nasdaq
Momentum remains bullish, but these rallies are now resting on softening macro, yield compression, and hope that the Fed stays on hold.
🧠 Key Takeaway
Price action is euphoric — but fundamentals are flashing mixed signals.
When tech leads the market at extremes, volatility risk is elevated.

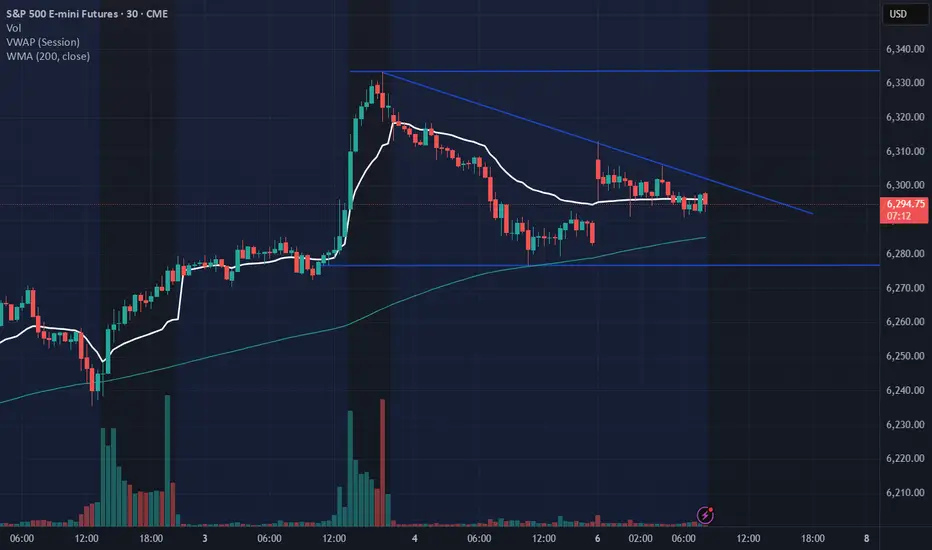
ES1! S&P500 Might Lose Momentum As Tariffs Deal Not Set...price could probably be testing all time highs. Before plunging....
if the volumes comes with it and reaches the all times high levels, that could be a nice short entry point for potential profits.
Otherwise, it could probably just fill the gap on week open and keep going down in a regular pattern until August as Trumps Tariffs Deals deadline is around that time possiblily...
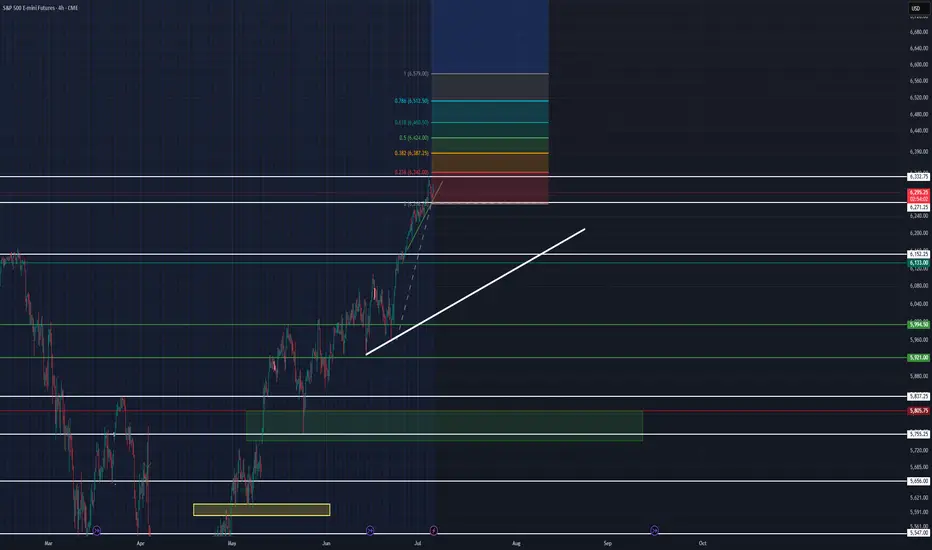
14 day look ahead at ES spy futures
CME_MINI:ES1! I am watching fundamentals and any incoming tariff news this week (mostly for scalps on small timeframes). This is because of the Japan news reaction we saw last week which presented good opportunity.
Bear: I am watching price seek possible consolidation up here after being bullish at a strong upwards angle. I see small exhaustion being cooled off and possibly looking for more cooling until the middle of this week, I expect no serious price movement until Wednesday July 9, 2025. Watching that 4h green slanted trendline to break for scalping opportunities. If the white larger trendline is broken I will be considerably more bearish that we would likely reach a price of 5,805 or lower again, this would be a lot to ask but it is a location I would assume price would find solid support if reaching that area in the future weeks/ month. Watching horizontal lines for support this week specifically at price 6,271 to be broken or held. There looks like there is some slim price action (little support or resistance) from 6,100 to where we are now. This could push the downward volume quicker to the downside possibly presenting great opportunity for bears in the possible near future, if we break down below 6,197.
Bull: we are clearly in a macro bullish trend it is silly to decide we would all of a sudden drop significantly unless something obscene happens fundamentally. I step into this week assuming we will keep strong upward trendlines far above the macro (my white thick) trendline. watching fib extension levels for more upside since we are consolidating a bit already it would be easy to assume we will jump up to the .236 at 6,342 and even get to the .382 at 6,387 and higher. I still expect the ADX to cool down here in the beginning of the week if not all week. I also assume to see the rsi finish its bearish divergence off with a strong predicted sell off- but to reach higher highs after (buy the dip, trade the reaction, WAIT for the dip).
ES Short to 6274.50Grabbed 1 hour BSL on a shortened July 3rd trading day.
5 minute bearish market structure shift
1 hour bearish inverse fair value gap
Technicals ^
Participants ran the market higher into all time high's during the holiday week. Gathered shorts, and targetting 6274.50 as a meaningul 1 hour SSL level. Confluences with prior London open.
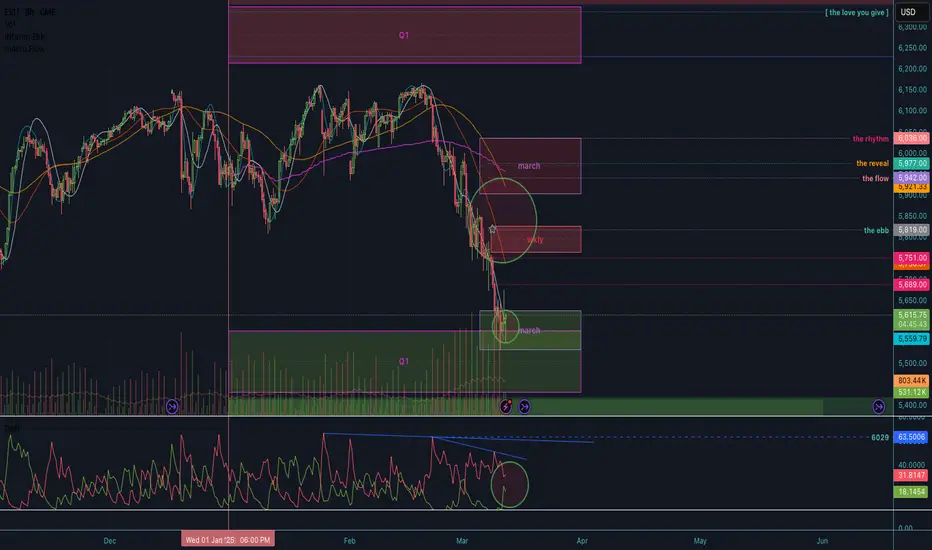
Logic ^
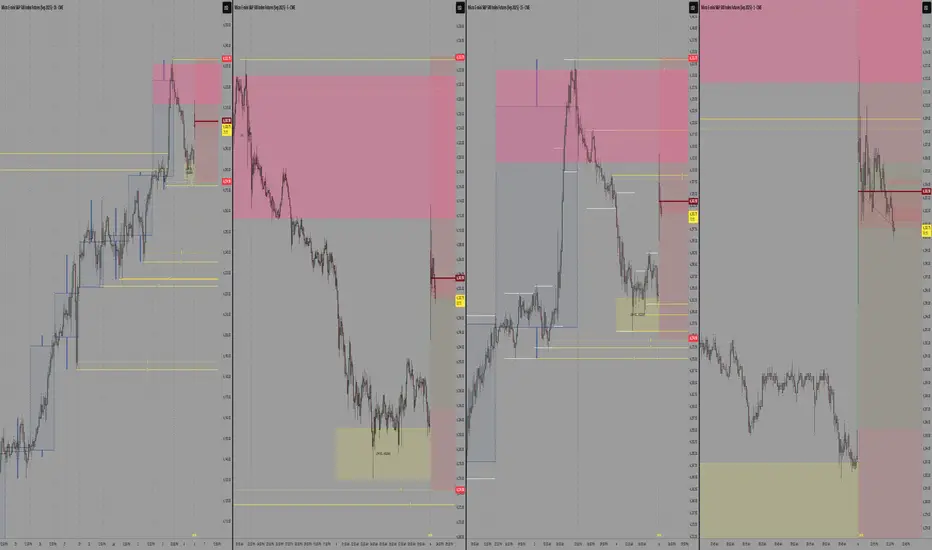
2025 Q1 + 6M/12M ranges 8h interim cycling bullish.
s1 @ 5554
r1 @ 5592
macro r1 @ 5738
sustain above and macro rotation pushes higher, r2 @ 5921.
its 8 days into the trading month and we've spent the entire 1M atr with extension to the downside.
8H / 1D interim rotation is bullish and no hh on di- since feb 27, despite almost a 500pt drop.
Extended boxes for 6M / 12M, and major levels noted for annual sup/res also marked.
In the last 20+ years, 12M candles closing red still printed an avg 4.74% H above the open; and after hitting lows, closed the year with an 9.97% rebound.
The rotation is a feature not a flaw.
Accept that it's fixed, and you'll see that nothing is broken.
You'll know the signal when you see it.
Appreciate the risk.