RTY1! trade ideas

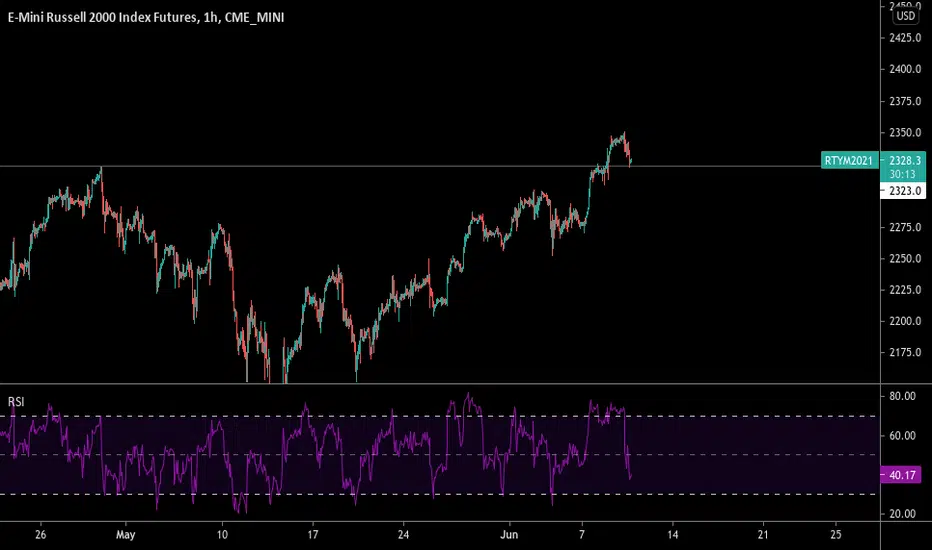
RTY OverboughtES and YM oversold, RTY overbought. Meme stock short squeeze appears to be over and normally this would mean a rotation into safe stock.... but the market has been anything but normal lately, lol. Even right now ES and YM look weaker than RTY like they want to throw an exhaustion gap tomorrow.
No compelling shorty trades, looks like a melt up. The only thing I would consider shorting today is China.

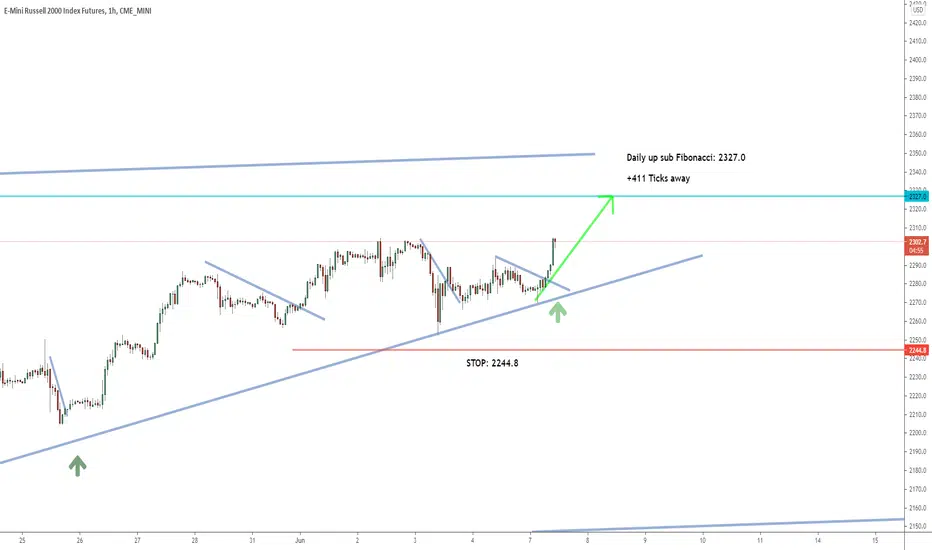
RTY One hour, +200 Tick bullish pushRTY is about +200 ticks away from the daily limit. As long as the market stays in the buy zone market should push to the projected limit price. Once the daily Fibonacci extension price it hit. It will be a good idea to stop buying the RTY to see if the daily resistance level will push the market back down to the daily support.
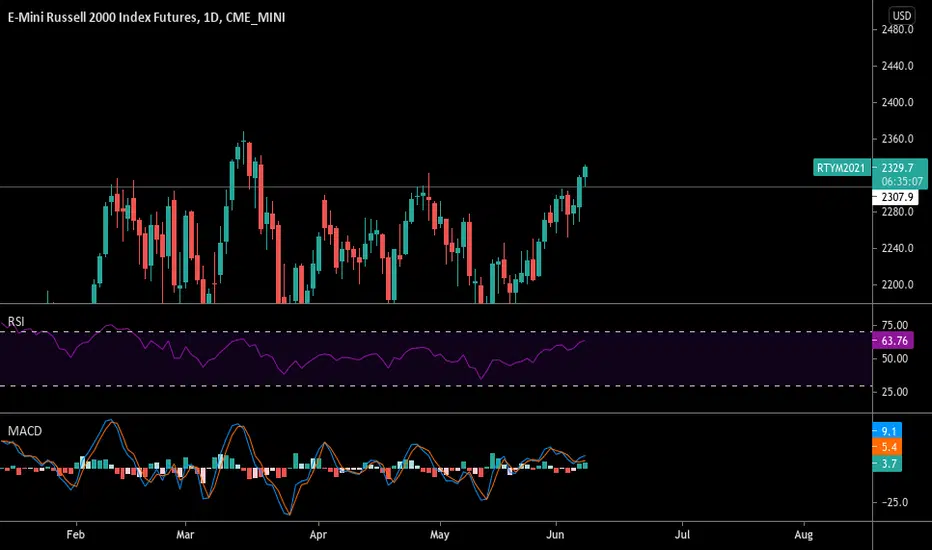
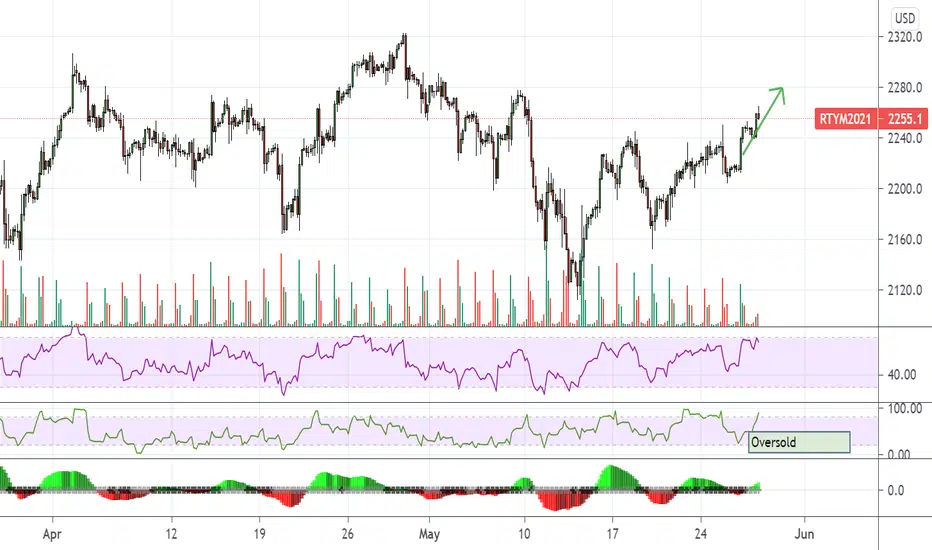
RTY the only index that went overbought on the dailyThe only index that hit overbought is RTY.... oddly, IWM shows the same thing
Done for the weekend, I will not be posting Monday.
Good luck
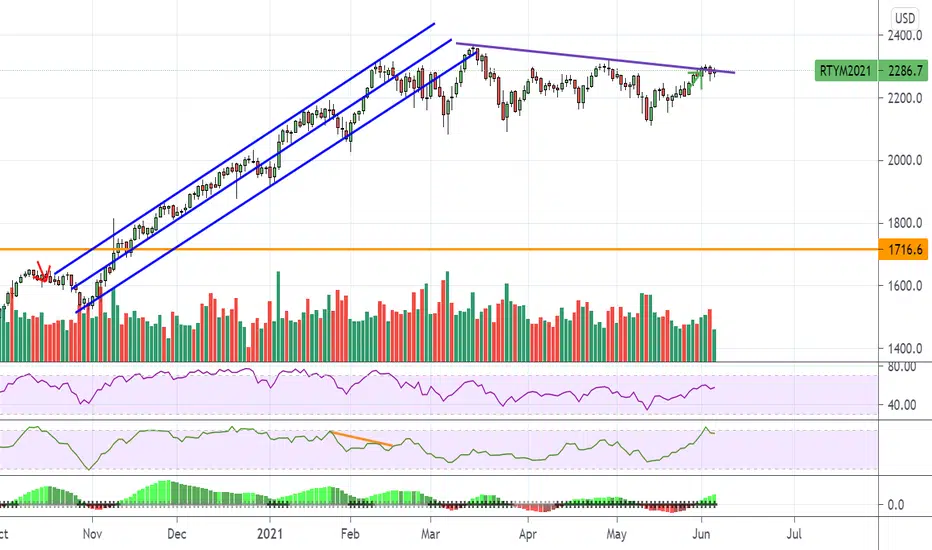
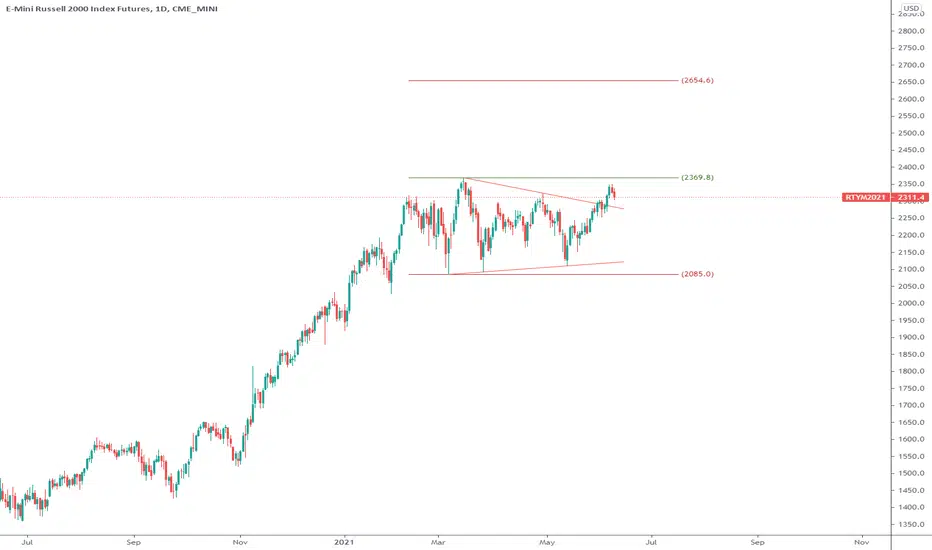
Russel, down boy I love wedges for those who follow can't tell.
They are one of the few patterns left in this market that still work not coupled with anything else.
This has been trading sideways in a veil of volatility
FED speaks and the world listens.
Will this be cyclical, or is this across the board?
Let's see.
That's all folks
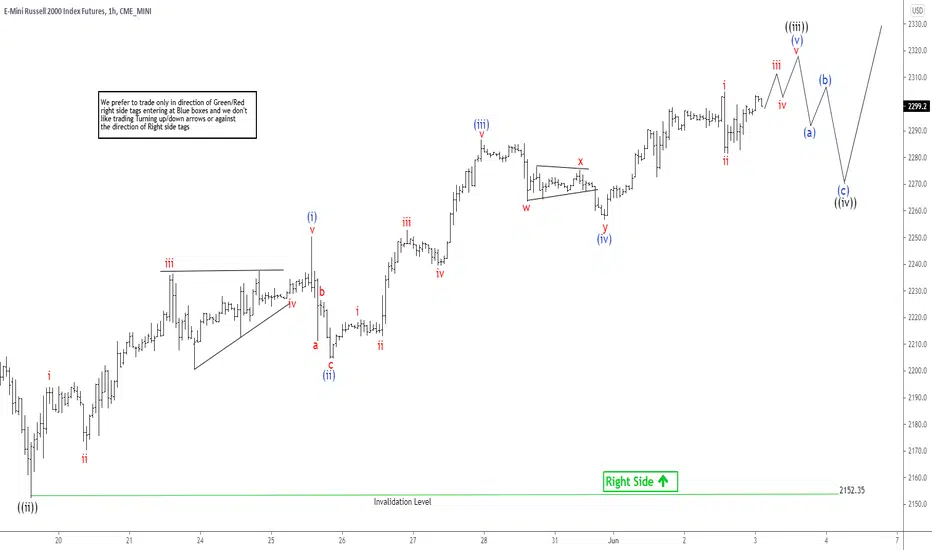
Elliott Wave View: Russell 2000 Aiming for All-Time HighShort term Elliott Wave view suggests rally from May 13, 2021 low is unfolding as a 5 waves impulse Elliott Wave structure. Up from May 13 low, wave ((i)) ended at 2245.1 and pullback in wave ((ii)) ended at 2152.35. The Index has started to rally again within wave ((iii)). Up from wave ((ii)) low, wave i ended at 2193.8 and dips in wave ii ended at 2170.20. Index then resumes higher in wave iii towards 2236.30 and pullback in wave iv ended at 2228.90. Final leg higher in wave v ended at 2250.2 which completes wave (i) in higher degree.
Pullback in wave (ii) ended at 2204.60. Index then extends higher in wave (iii) towards 2286.70 with internal subdivision of another 5 waves in lesser degree. Pullback in wave (iv) ended at 2256.50. Near term, expect a few more highs before the Index ends wave (v) and also wave ((iii)) in higher degree. From there, it should pullback in wave ((iv)) to correct cycle from May 19 low before the rally resumes. As far as May 19 pivot low at 2152.35 stays intact, expect dips to find support in 3, 7, or 11 swing for further upside.
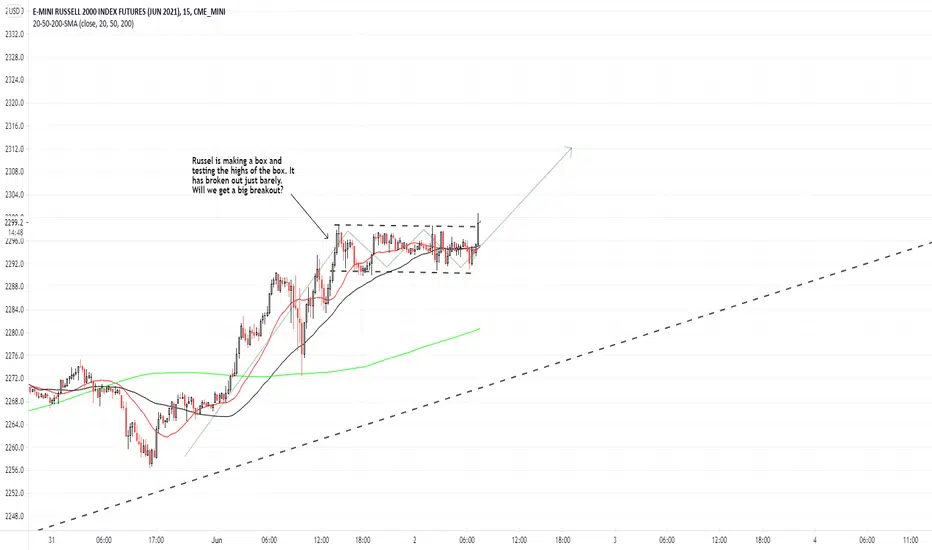
RTY breakout higher from box.Russell is breaking higher out of a box. A lot of people use this as an excuse to enter the market, on the idea that old resistance (once broken) becomes new support.
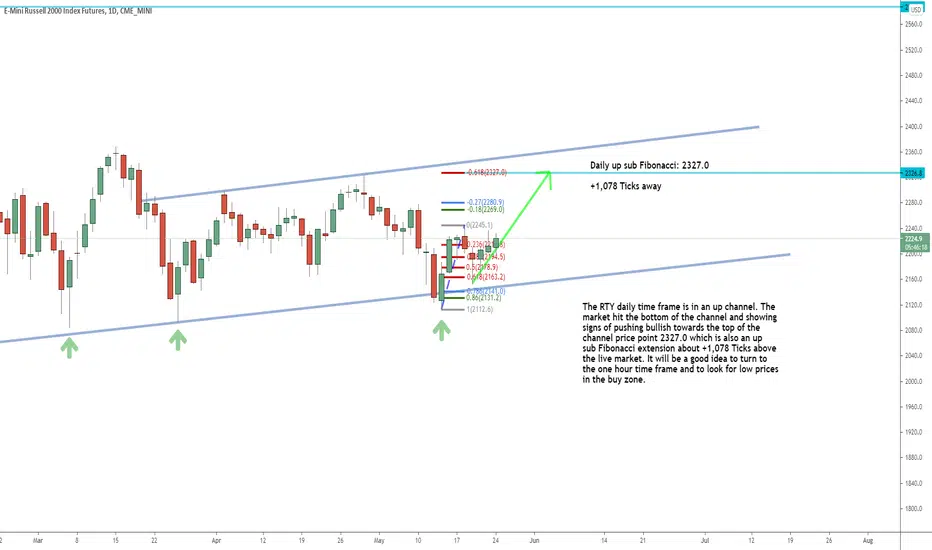
RTY Daily +400 Ticks Bullish PushThe RTY daily time frame is in an up channel. The
market hit the bottom of the channel and showing
signs of pushing bullish towards the top of the
channel price point 2327.0 which is also an up
sub Fibonacci extension about +411 Ticks above
the live market. It will be a good idea to turn to
the one hour time frame and to look for low prices
in the buy zone.

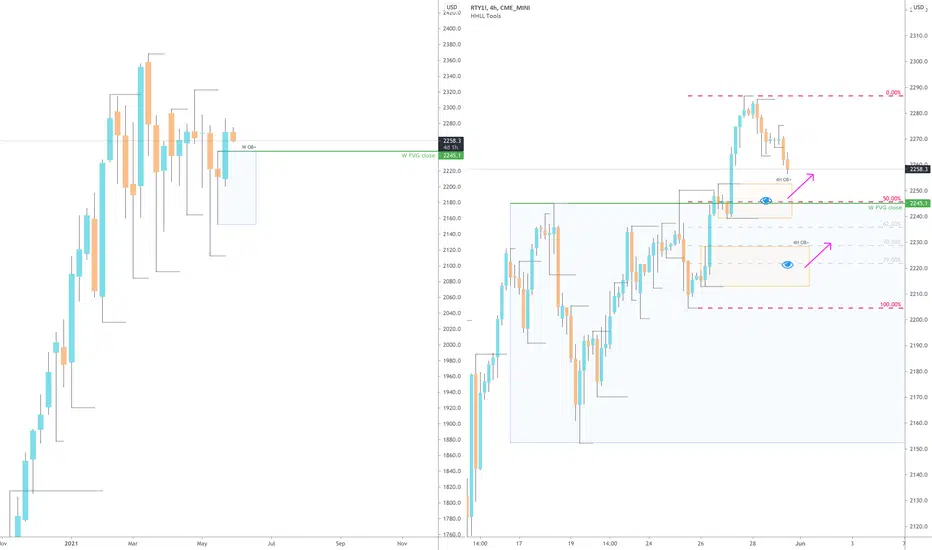
RTY1! (Russel) : 2 areas of potential bullish reactionPrice could dip into discount, mitigate some 4H zones and then go higher.
Wait for confirmations before going long. GLGT.
RTY rolled overRTY selling off because it hit my target (lol) and was overbought on both RSI and MFI.
ES and NQ are not overbought, looks like sector rotation back. So much rotation I'm getting dizzy.
Note: All foreign markets except China rallied last night, no short positions over the weekend. In fact, I'm all cash.
Keep in mind foreign markets trade on Monday. Gap direction for Tuesday is impossible to tell, but I'm bullish for now.

Russel 2K Bulls beware; proceed with cautionFurtures M2K just hit the 100% extension and slope resistance in the Asian session too... Watch out; May want to play the pull back

RTY UpdateOverbought so I'm not sure it;s gonna hit the target I drew up yesterday, but tomorrow is Ponzi Friday.
Maybe a rotation out of small caps and into tech tomorrow.


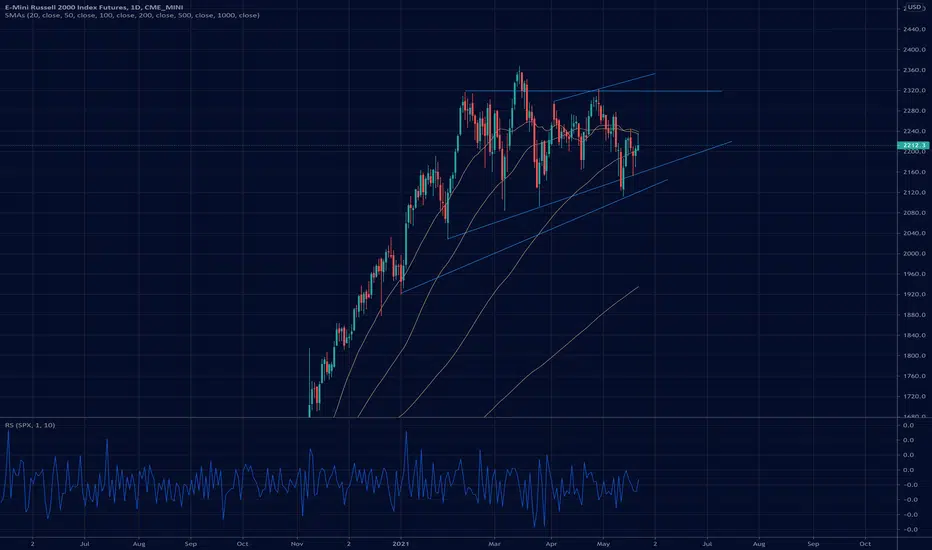
RTY, +1,000 Tick bullish pushRTY daily time frame is in an up channel. The market hit the bottom of the channel and is showing signs of pushing toward the top of the channel. The market is starting to make an up Fibonacci with an extension about a +1,000 ticks above the market price. Turning to the one hour time frame and looking for low prices in the buy zone will be a good idea as long as the market stays above the bottom of the daily up channel.

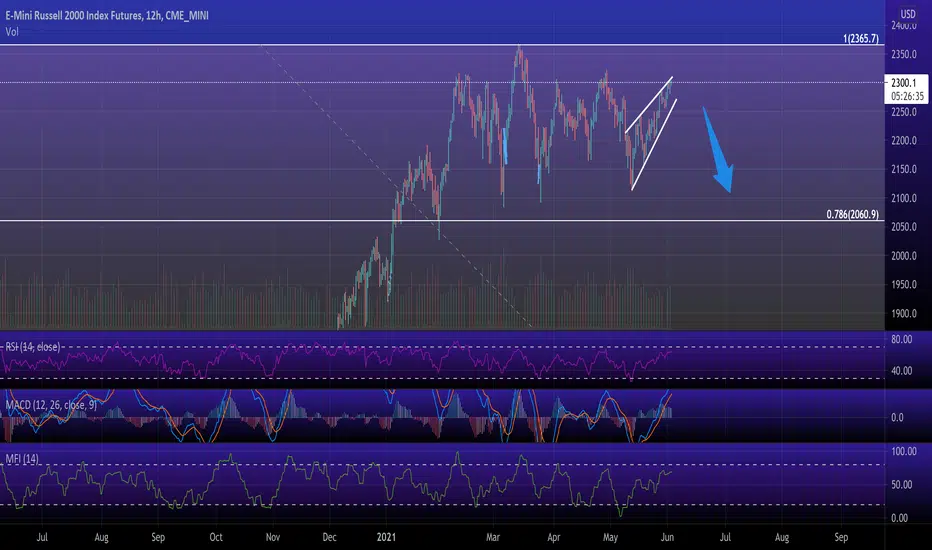
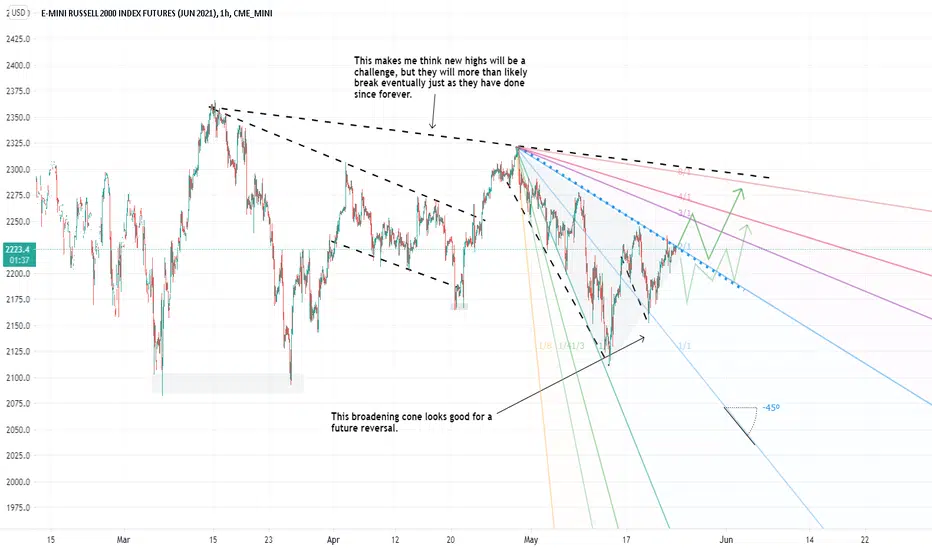
Broadening descending patterns on Russel. Makes me think Gann.It looks like it might have found the bottom already to me. The downward sloping upper trendline on the top looks like it could be trouble, but in the meantime I think it will trickle upward.
I have listed as 'neutral' because one of my two paths has Russel collecting at a lower level.
$IWM: Rejection of high, are they trying to dump it at 2240?Wondering if the $GDX is showing us something and could there be potential that these are getting riskier?
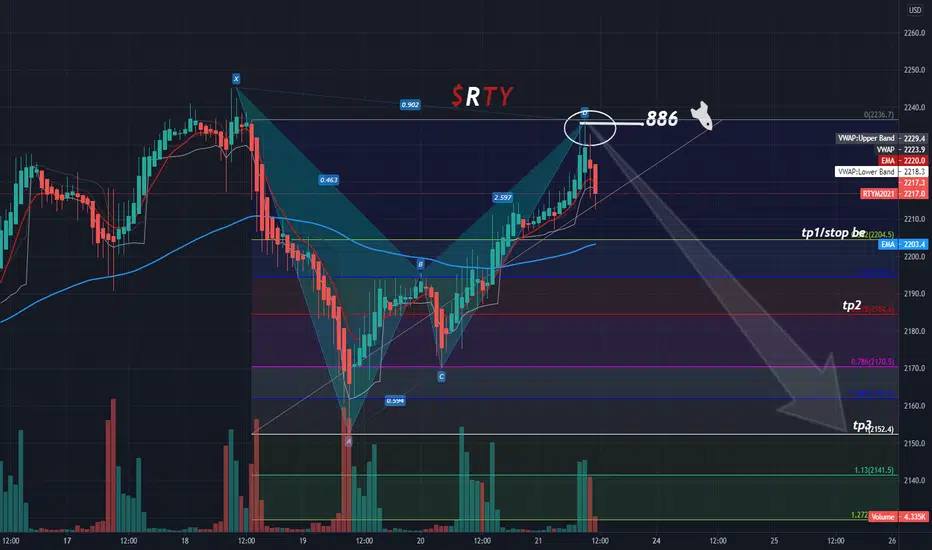
RT_Y 🩸 Killer entry on Bat Pattern Tp1 on deck, clean pattern on Heiki (candles) Learn how to find these daily, pls Dm me
RTY Trade Idea- LongThe Russell here is in a massive range on the 1 Day chart. On the 4hr, price looks much like the NQ. Our bias is long as we're at the bottom end of the range and we're seeing bullish momentum. Currently waiting for a pullback with a bullish engulfing/break of structure.
