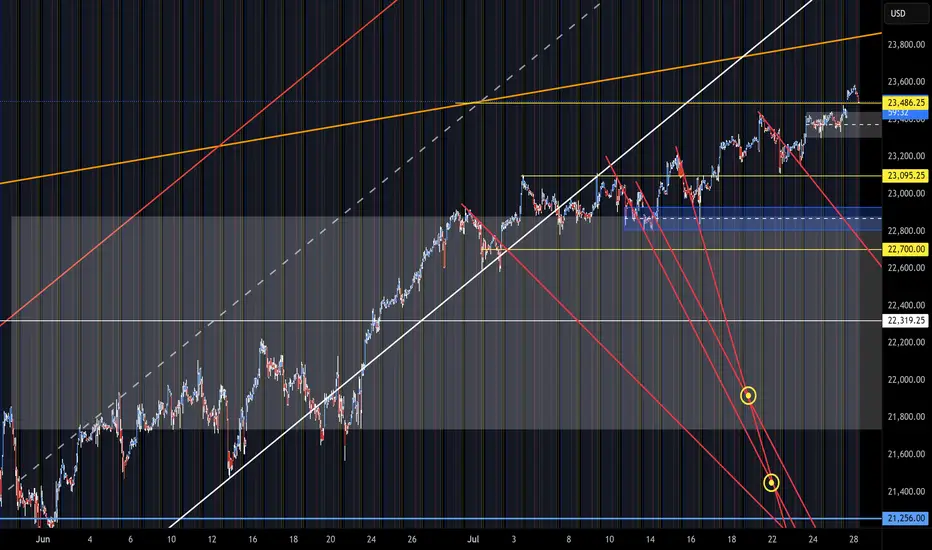
NQ Short (07-28-25)The F-M Long Rig is active with a Gap Up and Pump/Dump play. Just notice KL 486 and how/when the NAZ gets above. In O/N, the Reg Session and previous hits at 23,440 got rejected and is why you are seeing the move in the off session. The BTD/FOMO chase is active, Pump/Dump near Open today for next mo
About NASDAQ 100 E-mini Futures
An index composed of the 100 largest, most actively traded US companies listed on the Nasdaq stock exchange. This index includes companies from a broad range of industries with the exception of those that operate in the financial industry, such as banks and investment companies.
Related futures
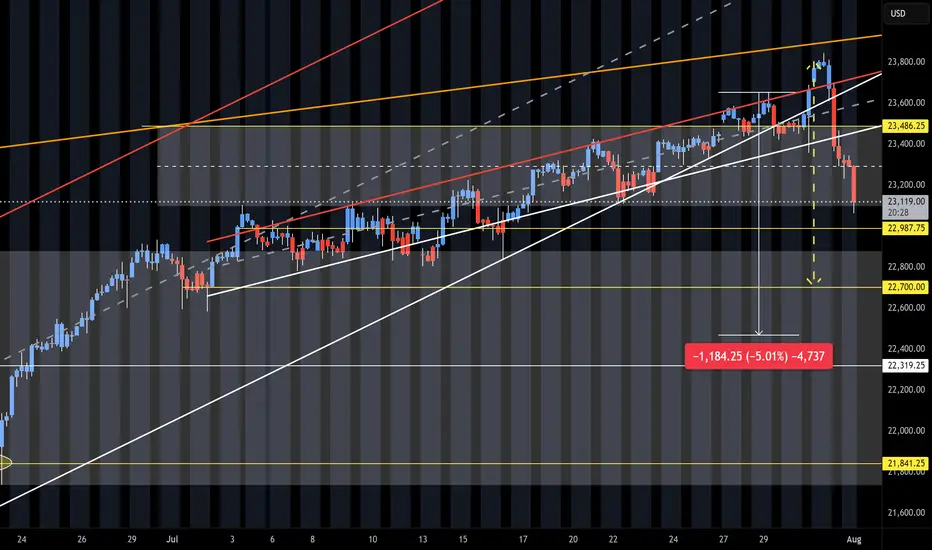
NQ Short (08-01-25)The 5% pull back is playing out. We had the heavy selling after the O/N Pump/Dump into the selling of the Reg Session and Outside Day Reversal. Up for weeks and down in hours. Next break down will have to be the failure of the long standing Friday into Monday Long Play. We did get the reg session se
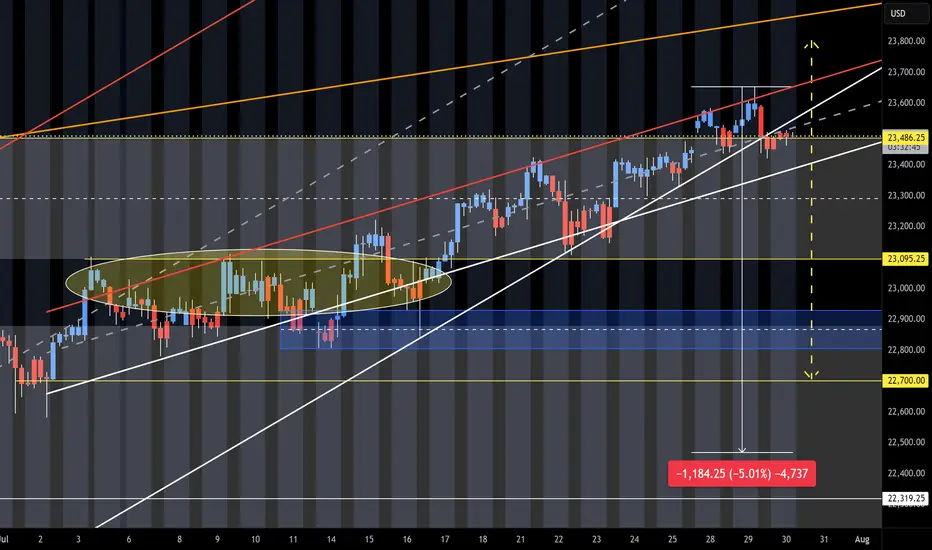
NQ Short (07-30-25)NAZ is at upper target and Turn Zone from May 12th post. Failure here should see a 5% drop test. The idea is that buyers will need some sellers in order to get higher. The sellers will help to test the level strength. Month end into a Friday-Monday Long play and a break in this long standing pattern
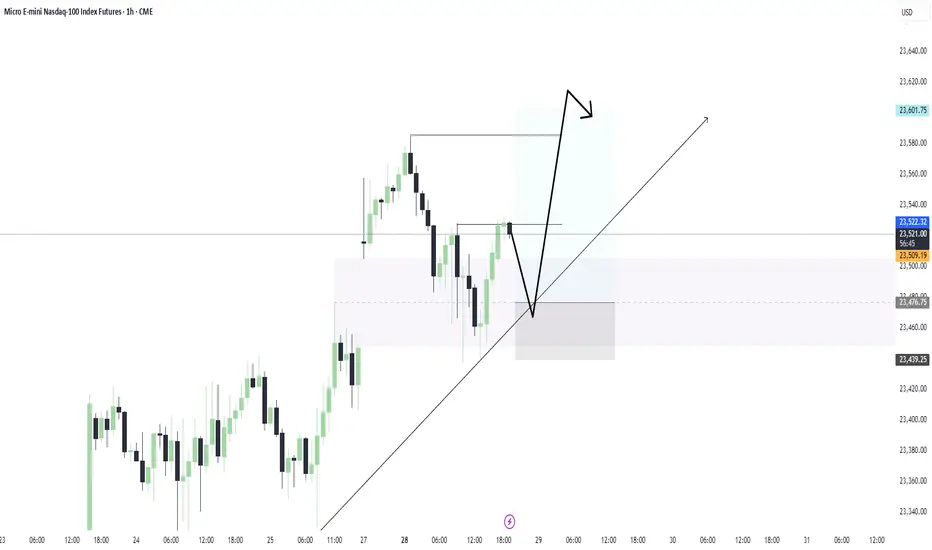
Tuesday Long Trade for the NASDAQ 7/29I'm feeling ultra bullish on NQ right now. Ideally, I want to see price carve out an inverse head and shoulders or a double bottom—either could serve as a springboard to new highs. I took two longs this morning and captured solid gains off the weekly opening gap. Would love to see one final wick int
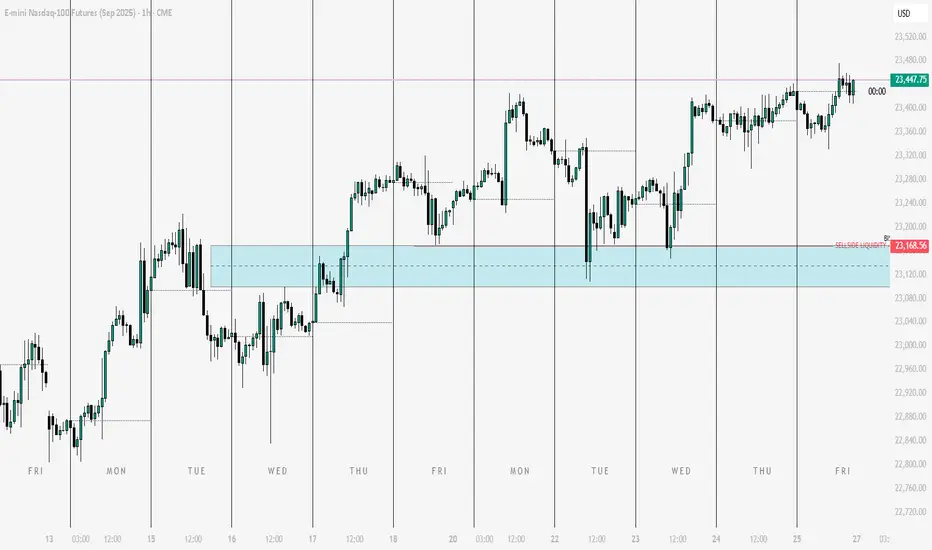
NQ & ES Technical AnalysisGood evening my friends... This is my first time posting something on this platform. I decided to share my analysis on NQ & ES here with you, but without sharing strategies, rules and entry techniques. Only the key levels and scenarios... I will make one or two comments every day... I am very happy
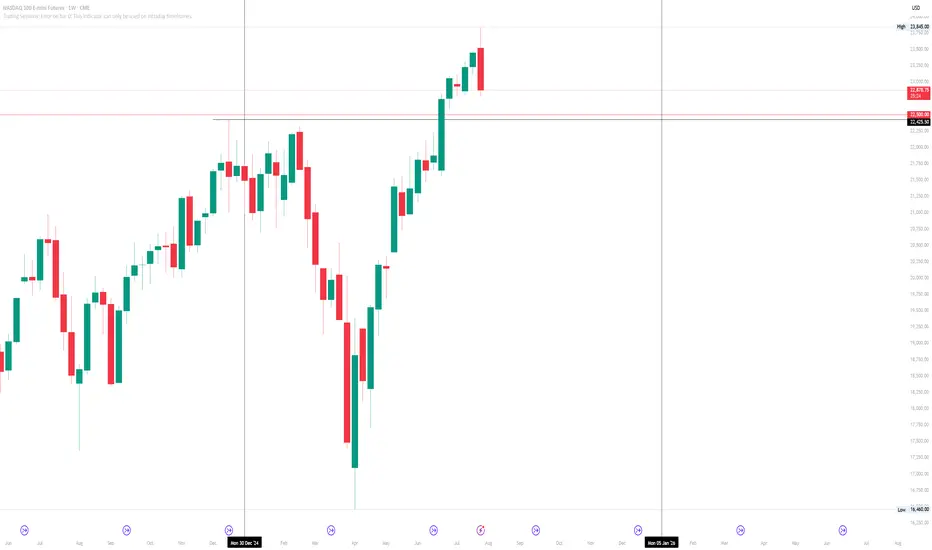
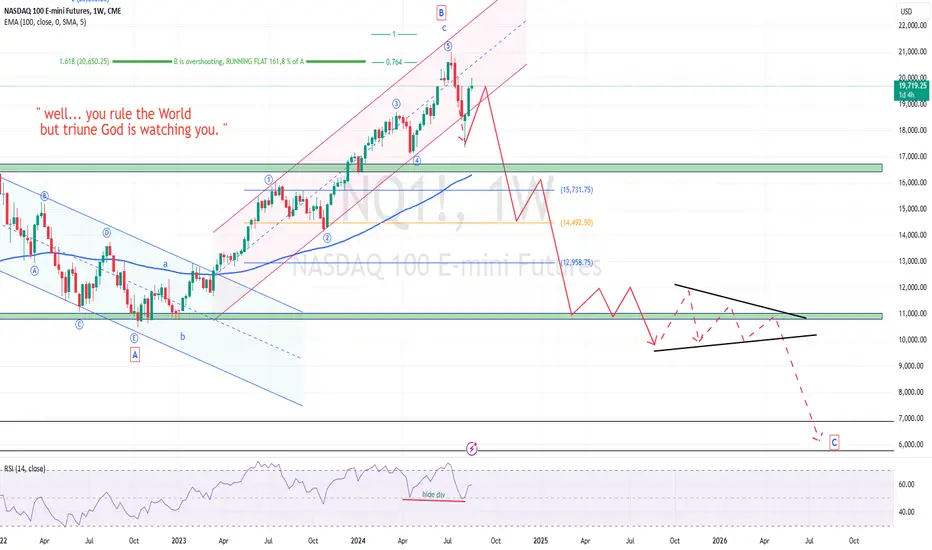
Nasdaq outlook on the weekly.... Where will price go next?Market cycle outlook on the year :
We have now reached a new month.
August 1st, which a new market cycle for the month to form, along beginning the backend of the year 2025 and the front end of a new week coming.
Closed bearish this week along with hitting all time highs once again for the Nasda
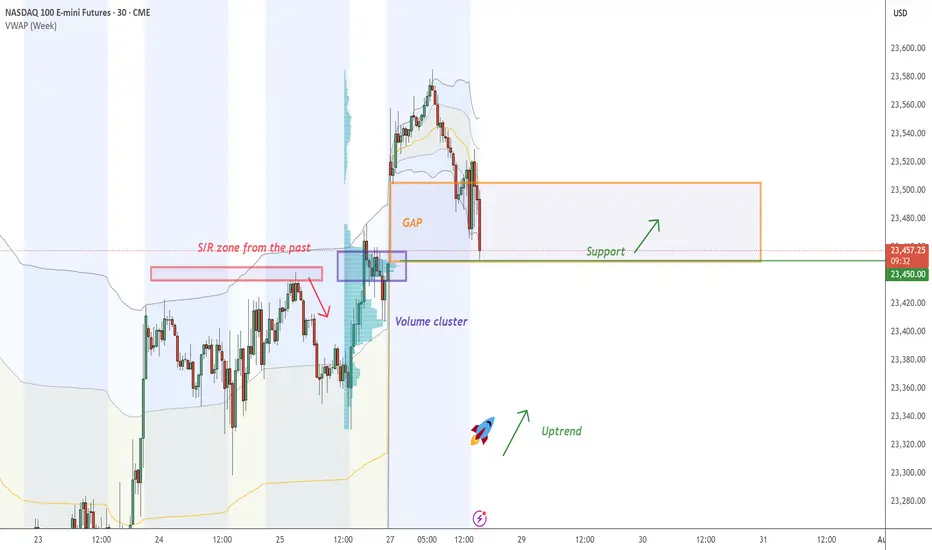
NASDAQ - Fair Value GAP On NASDAQ , it's nice to see a strong buying reaction at the price of 23450.00.
There's a significant accumulation of contracts in this area, indicating strong buyer interest. I believe that buyers who entered at this level will defend their long positions. If the price returns to this area, strong
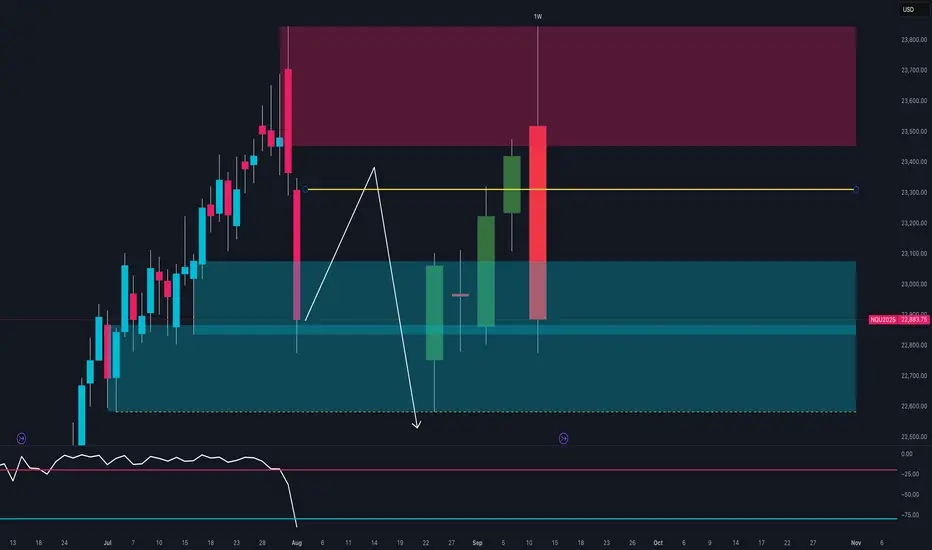
NASDAQ at Key Turning Point 🔍Technical Context
After testing the 23,600–23,800 supply zone, price printed a strong bearish rejection with a weekly engulfing candle.
The RSI broke decisively below the midline, signaling a clear loss of momentum.
Price is now trading back within the weekly demand zone between 22,800 and 22,950
Why Are Markets Rising Despite the Tariffs?Because of the
1) Set timeline on finalizing the tariff rates and
2) The ongoing negotiations,
They aimed at striking a balanced deal between the U.S. and its trading partners.
The Liberation Day tariffs were announced on 2nd April, and markets initially crashed in response. However, just seve

Lord Jesus Christ, Son of God, have mercy on us sinnersare you ready... ?
In the name of the Father, and of the Son, and of the Holy Spirit. Amen.
Glory to Thee, our God, glory to Thee.
O Heavenly King, O Comforter, the Spirit of Truth, who art in all places and fillest all things; Treasury of good things and Giver of life, come and dwell in us
See all ideas
Summarizing what the indicators are suggesting.
Neutral
SellBuy
Strong sellStrong buy
Strong sellSellNeutralBuyStrong buy
Neutral
SellBuy
Strong sellStrong buy
Strong sellSellNeutralBuyStrong buy
Neutral
SellBuy
Strong sellStrong buy
Strong sellSellNeutralBuyStrong buy
A representation of what an asset is worth today and what the market thinks it will be worth in the future.
Displays a symbol's price movements over previous years to identify recurring trends.
Frequently Asked Questions
The current price of NASDAQ 100 E-mini Futures is 22,883.75 USD — it has fallen −2.06% in the past 24 hours. Watch NASDAQ 100 E-mini Futures price in more detail on the chart.
The volume of NASDAQ 100 E-mini Futures is 792.78 K. Track more important stats on the NASDAQ 100 E-mini Futures chart.
Open interest is the number of contracts held by traders in active positions — they're not closed or expired. For NASDAQ 100 E-mini Futures this number is 280.26 K. You can use it to track a prevailing market trend and adjust your own strategy: declining open interest for NASDAQ 100 E-mini Futures shows that traders are closing their positions, which means a weakening trend.
Buying or selling futures contracts depends on many factors: season, underlying commodity, your own trading strategy. So mostly it's up to you, but if you look for some certain calculations to take into account, you can study technical analysis for NASDAQ 100 E-mini Futures. Today its technical rating is sell, but remember that market conditions change all the time, so it's always crucial to do your own research. See more of NASDAQ 100 E-mini Futures technicals for a more comprehensive analysis.