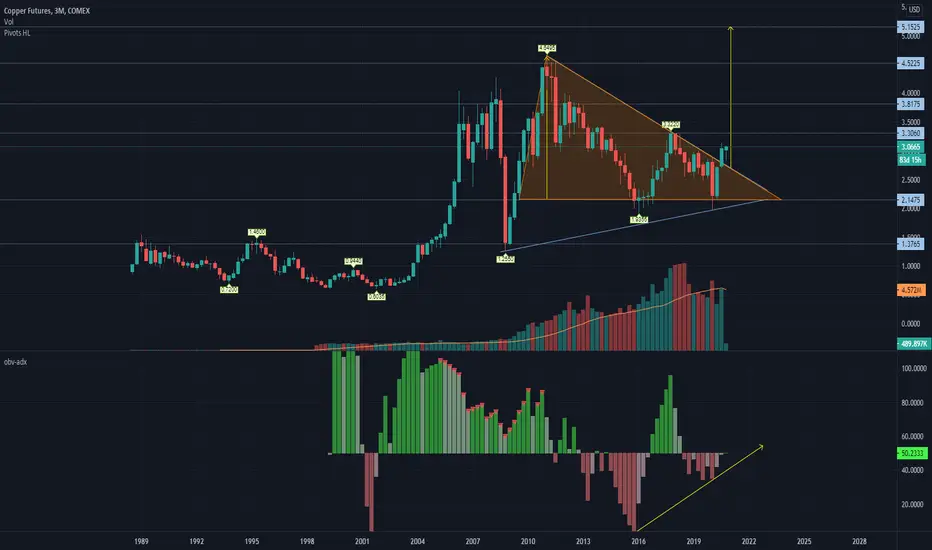
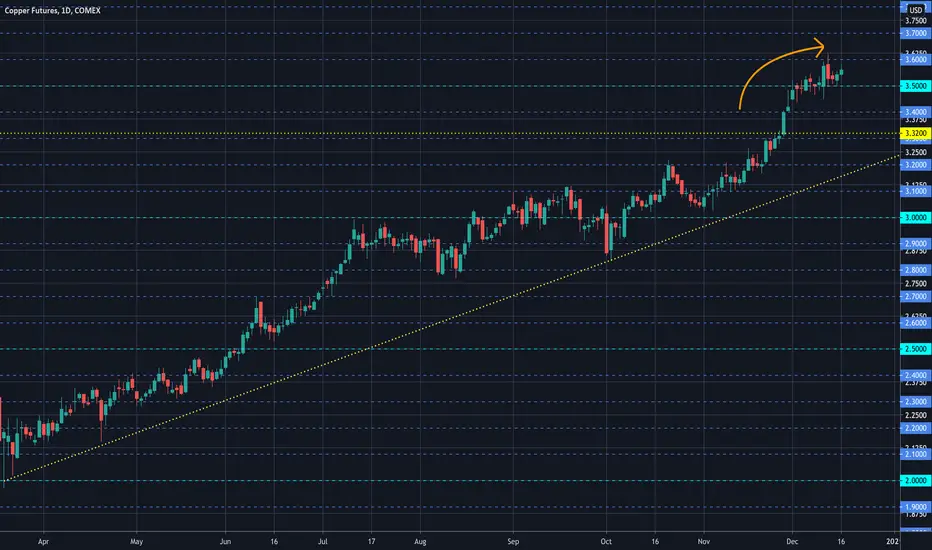
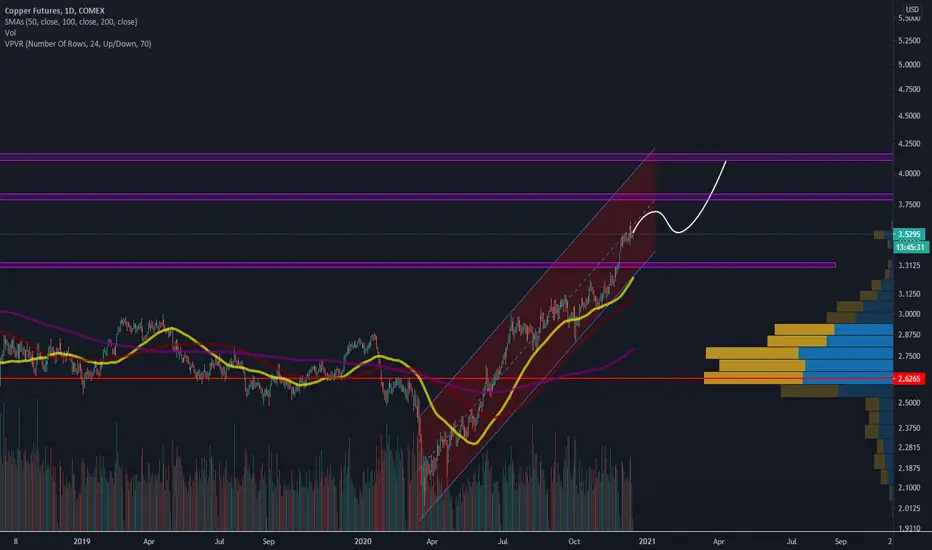
$5: Copper Aiming for New ATH One of the best looking and yet under-rated commodities chart has to be of COPPER.
I know Gold and Silver bugs don't usually get strayed with non-precious metals but technicals are surely juicy if you are able to take a multi year position. My guess is it will be early 2023 when we break through the new ATH.
Notice the divergence of price and OBV + a successful 'price action' breakout in the last 3 months. Wait for another 3 months to absolutely confirm the pattern and then off you go.
Even the last two volume candles are strong (>=MA) which shows consolidation under place.
HGS1! trade ideas
Copper = Industry (also a hedging opportunity)There is a direct correlation between the S&P 500 and copper performance and they generally move in the same direction.
Copper is much more closely aligned with global growth and demand, so if the global economy is expanding then demand for copper should increase.
In other words, if the stock markets correct or crash the price should drop (now at resistance)
If the stock markets rise more, then very simply Copper will follow.
Hedging idea :
60% Platinum buy (over it's resistance), 40% copper sell (under it's support).
Compound the winner gradually and follow the indices movement.
ps. the indices are most likely correcting, not crashing at this stage
Inflationary Copper TradeCopper has shown to be one of the most out performing bullish trends of the 2020 year. We consider the need to materials in EV and chip manufacturing. These trends are likely to continue and keeping an eye on this trend will be key for the reflationary trade that has exposed itself as historically probable

Copper futures - HG - EW analysis - Buy set up Copper futures HG - It is in 4th wave correction after impulse 3rd wave finished at previous lower high. The move is WXY correction, where Y is in progress as triangle. One more dip will probably finish the Y wave and so 4th wave. Buy thereafter for new high as 5th wave.
Give thumbs up if you really like the trade idea.


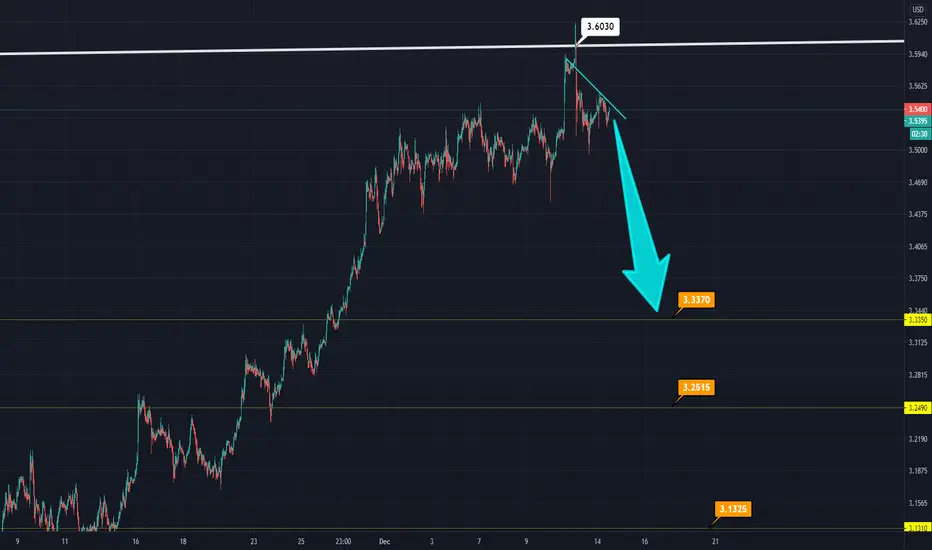
Sell Copper
Target 602/601
Below 600 Target towards 598/595 for short term.
Main stop Loss at 609
* I just shared my view. Please trade with your own and comfortable ideas.*

Copper vs TIP Ratio HIGHLY correlates to Copper MetalCopper Future's Monthly Chart VS Inflation Protected Treasuries
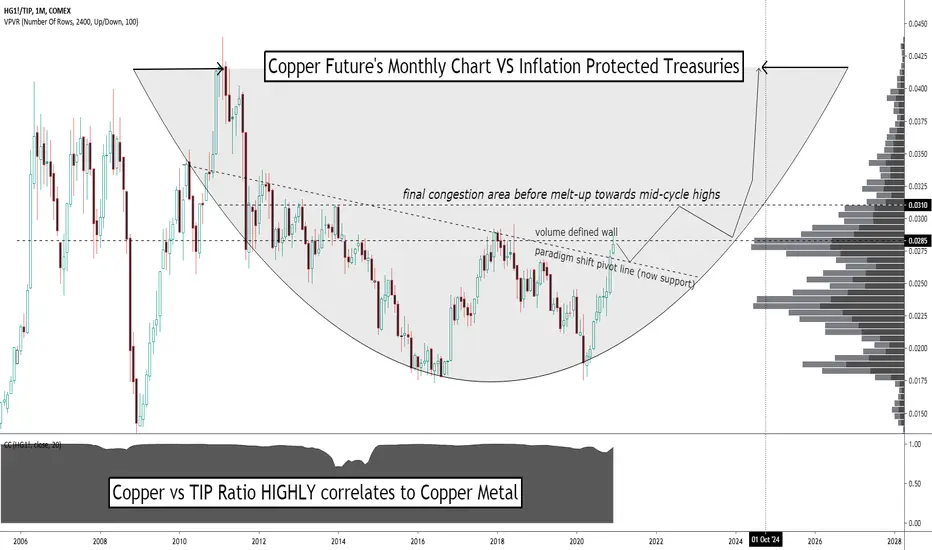
Copper/Gold ratio suggests a move higher for 10 Year Yields. The traditional relationship between the Copper/Gold Ratio and US 10 year yields - which has proven sound over the longer term - is suggesting a potential up turn in US 10 Year Yields. One big caveat on this analysis is the Federal Reserve. Should Powell et al intervene at the longer end of the market, this will upset the ratio and send rates lower, even if demand (and therefore prices) for copper continues to grow next year.

Short copper as RSI and MACD are very high on a weekly chartCopper looks overbought after a 80 % rise since march. Time to sell?

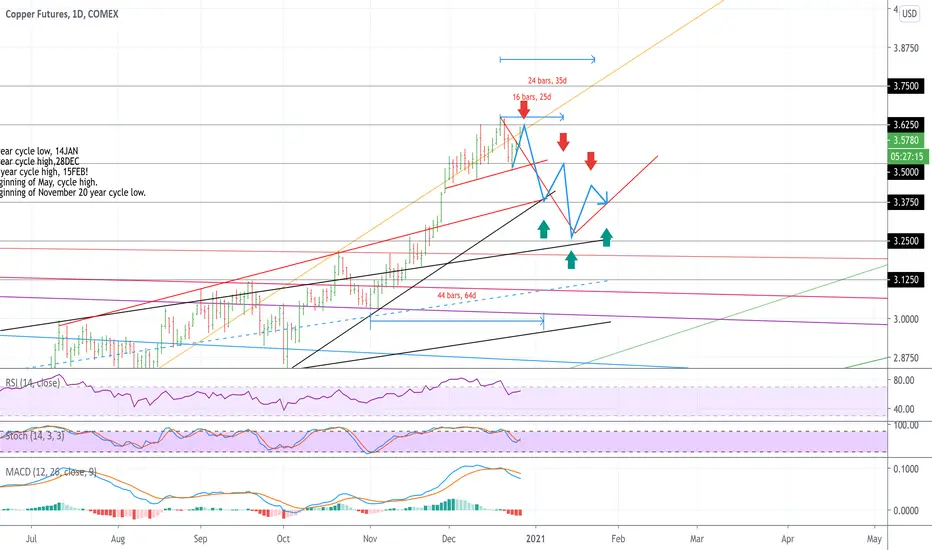
Copper futures forecast.This is not a trading advice idea and you should only follow this with caution or just for your own personal interest in cycles and Gann theory. This post is made by me to test the methods of forecasting I obtained from long studies of the subject. If you will follow this idea and observe the copper market and the forecast will turn out +- 1 trading day right at each arrow date - it has worked and I will continue to post such posts. Thanks in advance.
*Futures trading involves a substantial risk of loss and is not suitable for all investors.
Copper will hit a new all time highI am bullish for this one. The triangle is ugly but I think it is an accumulation zone. Thus, a new all time high will not be surprise in 2021 and beyond.

Copper........ In a NutShellrange and trading channels defined
Keep checking comments section for more details
Like... Follow... Share....

COPPER Don't miss the 2 year bull runA very important long-term pattern was just formed on Copper. On the 1M time-frame, the MA50 (blue line) and the MA100 (green line) have formed a Golden Cross. Last time that happened was in August 2004. Copper rose by +370% from the MA100 break-out level.
The Cycle seems to be repeated as the Golden Cross has come after the price Double Bottomed last March (2020). Same with the November 2001 Double Bottom. Additionally, the LMACD is replicating the exact same sequence.
For me Copper is a dip buy action on every 1M candle from now on.
** Please support this idea with your likes and comments, it is the best way to keep it relevant and support me. **
--------------------------------------------------------------------------------------------------------
!! Donations via TradingView coins also help me a great deal at posting more free trading content and signals here !!
🎉 👍 Shout-out to TradingShot's 💰 top TradingView Coin donor 💰 this week ==> TradingView
--------------------------------------------------------------------------------------------------------

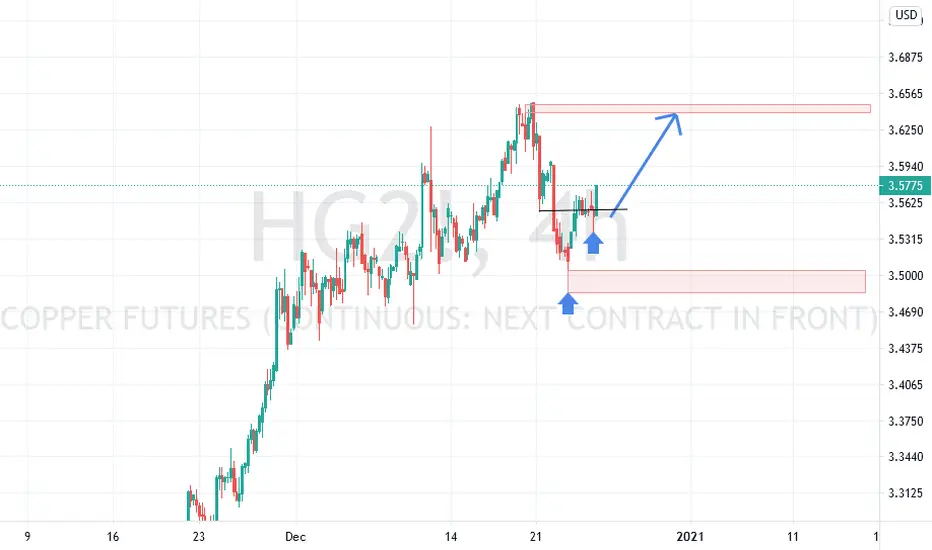
Copper futures - HG - EW analysis - 5th wave up BuyCopper futures - HG - It is in 5th wave up as final move up. So Buy with stop level below 3.4785 for the target above 3.687 or higher level. The 4th wave was finished as flat abc correction.
Give thumbs up if you really like the trade idea.

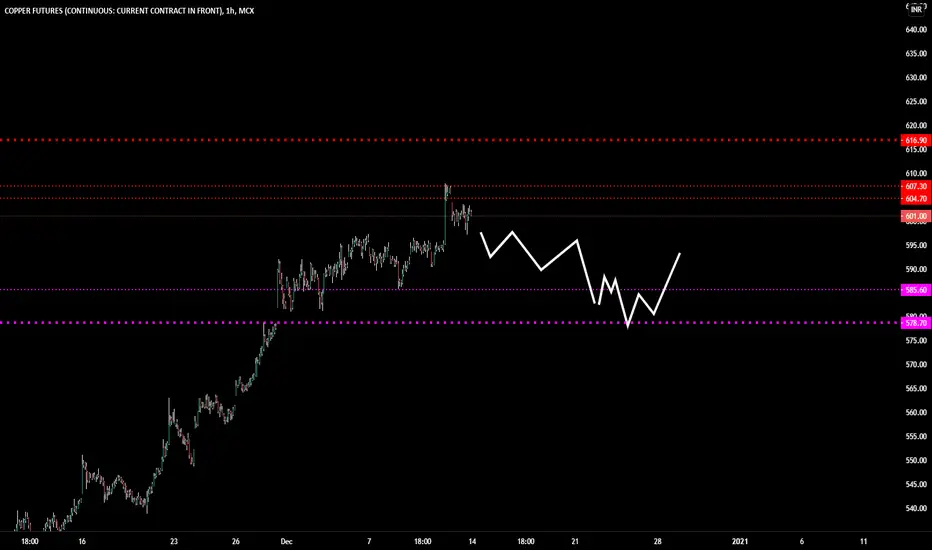
#MCX Copper Moment SellMoment Targets 608/607.50
607 has good support for buying.
Below 607 flow seems to 606/605
Main Stop Loss at 612

Weekly copper market review 12/21/2020.Support us by consulting our free magazines with color stock charts and weather maps on our commodity-market-review.com website.
TECHNICAL ANALYSIS OF COPPER
Last week, COMEX copper futures closed higher at $3.6320 per pound. Copper prices were at highs not seen since February 2013.
Speculative trading is still pushing copper prices, however, net positions in the net commitments of COT traders, after exceeding 80K for the first time, fell slightly last week to 72.12K.
Copper stocks are historically low at 269453 MT, a drop of more than 10% in one week and 16% in December. As can be seen on the stock chart below, total stocks of the red metal are at historically low levels not seen in the last 5 years.
China, the main consumer of copper, is in a phase of accelerated growth, with a recovery in the electronics and automotive exporting sector which has boosted demand for industrial metals.
Figures released last week show that in November the Chinese economy continued to accelerate, a process driven by the recovery in domestic and external demand. Industrial production increased by 7%, the highest rate in 20 months, and investment is supported by government infrastructure programs. Expectations suggest that credit growth and stimulus will continue in 2021, the year for which the IMF forecasts GDP growth of 8.1%.
On the international front, Senate Republican leader Mitch McConnell announced Sunday evening that a $900 billion deal would be reached. The Fed said its purchases of securities would continue at the current rate of $120 billion per month until substantial additional progress has been made. The brexit saga continues, with the European Parliament's Sunday night deadline for a deal passed, but negotiations will continue. No one seems to want to take responsibility for a possible failure. After Pfizer, the FDA also approved Moderna's vaccine. As far as the pandemic is concerned, the vaccination campaign has started in the United States. The new strain of coronavirus detected in Great Britain worries, it would be 70% more contagious. The global death toll is rising, we have just passed 76 million cases worldwide, with more than 1.692 million deaths. The United States is still the most affected country, with 317,000 deaths and more than 17 million cases.
The Dollar fell last week, with the DXY closing lower at 89.924, hitting a 2 1/2 year low. The long-term trend is still bearish.
ECONOMIC RESULTS
- On Monday, industrial production in the Euro zone came out at +2.1% compared to +0.1% the previous month.
- On Tuesday, industrial production was +7.0% compared to +6.9% in the previous month. The Chinese unemployment rate was 5.2%. US industrial production was 0.4% compared to 0.9% the previous month, and the New York FED manufacturing index was down 4.90 compared to 6.30 in October.
- On Wednesday, manufacturing PMI in the Euro zone rose to 55.5% from 53 the previous month. U.S. retail sales declined to -0.9% from -0.1% in October. U.S. manufacturing PMIs were 56.5 compared with 56.7 the previous month.
- On Thursday, inflation in the Euro zone came out at -0.3% in November as expected. U.S. building permits surprise positively up to 1.639M, U.S. unemployment registrations disappoint at 885K, and the Philadelphia FED manufacturing index falls sharply to 11.1 from 26.3 the previous month.
CERTIFIED COPPER STOCKS
- London Stock Exchange copper stocks are down to 123400 MT from 146325 MT last week.
- Copper stocks on the Shanghai Stock Exchange were down to 74222 MT from 82092 MT the previous week.
- Copper stocks on the New York Stock Exchange were down to 71831 MT for 72520 the previous week.
- Total copper stocks were down to 269453 MT compared to 300937 MT the previous week. Total copper stocks are below the five-year average.
THE DOLLAR
The DXY index representing the Dollar against a basket of foreign currencies closed last week down to 89.924, hitting a 2 1/2 year low. The long-term trend is still bearish. The possibilities of reaching an agreement on a contingency plan to support the U.S. economy, as well as the possibility of an economic recovery, are expected to continue.
Disappointing economic results weighed on the currency last week. Indeed, U.S. Retail Sales down to -0.9% and Unemployment Claims up to 885K disappointed.
A low dollar is generally favorable for dollar-denominated commodity markets.
COMMITMENTS OF TRADERS
The weekly COT (Commitments of Traders) report of the Commodity Futures Trading Commission (CFTC) shows all the positions opened by all market participants. The COT report is published on Friday, and reflects the open positions on Tuesday of the same week. It shows the position of commercial traders (producers, commodity buyers, ...) but also non-commercial (speculators).
The net positions of speculators on the futures markets are particularly interesting to observe.
The net speculative position on the copper futures markets is down this week to 72.12 K instead of 80.039 K.

Copper HGCopper HG1! - Buy - H4 ChartCopper HGCopper HG1! - Buy - H4 Chart
HGCopper HG1! Continues upward
Please support the idea with a Like 👍
Follow me to receive updates of this analysis, plus new ideas ✅
Thank you for your support 😊
Wishing you successful trading 🙏
------------------------------------------------------------------------------------
🔺 Disclaimer! The content of this analysis is subject to change at any time without notice.
🔺 It is provided for the sole purpose of assisting traders to make independent investment decisions.
🔺 You must do your own research to create your own trading plan for the market.
------------------------------------------------------------------------------------

Weekly copper market review 12/14/2020.Support us by consulting our free magazines with color stock charts and weather maps on our commodity-market-review.com website.
TECHNICAL ANALYSIS OF COPPER
Last week, COMEX copper futures closed higher at $3.528 per pound.
Speculative trading is pushing copper prices up, with net positions of COT commitments of traders exceeding 80K for the 1st time, they are on historical highs.
Copper stocks are historically low at 300937 MT and are about to fall below the 300 mark which represents less than 5 days of world consumption.
China, the main consumer of copper, is in a phase of accelerated growth, with a recovery in the electronics and automotive export sector which has stimulated demand for industrial metals.
In November, refined copper imports fell for the second consecutive time, down 9.2% compared to October. Imports of copper concentrates increased by 8.3% in November. China's exports grew by 21.1% in November, far exceeding the expected 12%.
Internationally, the ECB increased its asset buyback program by 500 billion, the US support plan is still slow to come, and a brexit no-deal is increasingly likely. The FDA in turn is approving the use of Pfizer's vaccine, and vaccination begins this week in the US. In terms of the pandemic update, we have just surpassed 72 million cases worldwide, with more than 1.607 million deaths. The U.S. is still the most affected country, and will approach and surpass the 300,000 mark in deaths and more than 16 million cases.
The Dollar consolidated last week as the DXY closed higher at 90.976, with the long-term trend still bearish.
ECONOMIC RESULTS
- Last week, Chinese exports grew by 21.1% in November and imports declined by 4.5%. Euro-zone GDP was up 12.5% in Q3, the ZEW Economic Sentiment Index surged to 54.4 from an expected 37.5. US unemployment registrations disappointed at 853K for 725K expected.
- On Monday, industrial production in the Euro zone came out at +2.1% compared to +0.1% the previous month.
- On Tuesday, industrial production was +7.0% compared to +6.9% in the previous month. The Chinese unemployment rate was 5.2%. US industrial production was 0.4% compared to 0.9% the previous month, and the New York FED manufacturing index was down 4.90 compared to 6.30 in October.
- Wednesday, Euro-zone Manufacturing PMI, U.S. Retail Sales and U.S. Manufacturing PMI.
- Thursday, Euro-zone inflation, U.S. building permits, U.S. unemployment registrations, and Philadelphia FED manufacturing index.
CERTIFIED COPPER STOCKS
- London Stock Exchange copper stocks are down to 146325 MT from last week's 149675 MT.
- Copper stocks on the Shanghai Stock Exchange were down to 82092 MT from 97783 MT the previous week.
- Copper stocks on the New York Stock Exchange were down to 72520 MT for 73233 the previous week.
- Total copper stocks were down to 300937 MT compared to 320691 MT the previous week. Total copper stocks are below the five-year average.
THE DOLLAR
The DXY index representing the Dollar against a basket of foreign currencies closed last week up at 90.976, although the long-term trend is still bearish. The DXY consolidated last week. The ECB increased its asset repurchase program by $500 billion, and, the U.S. support plan is still lagging behind, still failing to agree on emergency aid of just over $900 billion. The dollar has also strengthened against the pound sterling, on an increasingly likely no-deal, as the disagreements seem so deep.
A low dollar is generally favorable to dollar-denominated commodity markets.
COMMITMENTS OF TRADERS
The weekly COT (Commitments of Traders) report of the Commodity Futures Trading Commission (CFTC) shows all the positions opened by all market participants. The COT report is published on Friday, and reflects the open positions on Tuesday of the same week. It shows the position of commercial traders (producers, commodity buyers, ...) but also non-commercial (speculators).
The net positions of speculators on the futures markets are particularly interesting to observe.
The net speculative position on the copper futures markets is up this week to 80.039 K instead of 79.856 K.
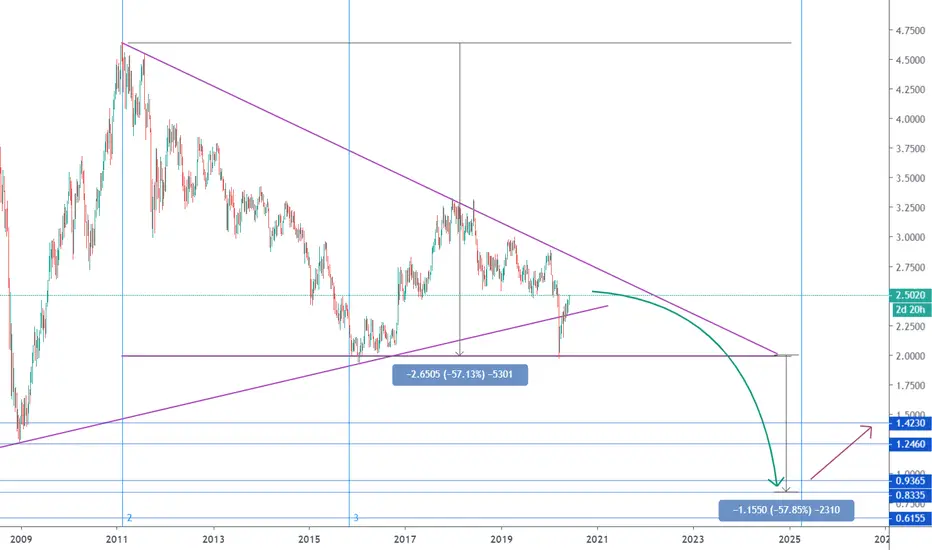
$1 Copper by 2025Time Fib plus a descending triangle plus some economics about commodity prices and the deflationary dollar for the next 2 years; all that says that copper is dropping by 43% from its current price at $2.5 per pound, reaching $1.42 by the end of 2022. This breaks the descending triangle downward setting a target of $0.83. It sounds crazy, but I'm simply looking at the chart. The Fib zones time the reversal to take place in late 2024 early 2025 where the nearest resistance is the $1.25 to $1.42 range.
Very stable growthVery firm trend, the growth has slowed down a bit hence let's accumulate some strength and break the next level! Don't forget about strong commodity trend
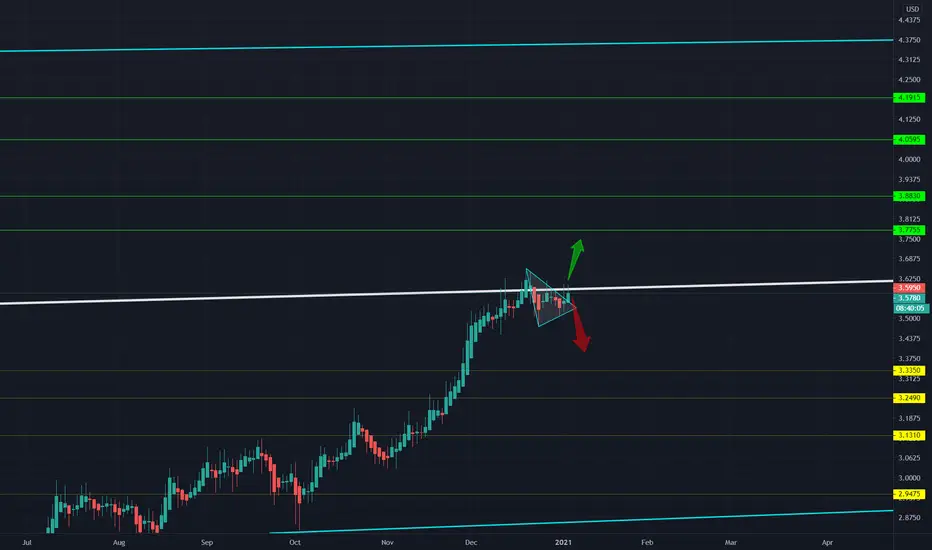
COPPER- Offering us a second chance to SELLThis is our small chart for Copper.
As you can see from previous ideas we were able to sell it at a perfect time right on the mega-resistance . That level is a massive barrier that Copper will find great difficulty breaking.
The take profits are on our previous charts