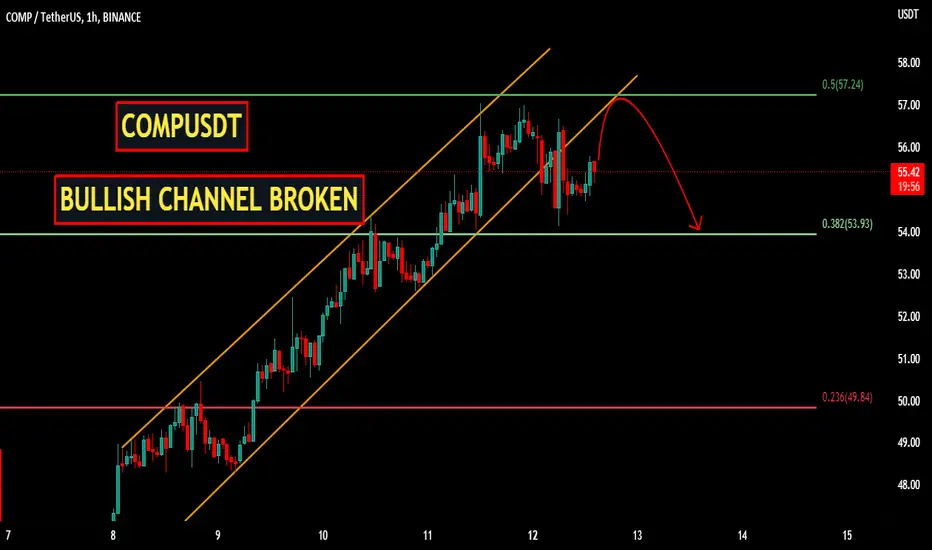
COMPUSDT | BULLISH CHANNEL BROKENCOMUSDT after taking support from horizontal zone started to trade in a parallel channel . The price has approached to lower boundary of channel and broken below the channel. The price may retest the broken support and 0.50 fib level too. The bearish candles formation near the resistance will confirm the rejection and price may fall to 0.382 fib level.
The bears will be in control below the break of channel.
Trade your levels accordingly.
COMPUSDT.P trade ideas
Comp usdt pair 10% profitIf in 15 minutes timeframe Comp break the parallel channel and it create one candle below the cloud than you can open a short trade for it and take profit can be 48. Trade with your own risk. In the end of the day profit and loss both is yours.

Buy ideaCompound is likely going to go up. still, the local correction may take some more time.
Assumption is based on the clear impulse on the left side of the chart, that is not a part of a bearish corrective structure.
Shall see.
Take care

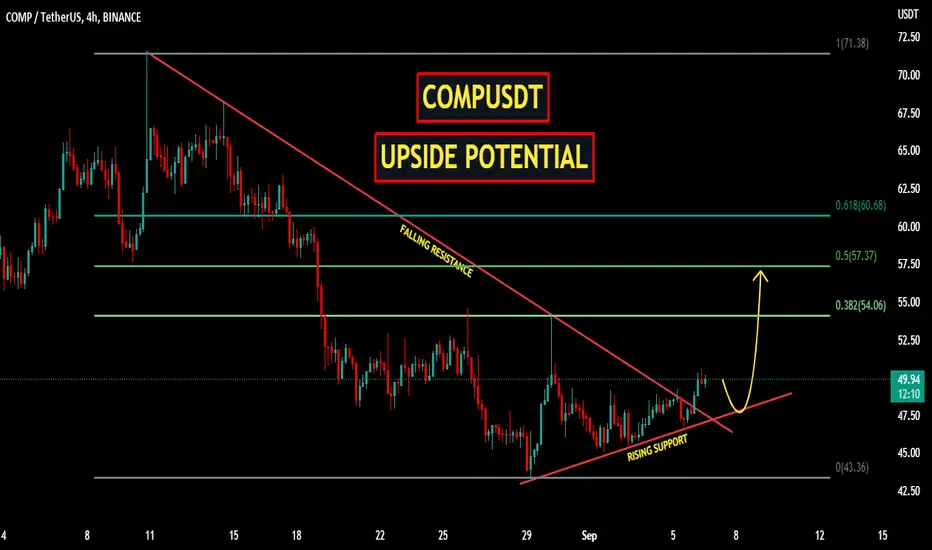
COMPUSDT | UPSIDE POTENTIAL COMPUSDT has been in a downtrend after making a top around 71 and trading under the falling resistance. Now the price has broken above the falling resistance.
We are expecting bullish trend after breakout . The price need to hold the rising support.
The bulls are in control. While bears will be active below the break of support.
Trade your levels accordingly.
$COMP so ready for a full blown reversal #comp #compusdtThe overall pattern is a massive inverse fibonacci that's had a 227 touch followed by consolidation, & now, a higher low. The price will, I suspect, now form a regular fibonacci and touch the extension marked, which lines with the last price level on the small time frame. I suspect it will retrace there slightly, then continue up further. My ultimate target (in the coming weeks) is around $240, where the MA's/price levels are on the month chart. I see the stoch rsi on the week turning up to support this theory.

compusdtcomp usdt has completed 12345 wave count and we may see abc correction .harmonic butterfly is also aligning .expecting some up movement from here on comp
NFA DYOR

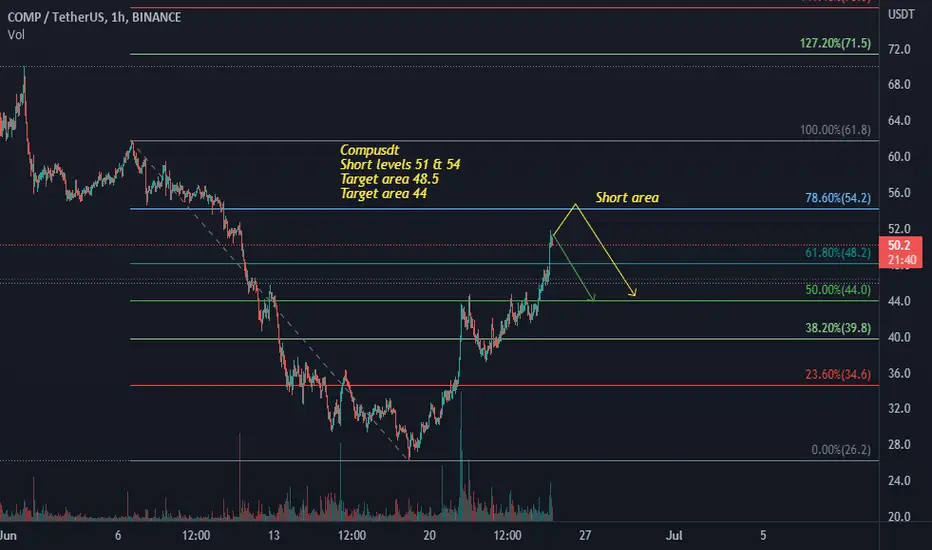
Short COMPCOMP is about to hit its resistance and these are the targets for its corrective move. I have the ABC correction aligned with fib levels. I expect COMP to retrace based on other indicators I see on the higher time frames. The RSI and Momentum have been over extended for quite awhile. I don't see it breaking its resistance like that.
This chart based off of The Elliot Wave Theory, Fibonacci, EMA’s, MacD , RSI , Momentum, and resistance/support zones combined with patterns.

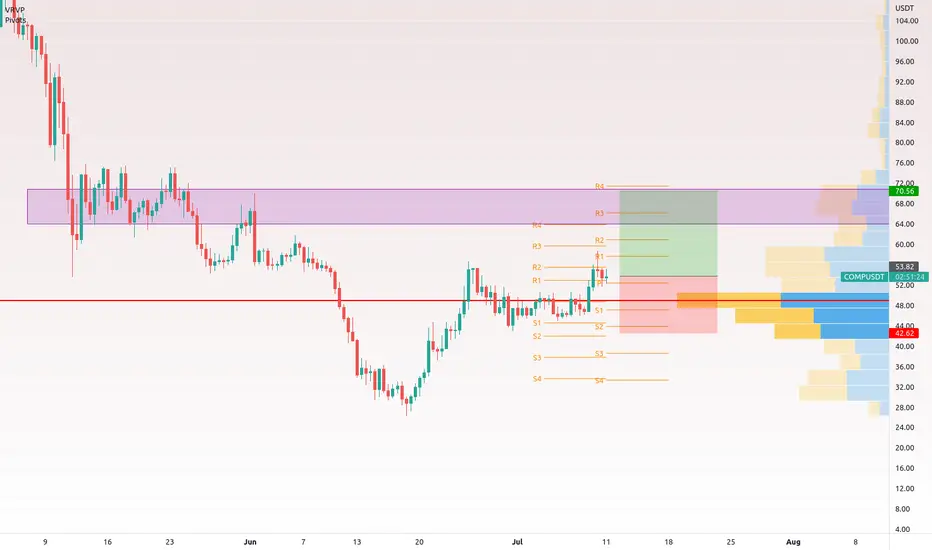
COMPUSDT wants to retest the dynamic support?The price is testing the 0.5 Fibonacci level below the 4h resistance after a clear breakout from the daily resistance at 64$ area.
The market got the liquidity with a spike from the 68$
How to approach it?
IF the price is going to lose the daily support and retest the previous support as new resistance we could see a retest of the dynamic support of the ascending channel, so According to Plancton's strategy , we can set a nice order
–––––
Keep in mind.
🟣 Purple structure -> Monthly structure.
🔴 Red structure -> Weekly structure.
🔵 Blue structure -> Daily structure.
🟡 Yellow structure -> 4h structure.
–––––
Follow the Shrimp 🦐

$COMPBuy setup
1. Bullish OB mitigated
2. RSI Bullish divergence
3. Broke above the CHOCH
Entry at OB

long trade setup price is breaking major trendline support bulls break this falling resistance so we can expect rally on this coin but at ur own levels

COMPUSDT | BUY ON BREAKOUTCOMPUSDT has been in a downtrend after making a top around 71 and trading under the falling resistance. Now the price has approached to falling resistance.
We are expecting a breakout above the falling resistance. One can take buy position after breakout and price sustained above it.
The bulls need to break above the falling resistance. While bears will be active below the falling resistance.
Trade your levels accordingly.

$COMP $COMPUSDT Large Inverse Fibonacci + Wedge-breakout coming?Like with most charts, I like to zoom all the way out to the monthly to see the larger picture at play. Here, it looks to be like there is a large inverse fibonacci retracement happening, in which the price has already hit the 227 extension. Combined with this, it looks as if the price has fallen within this large wedge, of which the month of July broke out of. Also, the price is squarely resting on the all time point of control. Lastly, the stoch rsi on the month is extremely flat and crossed. It looks to me as if the price is due for a move up! I do see a tiny fibonacci on the smaller time frames (an inverse one), that could result in the price dropping further from here. It just would seem unlikely to me though, given everything else I've mentioned that the chart has going in favor of a bullish scenario. That said, BTC to me looks as if it's got a bit of dropping left, and that could possibly affect the price trying to squeeze out any last bit of dropping possible.

$COMP ...If BTC don't ruin the partyTrendline break and retest on support with ema's in favor...if btc doesn't drop we gonna hit target

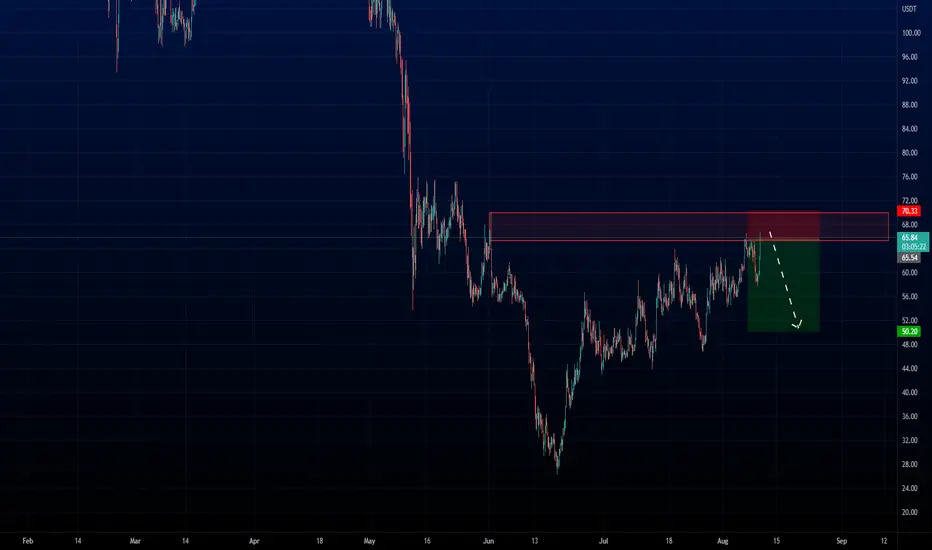
COMP squeezeIt seems that there is some sort of short squeeze being prepared here on COMP.
Expecting that former support will act as resistance, between $68 and $73.
Abandon ship if BTCUSD tanks. Good luck.
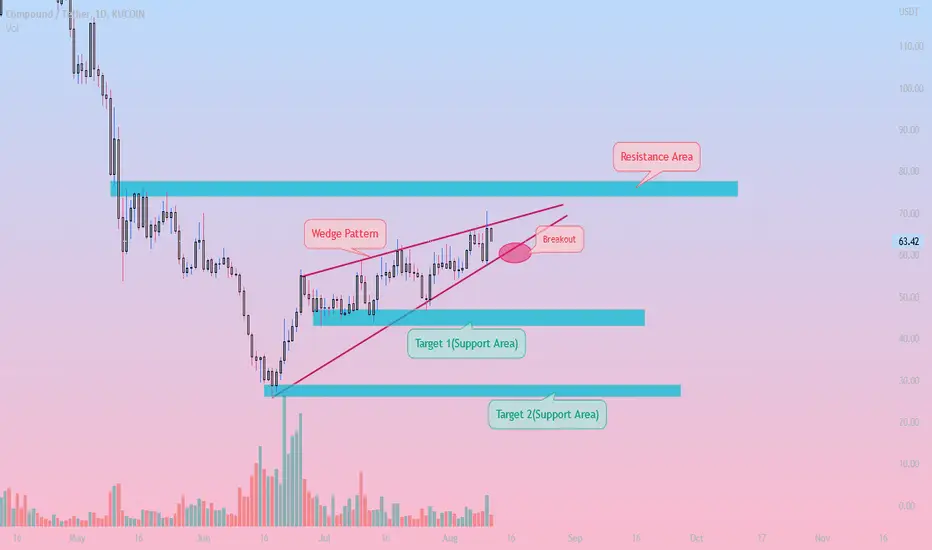
COMP is trying to breakout Rising wedge pattern Hello guys ,Today i saw an interesting wedge pattern on Compound and i thought it will be a good setup.
open your position after breakout.(wait,don't open your position fast !)
first target is between 43.00 and 47.00.(it's safe to close your position)
but if it's going to break the first Support Area , you can close your order between 26.00 and 29.00.
it's just an idea , always do your research and analysis.
don't forget to follow and boost this idea :) thank you.
COMPThe price failed to break through the upper border of the channel again. Bearish divergences formed. Probable scenario - price correction to 200 EMA and the middle border of the channel

COMP/USDT SHORT1. Broken support zone .
2. Entering a position on a retest.
3. Trade in the direction of the trend.
COMPUSDTPrice is trading in a nice upwards channel, in a support/resistance flip. Looking to find support at the flip or trading below and create a fake out .

COMPUSDT LongPure Price Action
Entry 1: 58.70 - 58.50
Entry 2: 57.20 - 56.40
TP 1: 72.00
TP 2: 80.20
TP 3: 97.00
NFA

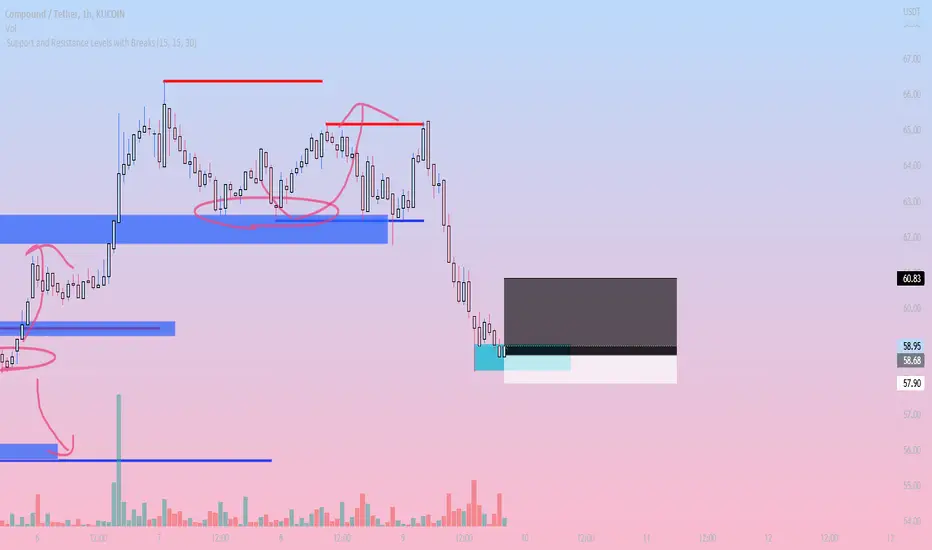
COMP/USDT Long position COMP/USDT Long low risk position (just technical analysis , no funda)
Open: 58.68
Target 1: 60.83
Stop loss: 57.90
COMPThe price rose again to the upper border of the channel. An ascending bearish wedge is forming, and the price is close to the overbought zone. a correction is possible if the price rises to the upper border of the wedge

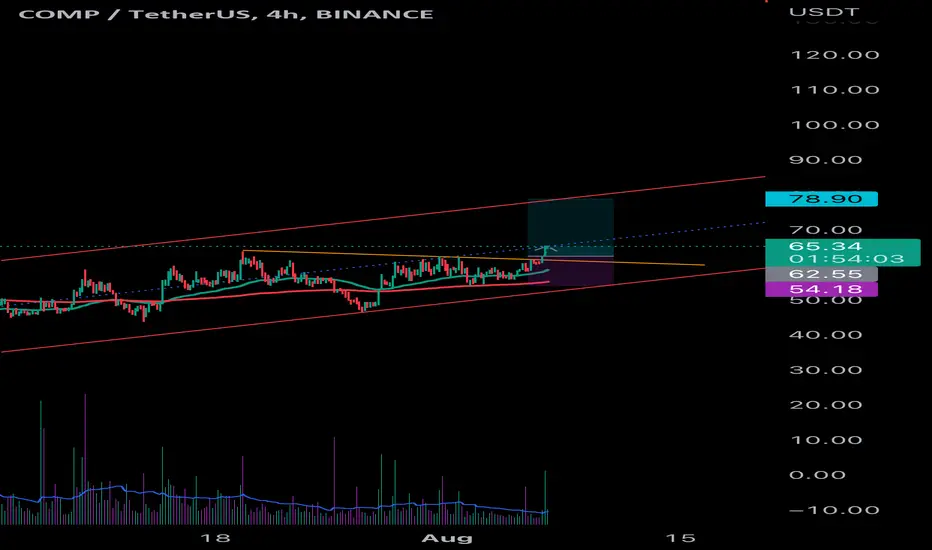
CompusdtCompusdt
Entry:62
Stoplost:54
Target:78.90
Compusdt has new monthly high and breaked line also make entry place
Achakzai