✴️ Compound Up Close (Correction Ends, Bulls Prepare Up)Up close, Compound is looking really good when it comes to the end of the corrective phase that started mid-July, let's dive into this chart.
COMPUSDT 4H TF
A low happened 9-July and all action is happening above this level, giving us a strong signal of strength.
The current price trades above 0.5 Fib. retracement which was tested twice and holds.
Finally, volume dropped massively after 7-Aug, telling us the correction lost strength.
After going sideways a few days, COMPUSDT is now moving above EMA50 with EMA21/10 already behind it and the indicators going bullish. MACD above zero and RSI above 57.
All these signals are pointing to the correction reaching its end.
Stronger support available lower and above $62 the bulls become really strong on this timeframe.
✔️ Once COMPUSDT moves and closes above this level, we can expect a new long-term higher high.
Let me know in the comments if there are any Altcoins you want me to look at, meanwhile I shall update the ones moving strong.
Namaste.
COMPUSDT trade ideas

COMP USDT PERPHello Trader BINANCE:COMPUSDT.P
looking at the previous chart there was a block order at 57.48
and the area rejected to go down. now still in the rhythm of the pattern
still strong to go up. long area at 55.21 or can be market price
from now on
Please add a comment and Positive feedback and
constructive criticism are important to authors and the
community.
Disclamer: Not Financial Advice
COMPUSDTHello traders
AS the USDT.D is seizing all the market focus on short positions .
COMP one of the best for buy when hit the drawn support.
Dangerous trendline is broken .
comp technical Analysis#COMP Technical Analysis
NYSE:COMP had break down its major support line, and currently trading at 55.5$ the.
The next support is 51$ and it has alteady tested it once,
it will test again this support if its breakdown below it than the next level will be 46$, That i will suggest the best point to dca yous position,
or may be this will remain between 55-51$ price for quite long term if this happens than we will see some good price in comp.
But for Now the party has been already over for comp arriving late in the party always is not good,
advice: don't try to enjoy the party that has already been over
COMPUSDT Can Explode at Any Moment | Compound Analysis Today💎 COMPUSDT is showcasing an optimistic outlook, poised to accelerate its momentum imminently.
💎 Notably, COMP has been tracing the Elliot Wave sequence from 1-5. Post this wave, the price underwent a correction and revisited its support.
💎 At this juncture, COMP has secured liquidity and seems prepped for its subsequent ascent. Yet, caution is advised as a dip below the $49-$47 support range could alter the course.
💎 The primary and secondary support zones emerge as promising entry points to capitalize on this anticipated bullish surge.
💎 In the ever-evolving realm of crypto, staying informed is the key to thriving. Stay tuned and navigate your trading journey wisely with #MyCryptoParadise.

COMPUSDTit's touching to beginning of last trend then i think it become demand. Now this is doing trend downward soon down trend going choch


Comp analysis (4H)Hi, dear traders. how are you ? Today we have a viewpoint to BUY/LONG the COMP symbol.
comp can go up to targets by breaking the TL line. If it reaches the green box once again, it is suitable for oscillation.
For risk management, please don't forget stop loss and capital management
When we reach the first target, save some profit and then change the stop to entry
Comment if you have any questions
Thank You

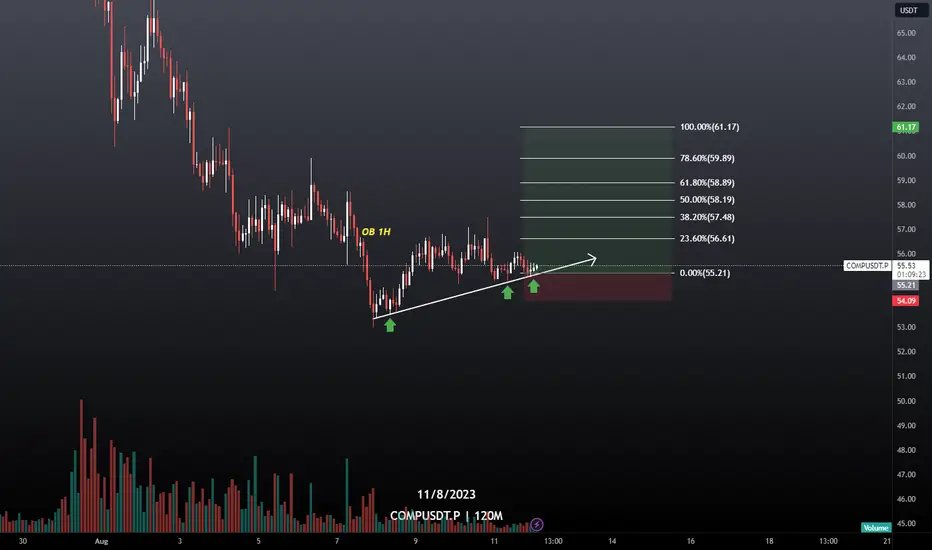
COMP USDT PERP Hello Trader BINANCE:COMPUSDT.P
comp usdt. retail block order area
long position at 56.89 to 56.27
can be limit buy in the area
area because usually bounce back support area
Please add a comment and Positive feedback and
constructive criticism are important to authors and the
community.
Disclamer: Not Financial Advice

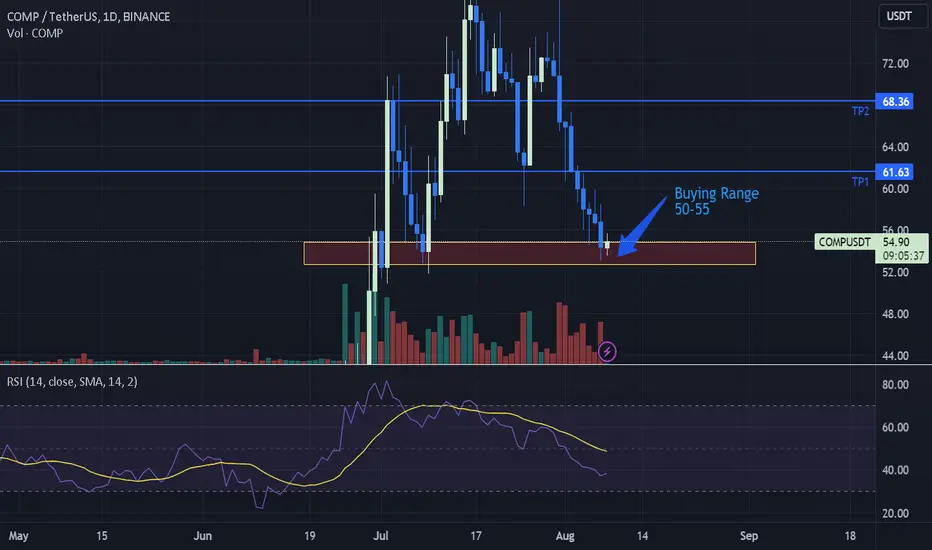
COMP/USDT Swing setupSmaller allocation as the entire market is a bit strong on the bearish side. Buying range and TPs mentioned.
✴️ Compound Likely To Recover (Resume Growing)The daily chart looks crappy and it is hard to predict when a correction will end but the 4H chart is starting to show some early recovery signals.
Compounds (COMPUSDT)
We have 5 signals that are pointing towards and up-move.
Remember, if this one moves everything else does the same and many are already breaking bullish.
1) Higher lows. This can be seen easily on the chart so it needs no explanation.
2) High volume on the last session, several times above the average.
3) Double bullish divergence. With the MACD and RSI.
4) Bullish hammer and Doji. Both can work as reversal signal, the Doji with high volume giving strength to the hammer.
5) Altcoins market continues with a bullish bias.
The hammer is invalidated on a 4h close below $54.
The chart in general can change but as it looks now, the bulls are waking up.
Namaste.

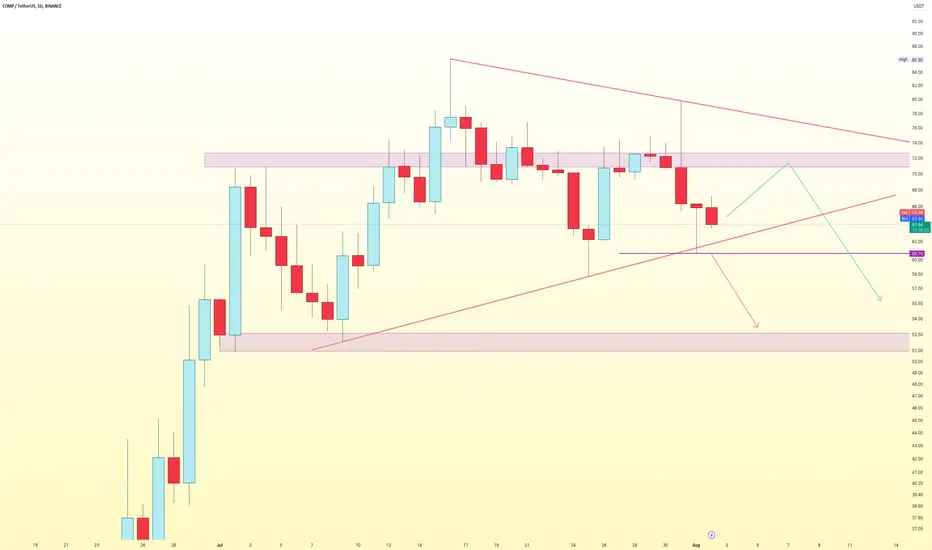
Triangle Pattern | $52Daily Chart
Compound BINANCE:COMPUSDT is in the triangle pattern and trading at 63.9x
Compound rejected 3 times from the support. That means it can go up to the resistance around 72 or further higher trend line
If Compound close below 60, it will go down the support around 52
Wait for next move
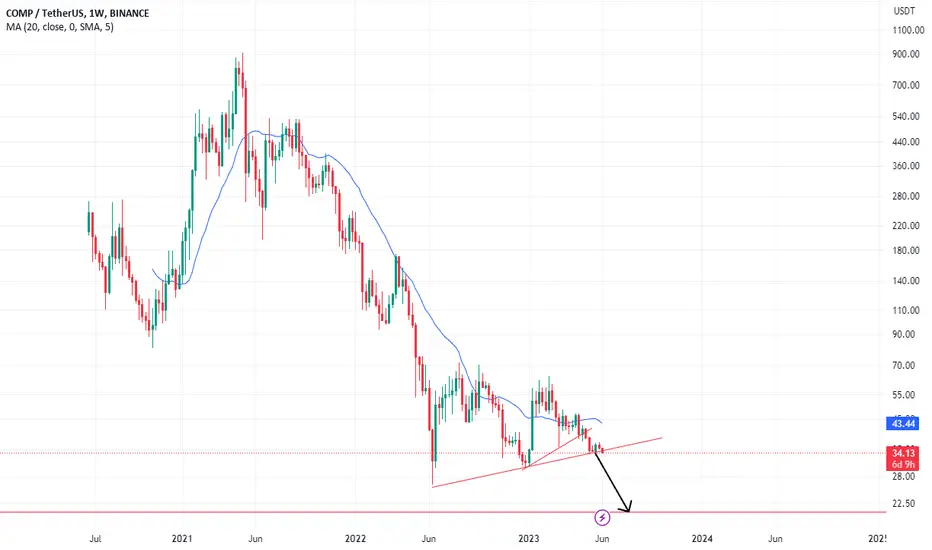
#COMP_USDElliott Wave count bearish scenario
COMPOUND wave 4 complete wave 5 start now my target usd 10 usd 5

already looks ShortLook at my last idea, I think it has completed wave B and is on its way to wave C.
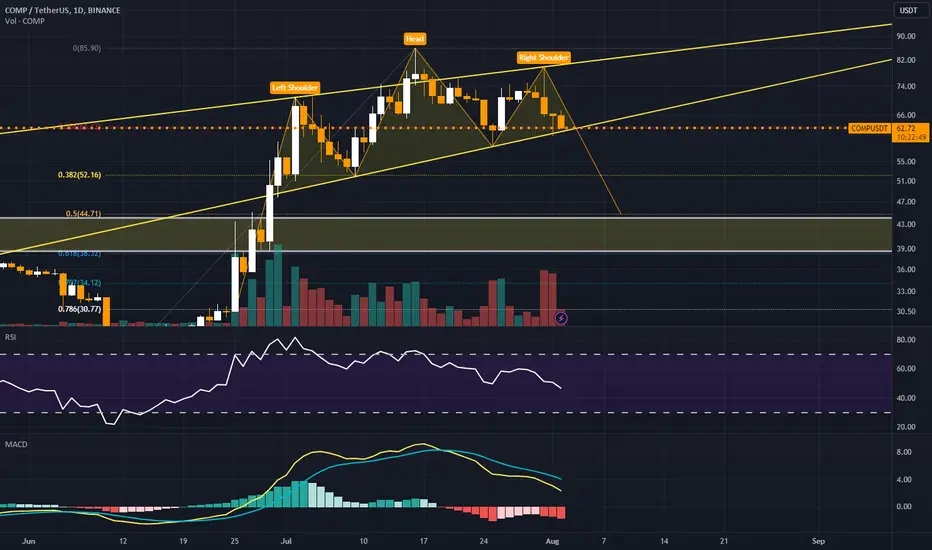
If this idea is realized, the pattern of the head and shoulders can also be confirmed according to the figure.

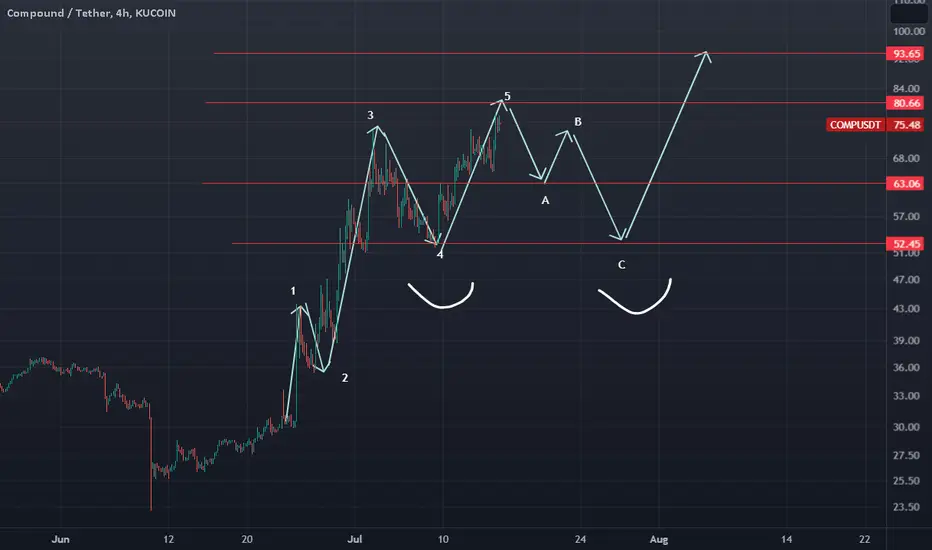
looking for a correctionMy previous idea stoped . Sometimes we have a multiple wave for wave 3. Therefore, the 3rd wave can be completed and we are now completing the 5th wave. Divergence is also evident between waves 3 and 5. The distance between the peaks and the previous bottoms gradually decreases.
Therefore, I still expect that we have a wave-like correction before climbing to the $93-$117 range. In this case, the range of $63 and $52 will play the role of strong supports and it is unlikely that the price will be able to fall below the range of $52.
The general trend of this coin is upward and it pursues high goals, and the period of this analysis is short-term.

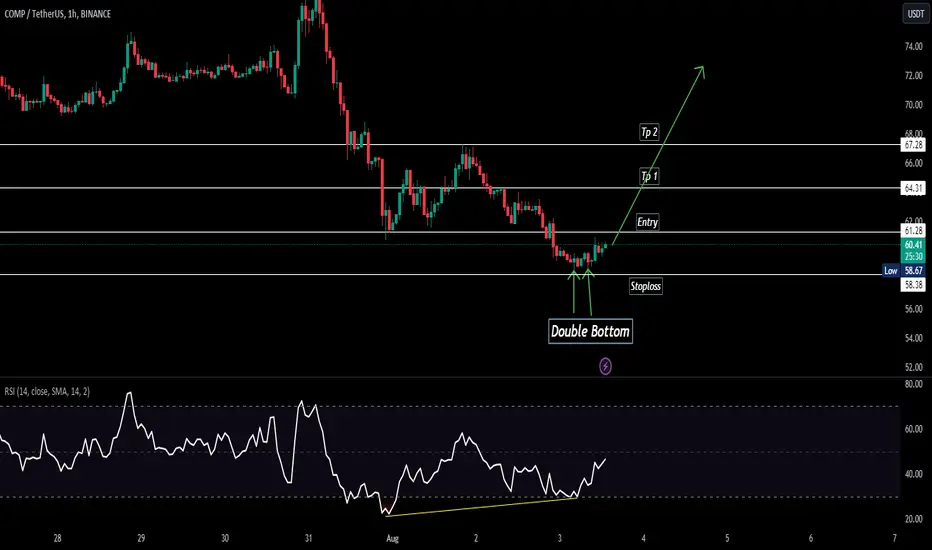
COMPUSDTCOMPUSDT Just enter into the bullish phase.
Bullish divergence also form.
Double bottom reversal pattern also form.
This two reversal indicators strongly indicates that the trend is going to reversal from here.
we wait and watch for the breakout of last HH.
COMP come back to monthly supportThe instrument was heavily overbought and has been in a downtrend for a couple of days now, there is a strong support level at 58.50, which we have already hit once, according to the fixed volume profile, we can see that we have already gone beyond the lower part of the trade and soon the support level will be broken. I expect a small trade near the 58.50 level and an impulse breakout into the short.

Beware H&S comingI don't like what compound it's drawing in daily time frame, so beware if the resistance will break, surely we will touch 44/33 USD
COMPusdtThe COMP token has been experiencing a continuous downtrend, and there are indications of a potential (ChoCh) pattern, which could signify a trend reversal. It may be worth considering a long position at this point, with a target set before the entry point for a short position. However, please be aware that trading decisions should be made carefully, considering market conditions and your risk tolerance.

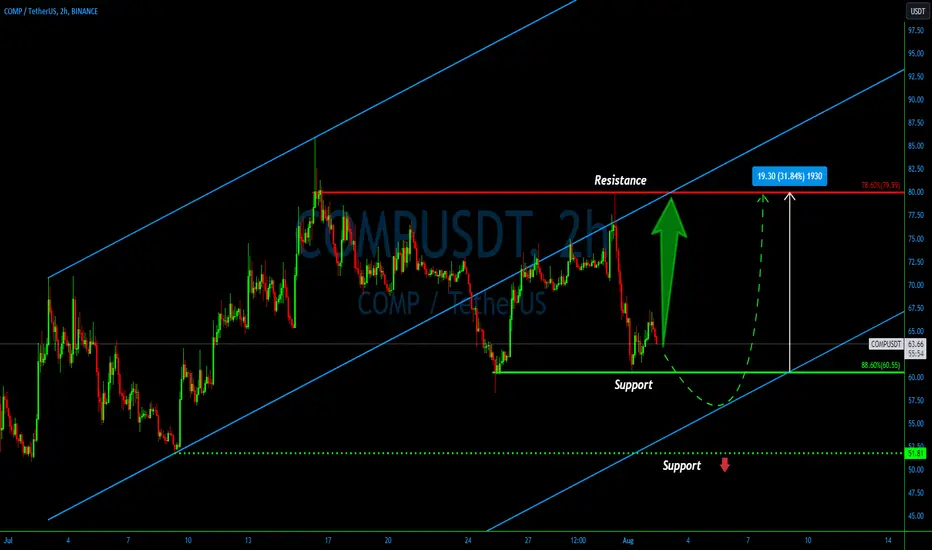
COMPUSDT could be Aiming for 30% Growth in the Blink of an Eye💎The low timeframe analysis of #COMPUSDT reveals that a consolidation phase has commenced after the price broke below the descending channel. Notably, there have been two significant bounces during this phase—one from the 78.6% Fibonacci resistance level at $80, and the other from the 88.6% Fibonacci level near the psychological support at $60. While the overall trend remains bullish, the current stage seems to favor buyers.
💎As #COMP continues to trade near the lower boundary of the formed range, buying interest is likely to increase. However, it is essential to be mindful that before any significant price surge, #COMP may enter the buying liquidity zone, which lies just below the recent low at $58.35. In such a scenario, the bottom of the extended descending channel could be tested.
💎On the other hand, if the extended descending channel is decisively broken, and the price falls below the $51.81 support level, bullish sentiments may wane as increased selling pressure could emerge. In summary, while the probability of an uptrend is currently high, there is potential for a relatively fast 30% price increase. 💎
COMPUSDTHello Trader,
Short comp right now as we can see that COMP had made a double top and it is below the 200ma so we can expect a bearish trend from here short it.

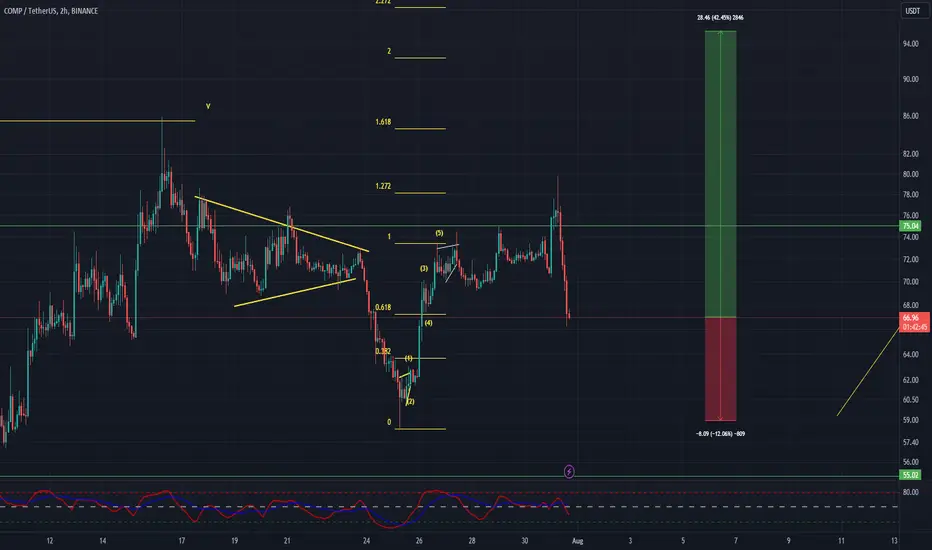
COMPUSDT Elliott Waves AnalysisHello friends.
Please support my work by clicking the LIKE button👍(If you liked). Also i will appreciate for ur activity. Thank you!
Everything on the chart.
Entry: market and lower
Targets: 84 - 90 - 95
after first target reached move ur stop to breakeven
Stop: ~59 (depending of ur risk). ALWAYS follow ur RM .
RR: 1 to 4
risk is justified
Good luck everyone!
Follow me on TRADINGView, if you don't want to miss my next analysis or signals.
It's not financial advice.
Dont Forget, always make your own research before to trade my ideas!
Open to any questions and suggestions