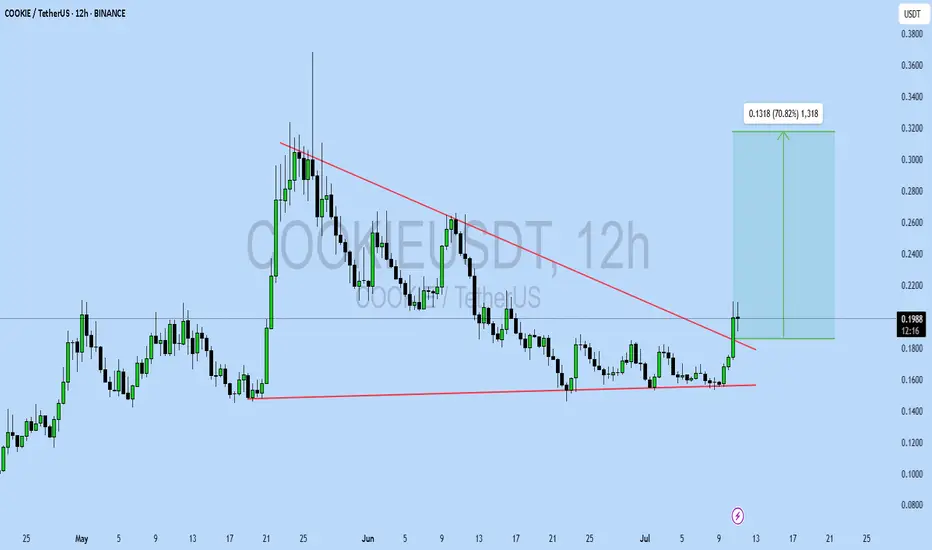
COOKIEUSDT UPDATE
Pattern: Falling Wedge Breakout
Current Price: \$0.1996
Target Price: \$0.32
Target % Gain: 70.82%
Technical Analysis: COOKIE has broken out of a falling wedge pattern on the 12H chart, supported by a strong volume surge. The breakout is confirmed with a close above the trendline, indicating bull
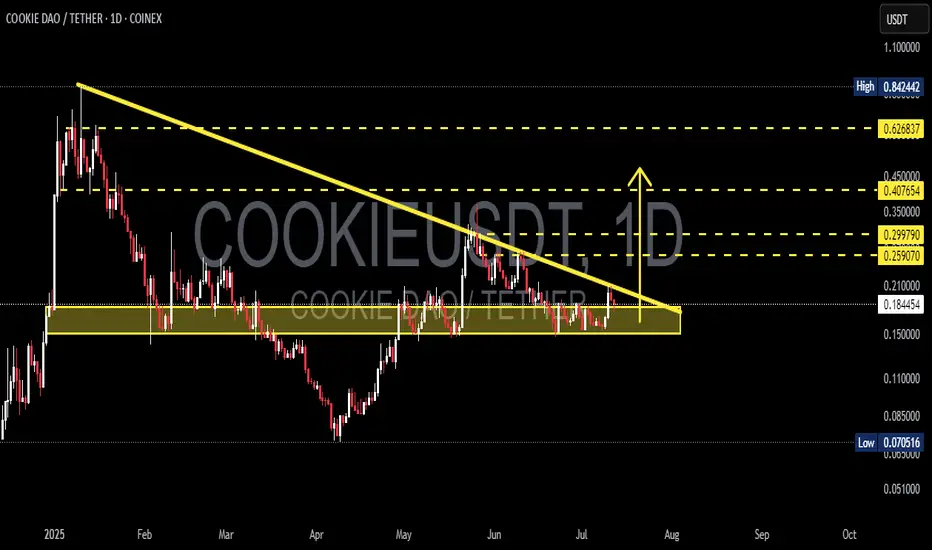
COOKIE/USDT on the Verge of a Breakout? Descending Triangle
📊 Complete Technical Analysis
COOKIE/USDT has been forming a classic Descending Triangle since February 2025, indicating prolonged market consolidation. Sellers have been pushing the price down gradually (lower highs), but buyers have strongly defended the horizontal support around $0.16–$0.18.
N
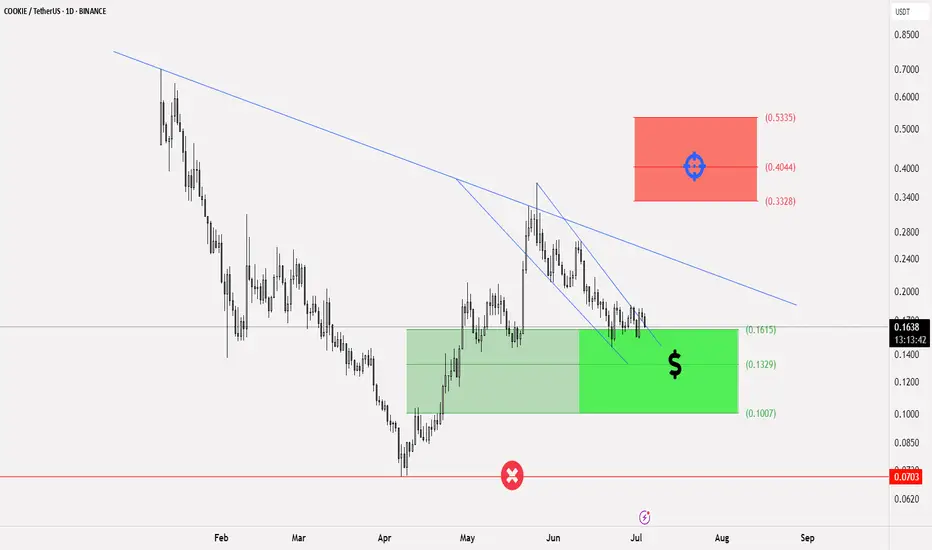
Swing Trading Plan For COOKIEUSDTBINANCE:COOKIEUSDT
📄 Trading Idea
💵 Currency $COOKIE
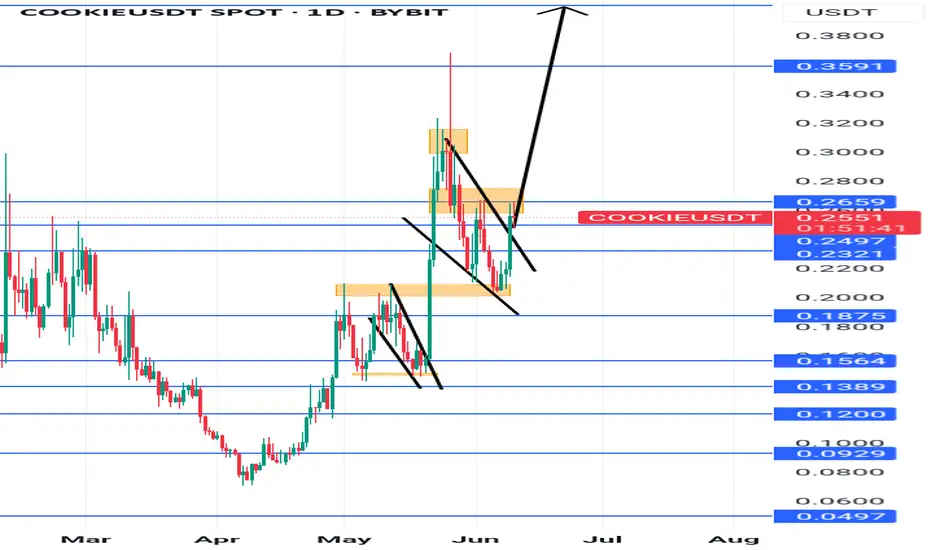
📄 This path is considered positive and forms a Falling Wedge pattern
⭕️ Entry points for this currency: current price 0.1640 and at 0.1329 - 0.1007 at the same size if it experiences a drop
◀️ This is the main support range for the currency t
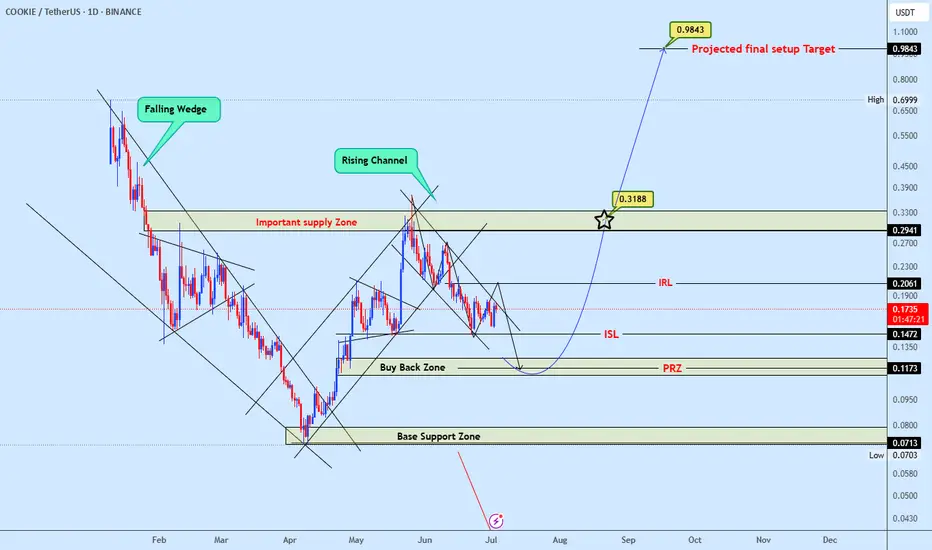
Cookieusdt trading opportunityCOOKIEUSDT has broken down from its rising channel and is now heading toward a potential reversal zone. If price finds support and reacts positively from this area, a move toward the important supply zone is expected. A confirmed breakout above this supply zone would open the path toward the project
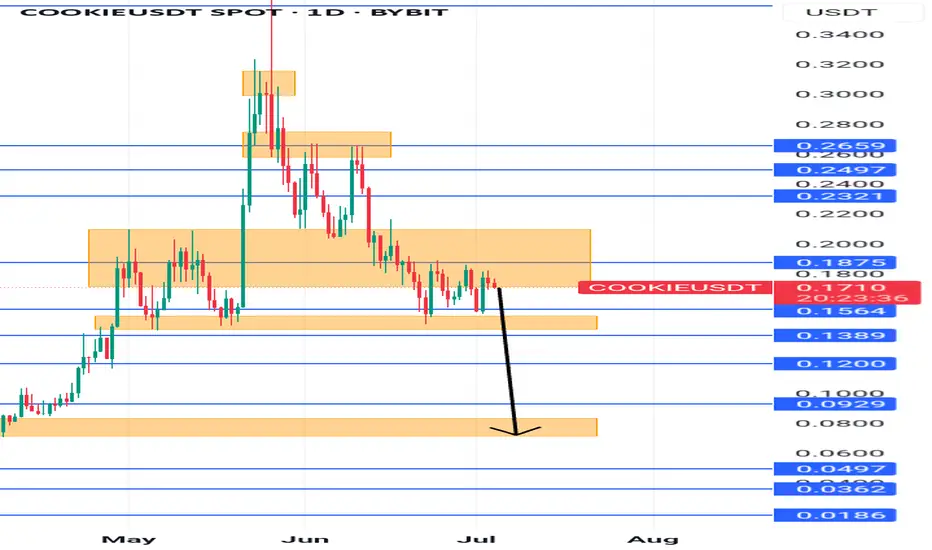
Bearish opportunityThere is a H&S pattern that is currently in play, the sell movent has already started but its still in its initial stages.
A sell position current with a stop loss slitely above 0.1875 and a take profit at 0.00712 would be most ideal.
A conservative trader can go with the most recent structure wh
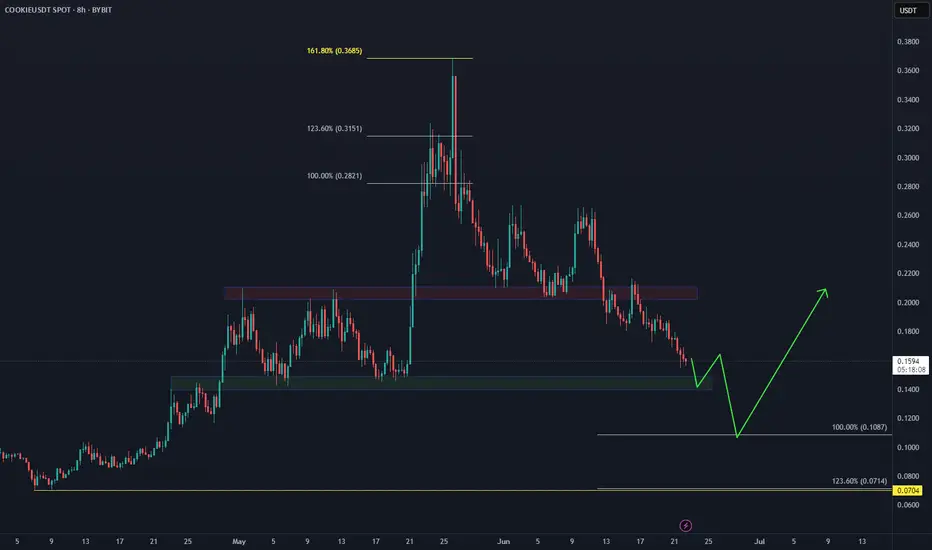
COOKIE Failed to Hold $0.20 ! What's Next ?BYBIT:COOKIEUSDT bounce attempt fizzled, and price broke lower below $0.2 — now heading toward the $0.14 support zone, with Fibonacci extension at $0.10 in sight.
Will bulls defend the April low and spark a fresh rally from here? Eyes on the reaction.
COOKIE Holds Above $0.2—What’s Next?📊 BINANCE:COOKIEUSDT has bounced off the support area at $0.2, signaling the start of a potential upside move that could take it toward $0.5.
🚀 Will momentum carry it higher, or is another test of support coming first?
Potential Bullish MoveA buy position is ripe. A clear retest has happened and it is just a matter of time before price shoots upwards.
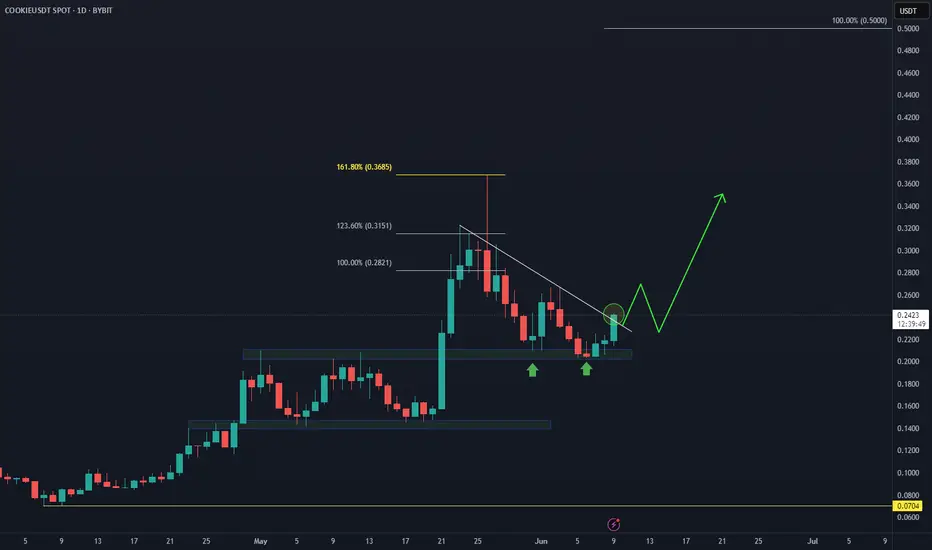
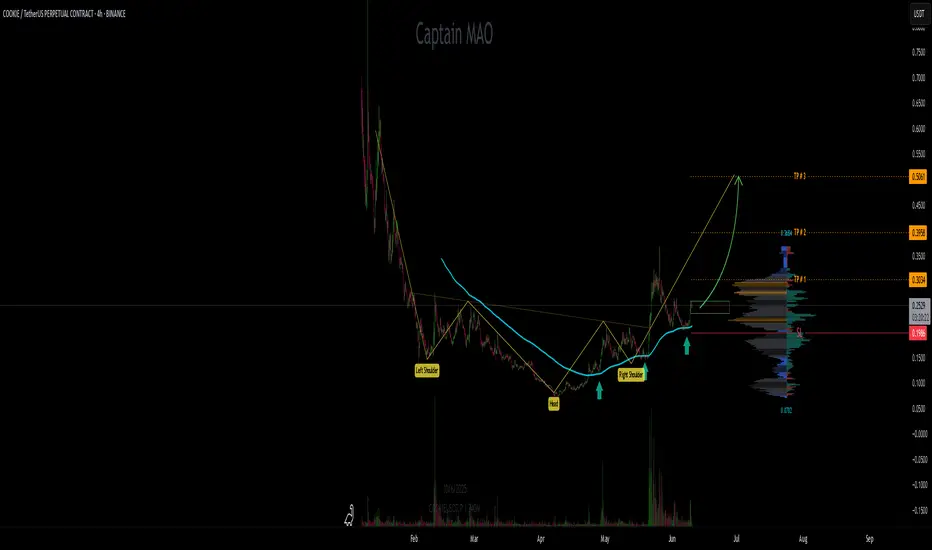
COOKIE/USDT H&S +100d Accumulation COOKIE has broken out of a 100-day accumulation range with strong buy volume stepping in. The $0.20 level continues to act as strong support, holding firmly through recent price action.
Additionally, price has formed a clear and well-defined Inverse Head and Shoulders pattern, now targeting the com
Could $COOKIEUSDT be heading to $0.60??BINANCE:COOKIEUSDT has been retracing for a while following massive bullish rally the previous month. It seems to have broken out of a bearish trendline after retesting a support zone twice and also putting a bullish divergence in the process. So lookout for a move to about $0.60
Be on the look ou

See all ideas
Summarizing what the indicators are suggesting.
Oscillators
Neutral
SellBuy
Strong sellStrong buy
Strong sellSellNeutralBuyStrong buy
Oscillators
Neutral
SellBuy
Strong sellStrong buy
Strong sellSellNeutralBuyStrong buy
Summary
Neutral
SellBuy
Strong sellStrong buy
Strong sellSellNeutralBuyStrong buy
Summary
Neutral
SellBuy
Strong sellStrong buy
Strong sellSellNeutralBuyStrong buy
Summary
Neutral
SellBuy
Strong sellStrong buy
Strong sellSellNeutralBuyStrong buy
Moving Averages
Neutral
SellBuy
Strong sellStrong buy
Strong sellSellNeutralBuyStrong buy
Moving Averages
Neutral
SellBuy
Strong sellStrong buy
Strong sellSellNeutralBuyStrong buy