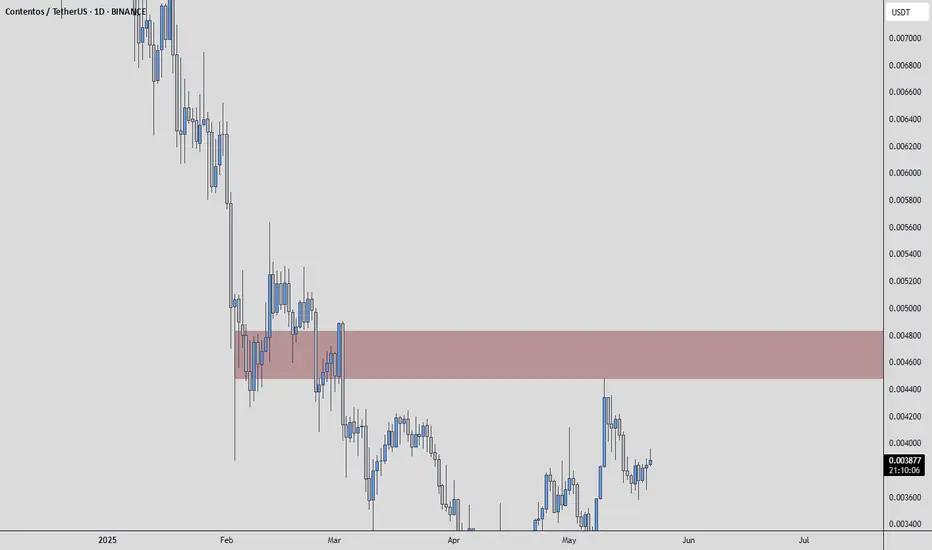
COSUSDT | Watching for a Breakout, Not Guessing OneI’m not rushing into COSUSDT just yet. The red box is still acting as resistance, and until it's broken and retested as support , there’s no valid reason to turn bullish.
This market rewards patience . Not blind hope.
Wait for structure. Wait for confirmation. That’s how you stay ahead.
“I w
COS/USDTKey Level Zone: 0.003380 - 0.003400
HMT v8.1 detected. The setup looks promising, supported by a previous upward/downward trend with increasing volume and momentum, presenting an excellent reward-to-risk opportunity.
HMT (High Momentum Trending):
HMT is based on trend, momentum, volume, and market

COS/USDT Summary$COS/USDT Summary:
#COS Current range of $0.0070-$0.0076 suggests potential bullish breakout.
Bullish: Break above $0.0080 targets $0.0100-$0.0130
Bearish: Drop below $0.0070 could retest $0.0060

Bullied and forgotten?Sometimes some coins get bullied and forgotten? Is there still some love in this one?
Just posted to watch and eating popcorn.

COSUSDTHMT v1.0 spotted. Looking good with previous wave up with increasing volume and momentum.
- BOS (Breaks of Structure) at @ 0.010822-0.11085 level
- Trending slow and steady if able to hold above the BOS level
It is at extremely good reward to risk level.

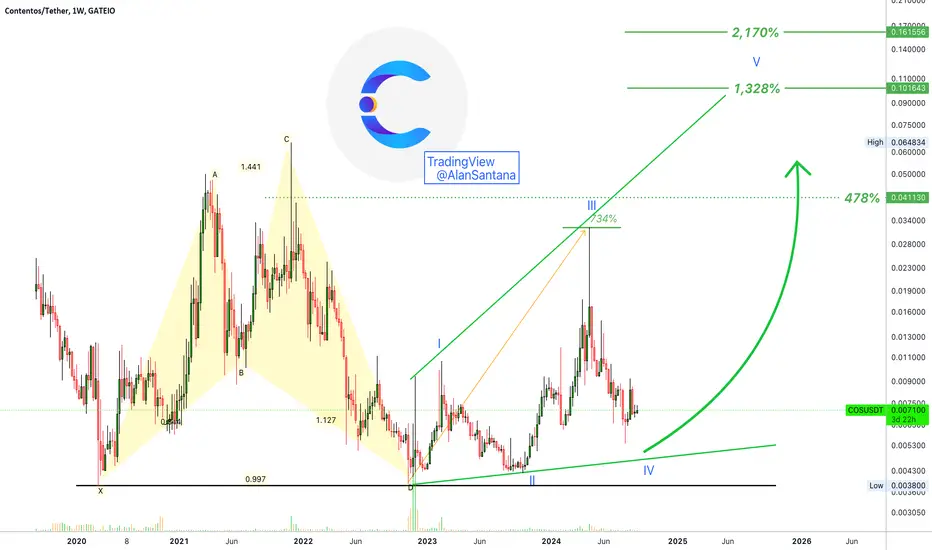
Contentos New All-Time High Revealed (14-22X Potential)Contentos has been printing higher lows since 2020. The latest, major low, happened November 2022, together with Bitcoin. This low led to a strong bullish wave, long-term, that peaked April 2024, a little bit after Bitcoin. Total growth amounted to 734%.
Based on the lows from October 2023 and Nove
COSU/USDT 💰 #COSU/USDT
I see no other option but $COSU is breaking out of the rounding bottom accumulation🚀
✔️1TP - 0.013249 $
✔️2TP - 0.018894$
✔️3TP - 0.026249$

Trade Signal for COSUSDT: Buy OpportunityAttention Traders,
We have identified a promising opportunity in the COSUSDT currency pair. Based on our analysis using the EASY Quantum Ai strategy, we recommend a Buy position at the current enter price of 0.006479.
Direction: Buy
Enter Price: 0.006479
Take Profit: 0.00662733
Stop

upwards pushTodays charts are more or less similar.
H4 golden cross with retest of ema21 that formed a bullish engulfing pattern.

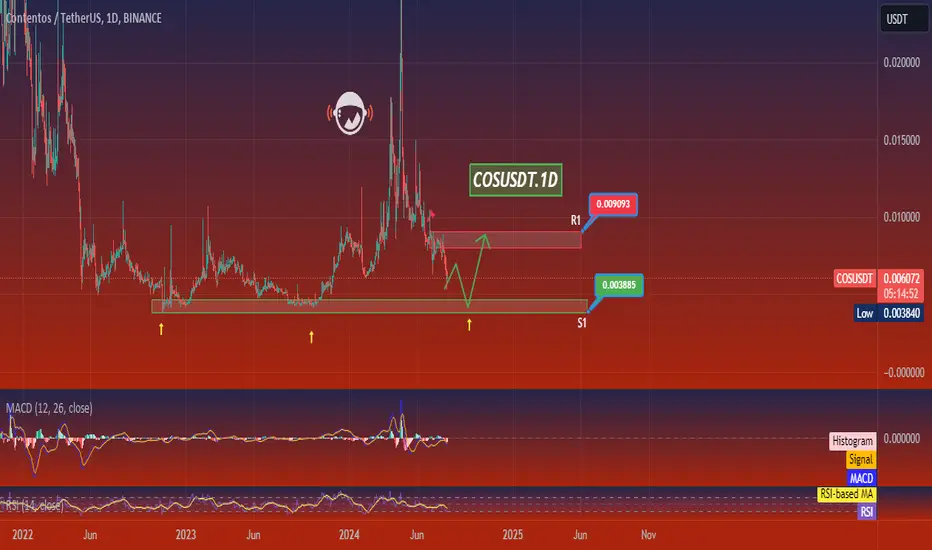
COSUSDT.1DIn my recent technical analysis of the COS/USDT daily chart, I've identified several crucial elements that suggest potential future movements. First and foremost, it's noticeable that the Ichimoku calculation has failed, suggesting a need to reapply or adjust this indicator for more accurate insight
See all ideas
Summarizing what the indicators are suggesting.
Oscillators
Neutral
SellBuy
Strong sellStrong buy
Strong sellSellNeutralBuyStrong buy
Oscillators
Neutral
SellBuy
Strong sellStrong buy
Strong sellSellNeutralBuyStrong buy
Summary
Neutral
SellBuy
Strong sellStrong buy
Strong sellSellNeutralBuyStrong buy
Summary
Neutral
SellBuy
Strong sellStrong buy
Strong sellSellNeutralBuyStrong buy
Summary
Neutral
SellBuy
Strong sellStrong buy
Strong sellSellNeutralBuyStrong buy
Moving Averages
Neutral
SellBuy
Strong sellStrong buy
Strong sellSellNeutralBuyStrong buy
Moving Averages
Neutral
SellBuy
Strong sellStrong buy
Strong sellSellNeutralBuyStrong buy
Displays a symbol's price movements over previous years to identify recurring trends.