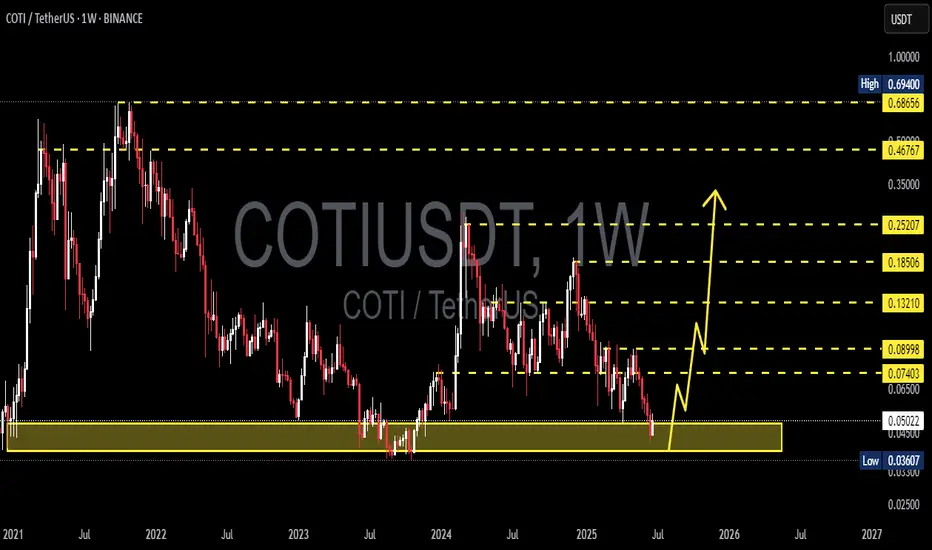
COTI/USDT Weekly Analysis – Potential Macro Reversal in PlayThe chart displays a long-term downtrend structure for COTI/USDT, yet a significant accumulation zone is forming around the $0.036–$0.045 range (highlighted in yellow). This area has acted as a key support level multiple times since 2021, suggesting strong demand and a potential bottoming pattern.
COTIUSDT 1W AnalysisCOTI ~ 1W Analysis
#COTI Buy gradually from here if you still have confidence in this coin with a short term target of at least 15%+ from here.
COTIUSDT 1D AnalysisCOTI ~ 1D Analysis
#COTI Buy back gradually from here if you still have confidence in this coin with a short term target of at least 15%+ from here.

COTI Multi-Timeframe Setup – Coiling for a Bigger Move?📊 COTI – Multi-Timeframe Breakdown
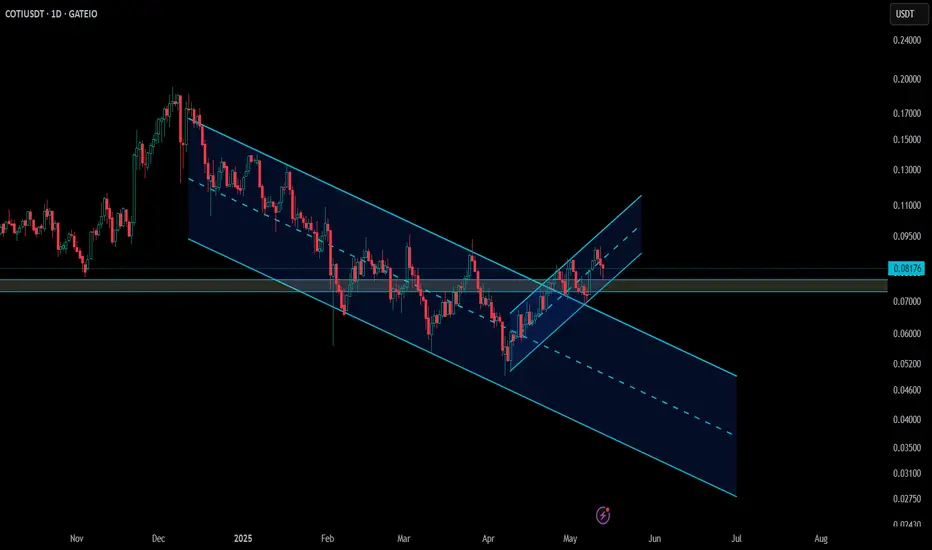
Daily Chart:
COTI has broken out of a descending channel and completed a clean retest ✅
Now climbing steadily inside an ascending channel 📈
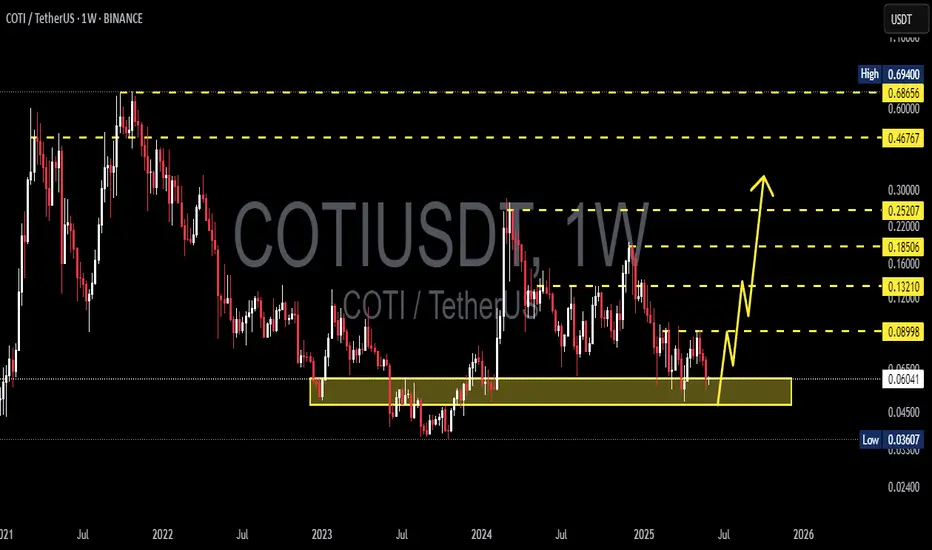
Weekly Chart:
Price is consolidating within a symmetrical triangle—momentum is building ⏳
🔑 Key Support: 0.077 — hold
COTIUSDT UPDATE
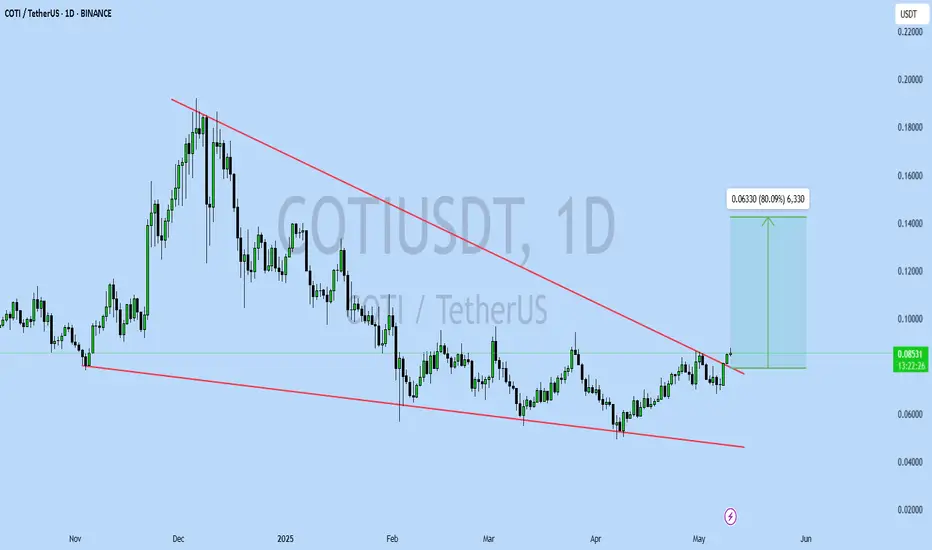
Pattern: Falling Wedge Breakout
Current Price: \$0.08562
Target Price: \$0.1489
Target % Gain: 80.09%
Technical Analysis: COTI has broken out of a long-term falling wedge pattern on the 1D chart. Breakout candle closed above resistance with strong momentum, signaling potential upside continuati
COTI bullish ideaCOTI reacting with the rest of the market seems to have completed 1 & 2 waves in a possible 5 wave elliot wave structure.
If this holds true, there's an opportunity to catch the next retrace and 3,4,5 waves. Possible entry points I would consider would be at POC or even VAL if there is a decent rea
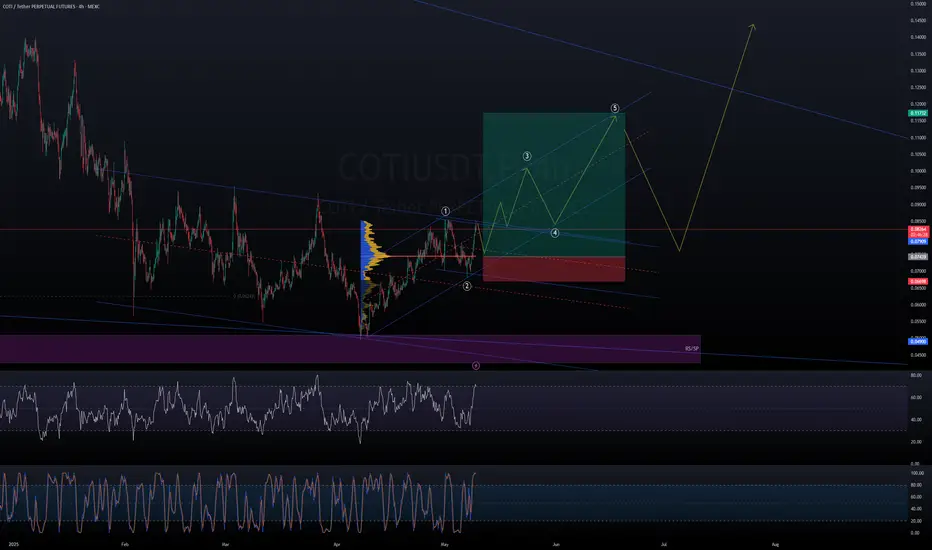
COTI WAVE 3 is coming COTI has completed its initial phases, Wave 1, 2 of Elliot waves and is preparing for Wave 3📈.
Also COTI V2, released recently, aims to revolutionize web3 privacy.
COTI’s market capitalization is $96 million, suggesting substantial potential gains during the upcoming bull market🚀.
This informati

COTIUSDT 1D AnalysisCOTI ~ 1D Analysis
#COTI Buy after successfully penetrating this resistant line with a short -term target of at least 10%+ from here.

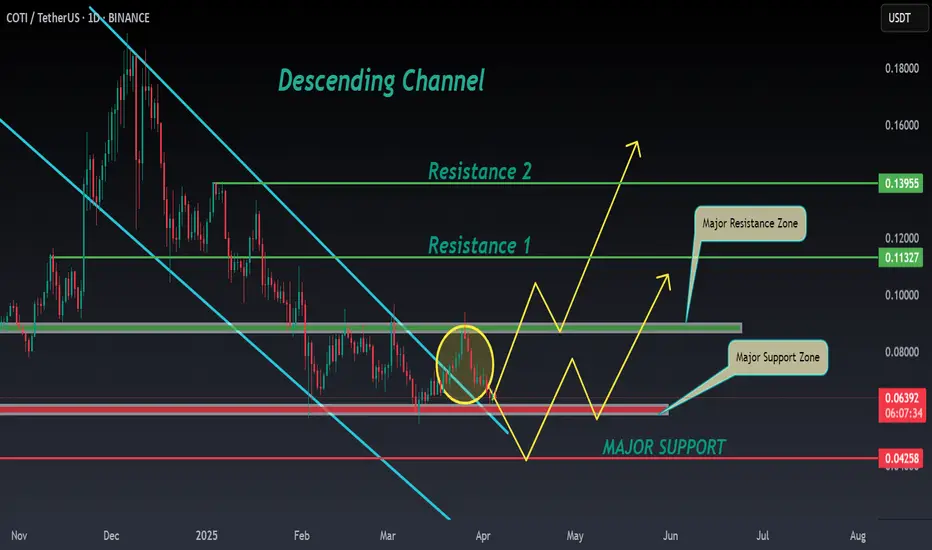
COTI ANALYSIS 📊 #COTI Analysis
✅There is a formation of Descending Channel Pattern in weekly time frame in #COTI.
Also there is a perfect breakout and retest. Now we can expect a bullish move from major support zone. If not the we will see more bearish move and then a reversal in #COTI.
👀Current Price: $0.06
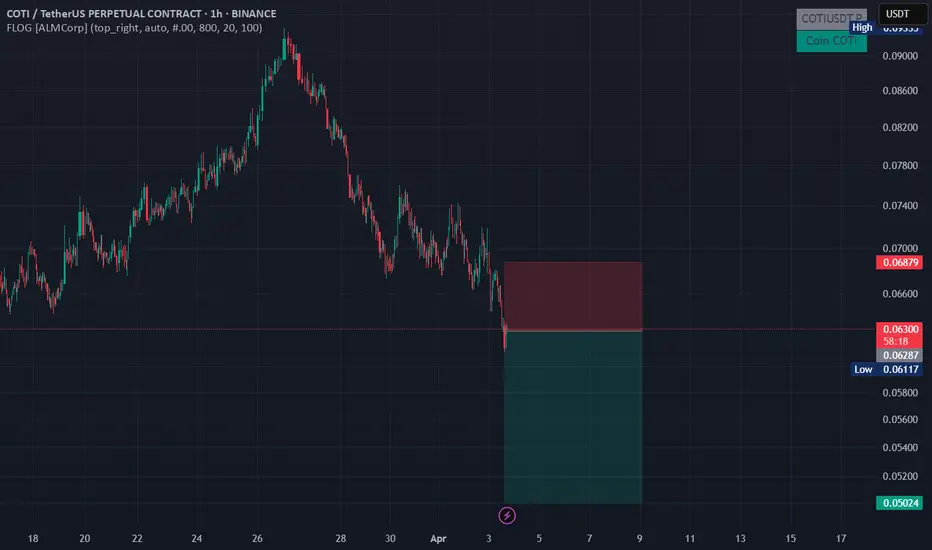
LIMIT ORDER - $COTI/USDTLIMIT ORDER - $COTI/USDT
Direction: #Short 🔴
Entry Price: 0.062870
Stop Loss: 0.068793
Target 1: 0.060344
Target 2: 0.057817
Target 3: 0.055291
Target 4: 0.052764
Target 5: 0.050238
See all ideas
Summarizing what the indicators are suggesting.
Oscillators
Neutral
SellBuy
Strong sellStrong buy
Strong sellSellNeutralBuyStrong buy
Oscillators
Neutral
SellBuy
Strong sellStrong buy
Strong sellSellNeutralBuyStrong buy
Summary
Neutral
SellBuy
Strong sellStrong buy
Strong sellSellNeutralBuyStrong buy
Summary
Neutral
SellBuy
Strong sellStrong buy
Strong sellSellNeutralBuyStrong buy
Summary
Neutral
SellBuy
Strong sellStrong buy
Strong sellSellNeutralBuyStrong buy
Moving Averages
Neutral
SellBuy
Strong sellStrong buy
Strong sellSellNeutralBuyStrong buy
Moving Averages
Neutral
SellBuy
Strong sellStrong buy
Strong sellSellNeutralBuyStrong buy
Displays a symbol's price movements over previous years to identify recurring trends.