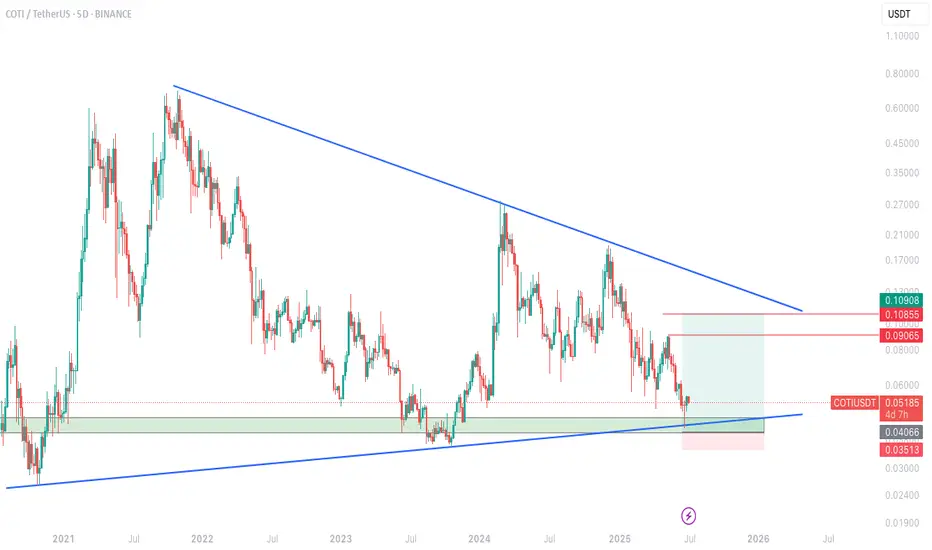
$COTI Approaching Key Long-Term Support!Price is testing a major trendline + demand zone that has held since 2021 👀
If this holds, a move toward $0.09 → $0.108 looks highly probable.
Invalidation below $0.04.
Risk-reward looks 🔥 for long-term swing traders.
COTIUSDT trade ideas
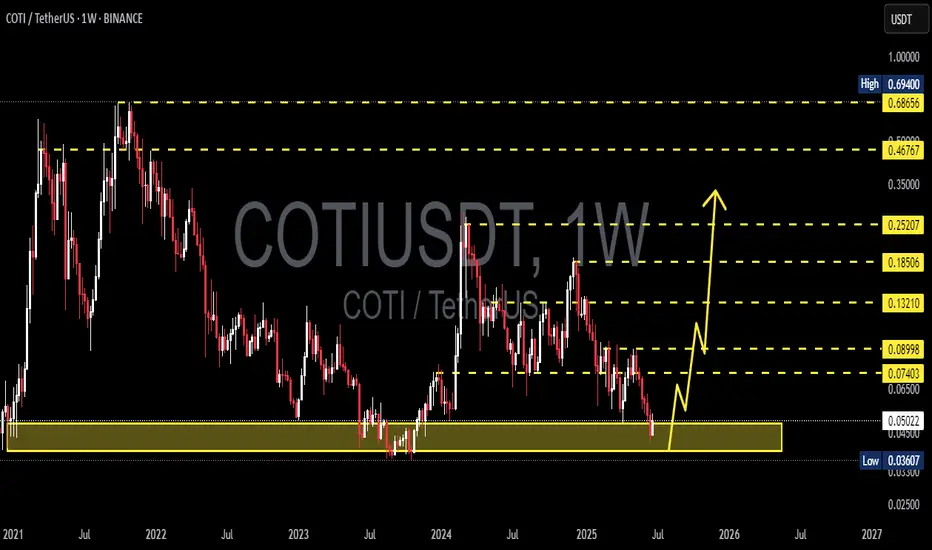
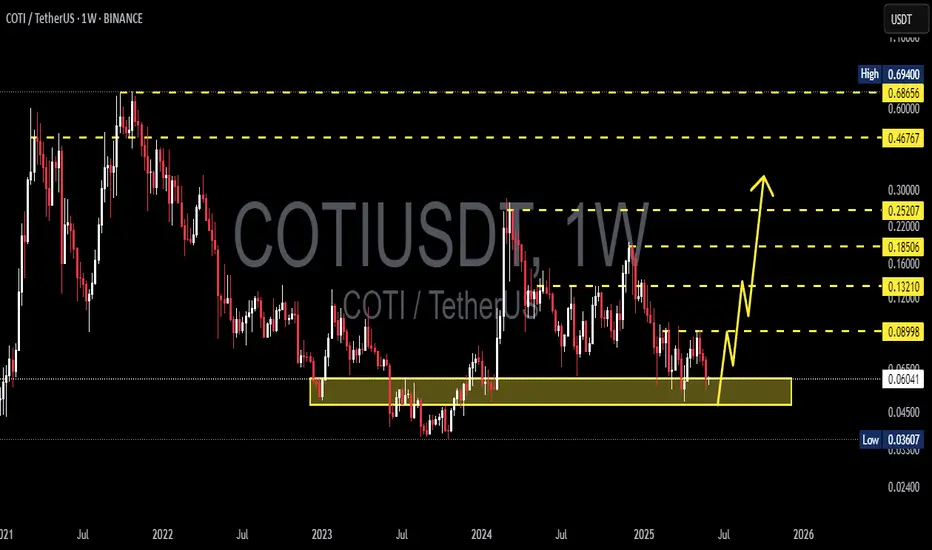
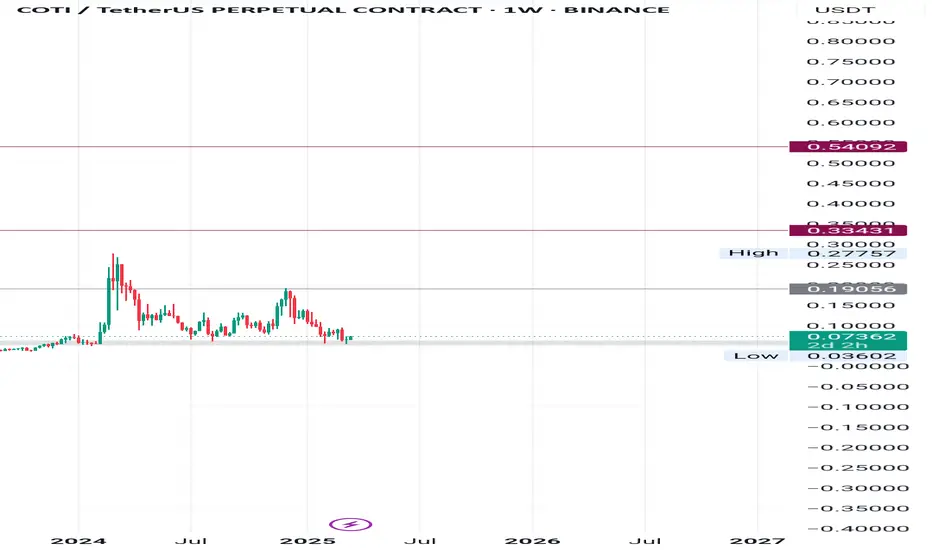
COTI/USDT Weekly Analysis – Potential Macro Reversal in PlayThe chart displays a long-term downtrend structure for COTI/USDT, yet a significant accumulation zone is forming around the $0.036–$0.045 range (highlighted in yellow). This area has acted as a key support level multiple times since 2021, suggesting strong demand and a potential bottoming pattern.
🔍 Key Observations:
Macro Support Zone:
Price is currently trading within a strong historical support zone between $0.03607 (multi-year low) and $0.04500, where buyers have consistently stepped in over the past few years.
Potential Reversal Path:
The projected yellow path indicates a bullish scenario with a potential rally from current levels toward a series of resistance levels if a reversal is confirmed.
Major Resistance Levels to Watch:
$0.05046 – Minor local resistance
$0.06500 – Psychological resistance
$0.07403 – Structural level
$0.08998 – Previous rejection zone
$0.12000 – Psychological mid-range target
$0.13210 – Prior support turned resistance
$0.16000–$0.25207 – Key macro targets
$0.46767–$0.69400 – Long-term bullish targets if momentum continues
Bullish Breakout Triggers:
A confirmed breakout above $0.065–$0.074 may trigger momentum-based entries, especially if volume supports the breakout. Sustained price action above $0.12 would further validate the bullish trend reversal.
📉 Risk Management:
This setup is still speculative until a clear reversal structure forms on the weekly timeframe. Invalidation of the setup occurs if weekly candle closes decisively below $0.036.
Conclusion: COTI is currently at a pivotal zone. While the broader trend has been bearish, the current setup offers an attractive risk/reward for mid to long-term bulls if reversal confirmation appears. Watch for bullish weekly structure and volume expansion to validate the thesis.
COTI/USDT – Approaching Make-or-Break Zone | Multi-Leg Reversal📌 Overview:
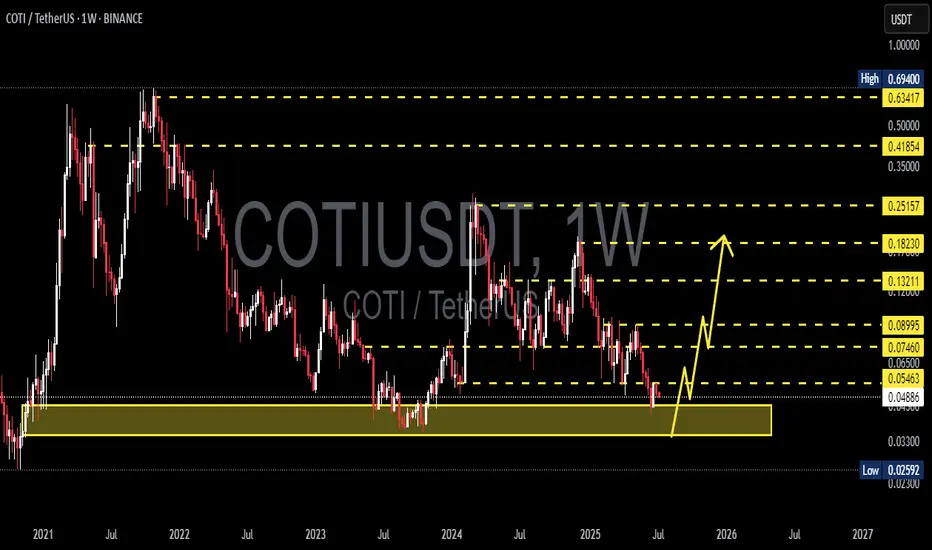
COTI is currently at a critical inflection point in its long-term structure. After a prolonged distribution phase since 2021 and a steady decline throughout 2023–2025, price action is now testing a historical support zone that has repeatedly triggered strong reversals. This area could be the foundation of a macro bottom formation—or the gateway to further downside if broken.
🔍 Technical Breakdown & Key Price Zones:
🟨 Major Demand Zone (Support Block):
Range: $0.030 – $0.048
This is a historically significant support area, previously acting as a launchpad for bullish impulses.
There is a strong chance of forming a double bottom or even an Inverse Head & Shoulders pattern here on the weekly timeframe, which would hint at a trend reversal if confirmed.
📏 Layered Resistance Levels (Profit-Taking Zones):
1. $0.05600 – Minor resistance, first validation of bullish strength
2. $0.07460 – Previous structural resistance from early 2024
3. $0.08995 – Key breakout level that may trigger mid-term momentum
4. $0.13211 – $0.18230 – Medium-term targets on sustained breakout
5. $0.25157 – $0.41854 – Long-term targets if macro bullish trend forms
🟢 Bullish Scenario (Reversal Setup):
✅ If price holds the $0.030–$0.048 demand zone:
Expect gradual bullish momentum toward $0.05600, followed by confirmation above $0.08995.
Weekly breakout candle with strong volume would confirm reversal structure.
Mid-term price target could reach $0.132 – $0.182, or even higher during an altseason rotation.
🔴 Bearish Scenario (Breakdown Setup):
❌ If the support zone fails:
Price could break below $0.030, exposing $0.0259 or even $0.020 as next downside targets.
This would negate the potential reversal structure and resume the bearish continuation trend.
Traders should wait for a new base or re-accumulation signal before re-entering long positions.
📊 Pattern Focus:
Double Bottom / Inverse Head & Shoulders (Potential Formation)
Descending Channel breakout watch
Volume Drying Up = Possible prelude to trend reversal if volume spikes follow
💡 Trading Strategy:
Aggressive Long Entry: Buy within the yellow support zone, stop-loss below $0.030
Conservative Entry: Wait for breakout and successful retest above $0.056
Bearish Setup: If breakdown occurs, short-term shorts or sidelining recommended
📈 Momentum Outlook:
Weekly structure suggests seller exhaustion is setting in.
Swing reversal is likely if price holds above the support range for the coming weeks.
Gradual accumulation strategy is suitable for swing traders.
🧲 Key Takeaway:
> COTI is entering a golden zone for potential mid-term reversal. If the support holds and a reversal pattern forms, a 200%+ upside is realistic. However, failure to hold this zone could lead to a breakdown and deeper correction. Patience and confirmation are key.
#COTI #COTIUSDT #CryptoAnalysis #AltcoinSeason #DoubleBottom #SupportZone #TrendReversal #TechnicalAnalysis #WeeklyChart #BreakoutWatch
COTIUSDT 1W AnalysisCOTI ~ 1W Analysis
#COTI Buy gradually from here if you still have confidence in this coin with a short term target of at least 15%+ from here.
COTIUSDT 1D AnalysisCOTI ~ 1D Analysis
#COTI Buy back gradually from here if you still have confidence in this coin with a short term target of at least 15%+ from here.

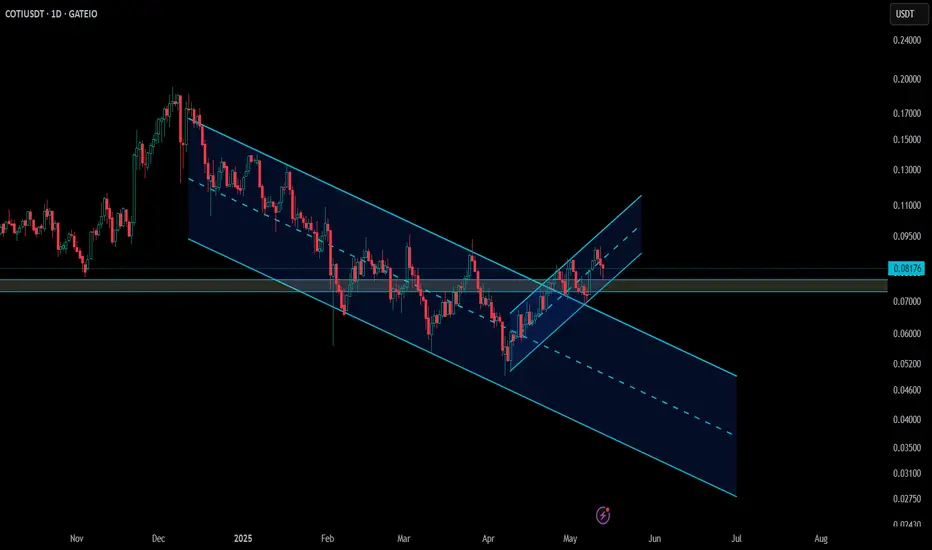
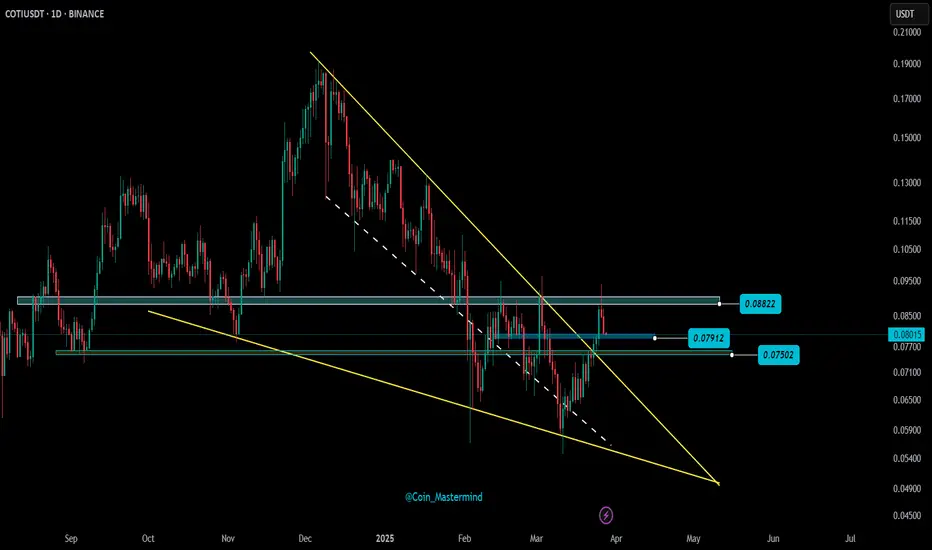
COTI Multi-Timeframe Setup – Coiling for a Bigger Move?📊 COTI – Multi-Timeframe Breakdown
Daily Chart:
COTI has broken out of a descending channel and completed a clean retest ✅
Now climbing steadily inside an ascending channel 📈
Weekly Chart:
Price is consolidating within a symmetrical triangle—momentum is building ⏳
🔑 Key Support: 0.077 — holding this level is critical for continuation.
👀 Structure is tightening—get ready for a potential breakout move!
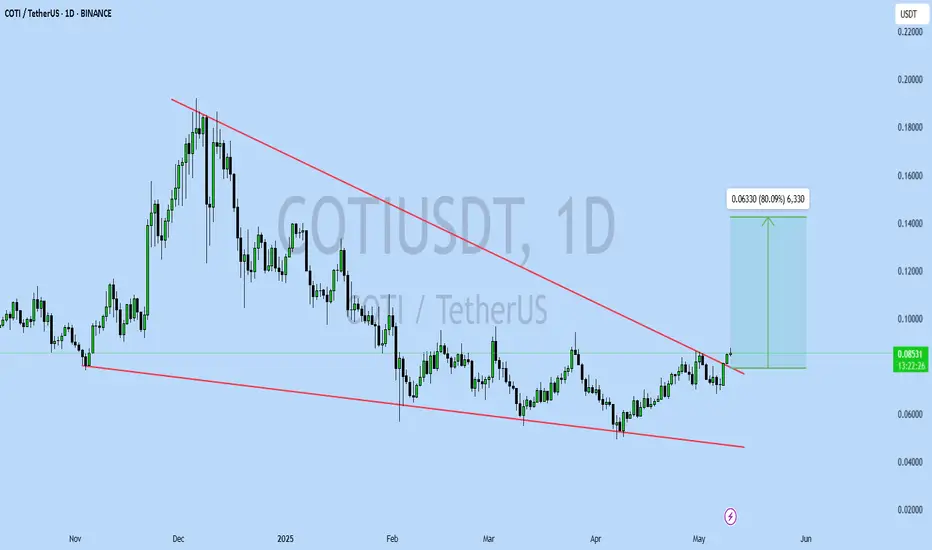
COTIUSDT UPDATE
Pattern: Falling Wedge Breakout
Current Price: \$0.08562
Target Price: \$0.1489
Target % Gain: 80.09%
Technical Analysis: COTI has broken out of a long-term falling wedge pattern on the 1D chart. Breakout candle closed above resistance with strong momentum, signaling potential upside continuation.
Time Frame: 1D
Risk Management Tip: Always use proper risk management.
COTI bullish ideaCOTI reacting with the rest of the market seems to have completed 1 & 2 waves in a possible 5 wave elliot wave structure.
If this holds true, there's an opportunity to catch the next retrace and 3,4,5 waves. Possible entry points I would consider would be at POC or even VAL if there is a decent reaction from price, with invalidation below the previous low.
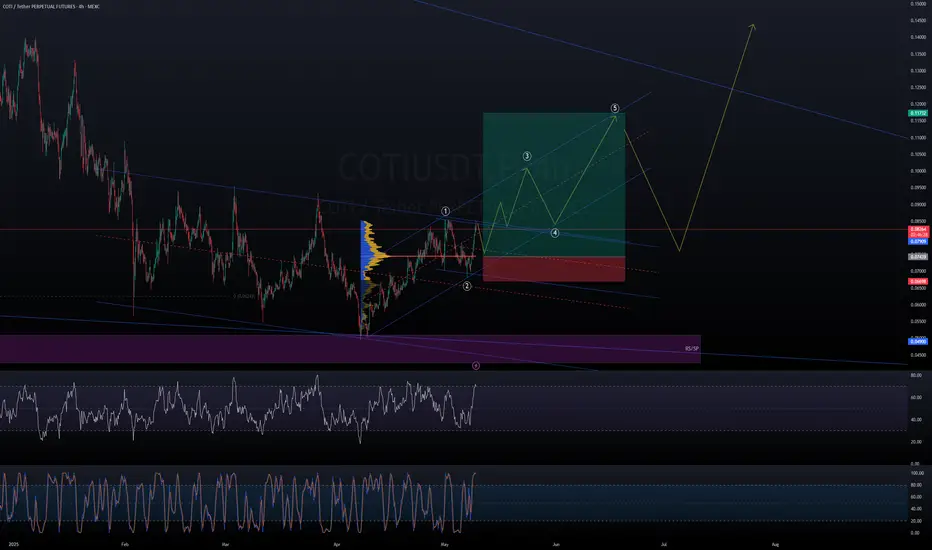
COTI WAVE 3 is coming COTI has completed its initial phases, Wave 1, 2 of Elliot waves and is preparing for Wave 3📈.
Also COTI V2, released recently, aims to revolutionize web3 privacy.
COTI’s market capitalization is $96 million, suggesting substantial potential gains during the upcoming bull market🚀.
This information is not financial advice. Conduct thorough research before making investment decisions.

COTIUSDT 1D AnalysisCOTI ~ 1D Analysis
#COTI Buy after successfully penetrating this resistant line with a short -term target of at least 10%+ from here.

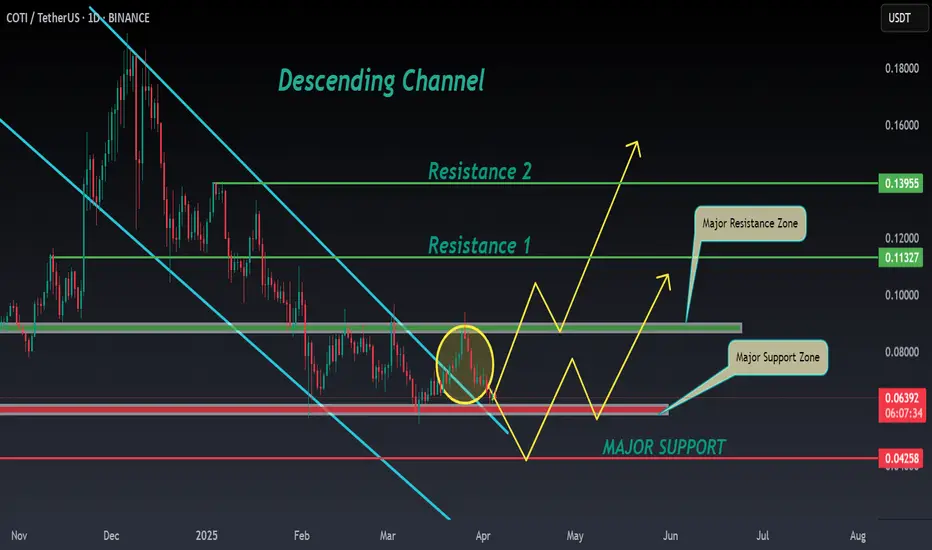
COTI ANALYSIS 📊 #COTI Analysis
✅There is a formation of Descending Channel Pattern in weekly time frame in #COTI.
Also there is a perfect breakout and retest. Now we can expect a bullish move from major support zone. If not the we will see more bearish move and then a reversal in #COTI.
👀Current Price: $0.06390
🎯 Target Price : $0.08660
⚡️What to do ?
👀Keep an eye on #COTI price action and volume. We can trade according to the chart and make some profits⚡️⚡️
#COTI #Cryptocurrency #Breakout #TechnicalAnalysis #DYOR
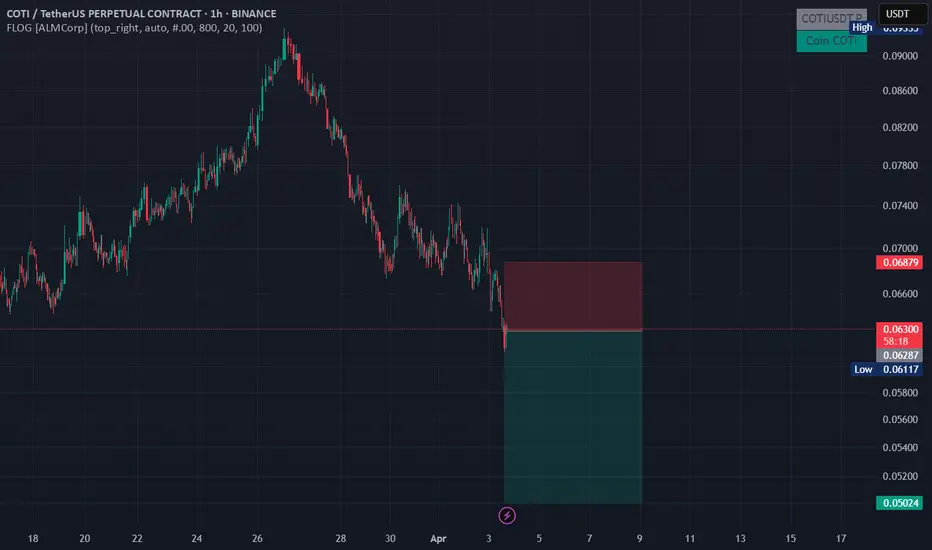
LIMIT ORDER - $COTI/USDTLIMIT ORDER - $COTI/USDT
Direction: #Short 🔴
Entry Price: 0.062870
Stop Loss: 0.068793
Target 1: 0.060344
Target 2: 0.057817
Target 3: 0.055291
Target 4: 0.052764
Target 5: 0.050238
COTI Breakout Confirmed – Can Bulls Maintain Momentum?
OTC:COTI has successfully broken out from the falling wedge and completed a clean retest, reinforcing the bullish structure. Despite a minor retracement, the overall trend remains strong.
✅ Breakout and retest confirmed, signaling strength
📉 Small pullback observed, but buyers are still in control
📈 If momentum builds, price could push higher and outperform
Watch closely for the next move as momentum unfolds 👀
#COTI/USDT#COTI
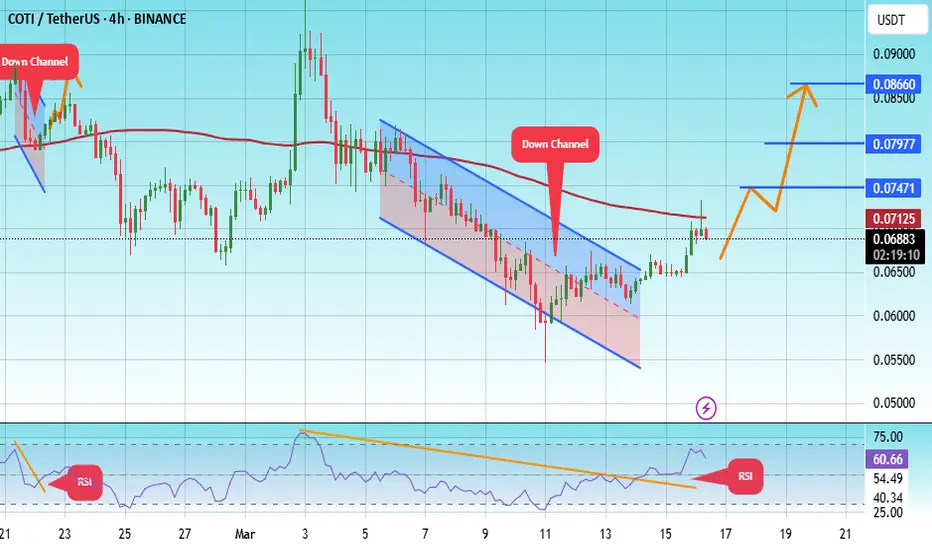
The price is moving within a descending channel on the 1-hour frame, adhering well to it, and is on its way to breaking it strongly upwards and retesting it.
We are seeing a rebound from the lower boundary of the descending channel, which is support at 0.06870.
We have a downtrend on the RSI indicator that is about to break and retest, supporting the upward trend.
We are looking for stability above the 100 Moving Average.
Entry price: 0.06870
First target: 0.07471
Second target: 0.09799
Third target: 0.08660
COTI is in the trenches looking for a reversalCOTI is fighting for a bottom and it has a bullish upgrade on its side. Accumulation above invalidation provides a great RR opportunity. Momentum and trend oscillators are suggesting a bullish pivot is in the works.
Full TA: Link in the BIO

Eyes on this Cotiusdt can Pull a Massive MoveThis can pull a massive move.
Risking on this by buying DCA Spot.
This if holds and move can pull a massive move.
Targeting 0.2 and 0.3
Note: Not a Financial Advise.
COTI/USDT 1W🩸 OTC:COTI ⁀➷
#COTIFoundation. Macro chart Another
💯 Intermediate Target - $0.24
🚩 Macro Target 1 - $0.33
🚩 Macro Target 2 - $0.50
🚩 Macro Target 3 - $0.73
- Not financial advice, trade with caution.
#Crypto #COTIFoundation #COTI #Investment
✅ Stay updated on market news and developments that may influence the price of COTIFoundation. Positive or negative news can significantly impact the cryptocurrency's value.
✅ Exercise patience and discipline when executing your trading plan. Avoid making impulsive decisions driven by emotions, and adhere to your strategy even during periods of market volatility.
✅ Remember that trading always involves risk, and there are no guarantees of profit. Conduct thorough research, analyze market conditions, and be prepared for various scenarios. Trade only with funds you can afford to lose and avoid excessive risk-taking.

COTIUSDT CHART ANALYSİS - EDUCATIONAL POSTHow NFT Technology Developed
NFT technology was created in 2017 based on Ethereum smart contracts. Since then, we have witnessed many successful NFT projects and deals. Stories like these perfectly describe the current and future possibilities of the technology.
The development of blockchain technology and the emergence of NFT services coincided with other processes in society and the economy. Many new players appeared in the stock markets, including non-professional traders and amateur investors.
The democratization of financial markets coincided with the pandemic: being in self-isolation, alone with their devices, many people began to pay attention to new financial instruments.
The information that arose around them also played a specific role in the “revival” of NFTs. The big names in the news headlines supporting NFTs couldn’t help but draw attention to them. That is one of the reasons why the success of the technology was inevitable.

COTIUSDT UPDATECOTIUSDT is a cryptocurrency trading at $0.08793. Its target price is $0.15000, indicating a potential 80%+ gain. The pattern is a Bullish Falling Wedge, a reversal pattern signaling a trend change. This pattern suggests the downward trend may be ending. A breakout from the wedge could lead to a strong upward move. The Bullish Falling Wedge is a positive signal, indicating a potential price surge. Investors are optimistic about COTIUSDT's future performance. The current price may be a buying opportunity. Reaching the target price would result in significant returns. COTIUSDT is poised for a potential breakout and substantial gains.

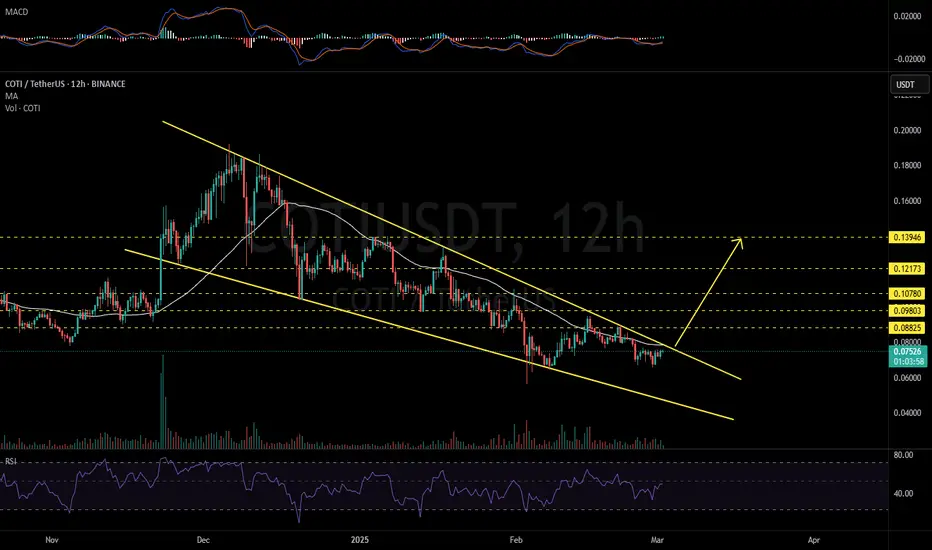
COTIUSDT 12H#COTI has formed a falling wedge pattern on the 12H chart. In case of a breakout above the pattern and the 12H MA50, the targets are:
🎯 $0.08825
🎯 $0.09803
🎯 $0.10780
🎯 $0.12173
🎯 $0.13946
COTI looking for support while still in a downtrend. COTI Is looking for support however volatility is now coming down while mementums is trying to get out of oversold conditions. A pivot point structure would provide evidence of a reversal. There is a small volume gap that could bring the price lower. DCA

#COTI/USDT#COTI
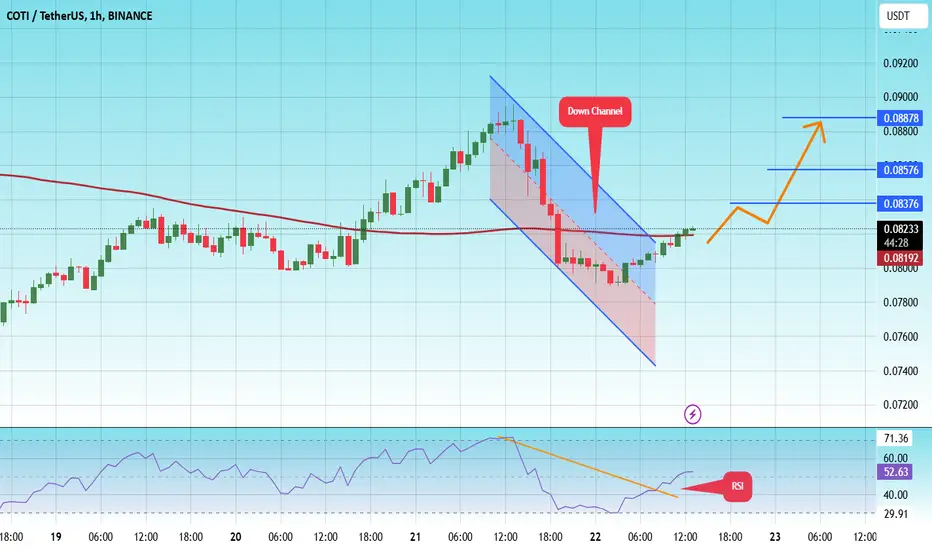
The price is moving in a descending channel on the 1-hour frame and is expected to continue upwards
We have a trend to stabilize above the moving average 100 again
We have a descending trend on the RSI indicator that supports the rise by breaking it upwards
We have a support area at the lower limit of the channel at a price of 0.07800
Entry price 0.08236
First target 0.08376
Second target 0.08576
Third target 0.08878
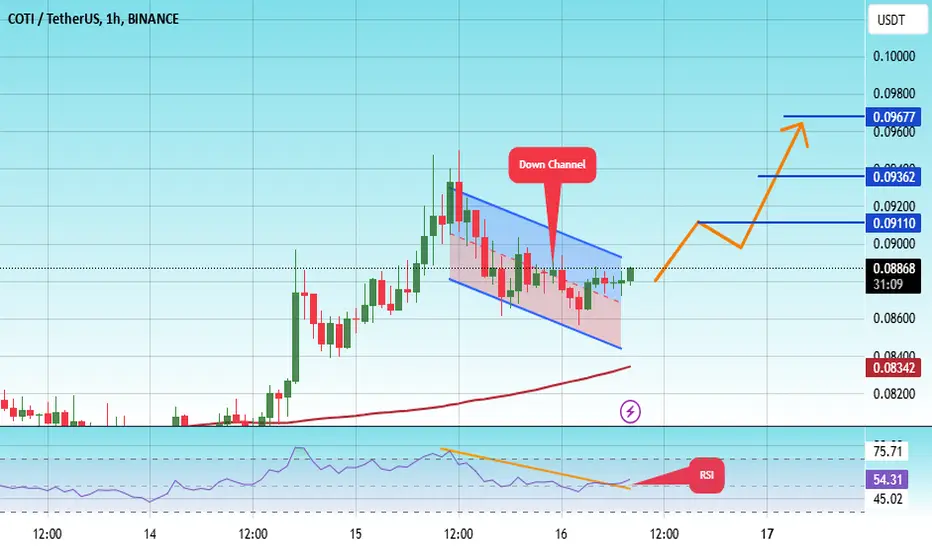
#COTI/USDT#COTI
The price is moving in a descending channel on the 1-hour frame and is adhering to it well and is heading to break it strongly upwards and retest it
We have a bounce from the lower limit of the descending channel, this support is at a price of 0.08530
We have a downtrend on the RSI indicator that is about to break and retest, which supports the rise
We have a trend to stabilize above the moving average 100
Entry price 0.08863
First target 0.09110
Second target 0.09362
Third target 0.09677