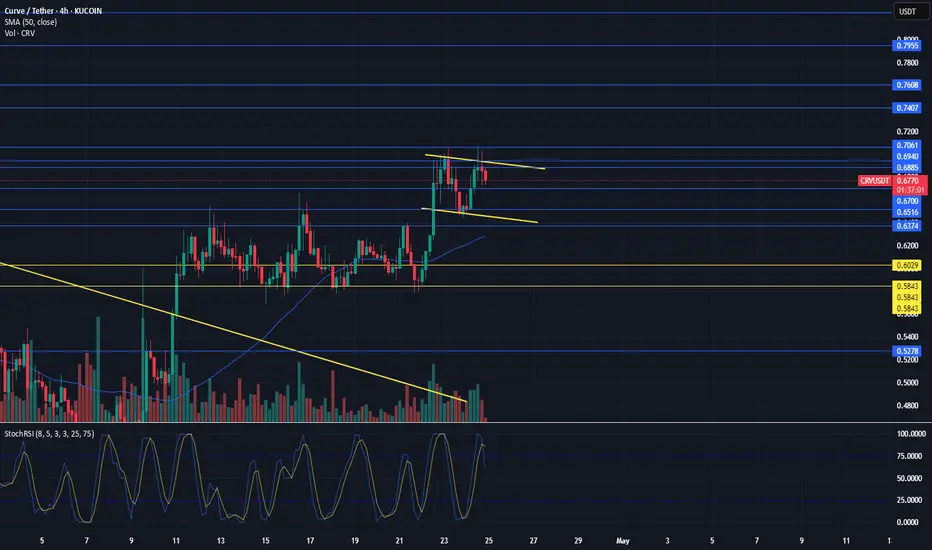
CRV – Breaking Down from Falling Wedge (4H)🔻 LSE:CRV is slipping below the falling wedge pattern on the 4H timeframe.
🛑 Key support zones to watch are $0.68 and $0.65.
⚠️ Though falling wedges often hint at bullish reversals, external pressures like CRYPTOCAP:BTC dominance are causing altcoins to bleed currently.
👀 Stay alert for a potential bounce or a deeper correction ahead.
CRVUSDT.3L trade ideas
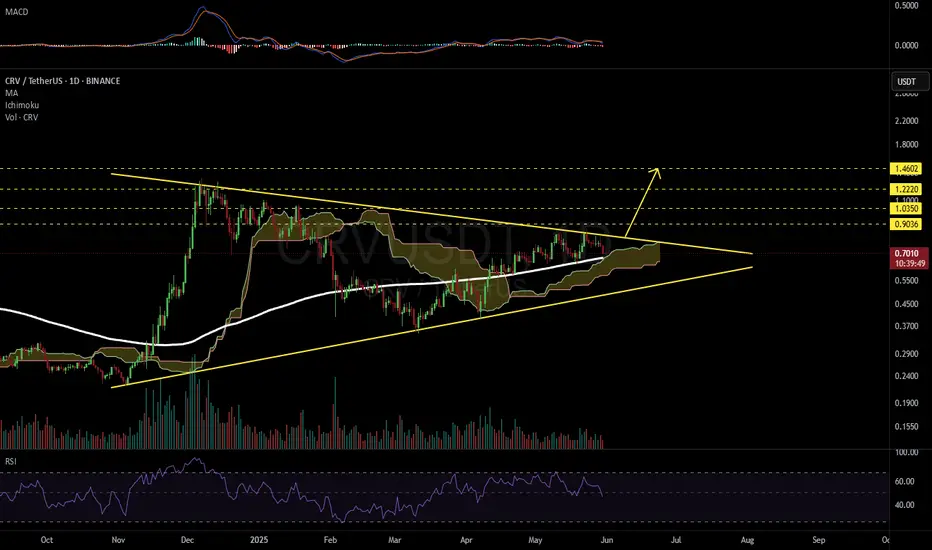
CRVUSDT 1D#CRV is currently consolidating inside a symmetrical triangle on the daily chart. 📊
A bounce from the daily MA200 and the Ichimoku cloud looks likely — both acting as strong support zones.
A confirmed breakout above the triangle could trigger a 2x bullish rally. 🚀
Post-breakout targets:
🎯 $0.9036
🎯 $1.0350
🎯 $1.2220
🎯 $1.4602
⚠️ Always use a tight stop-loss to manage risk effectively.
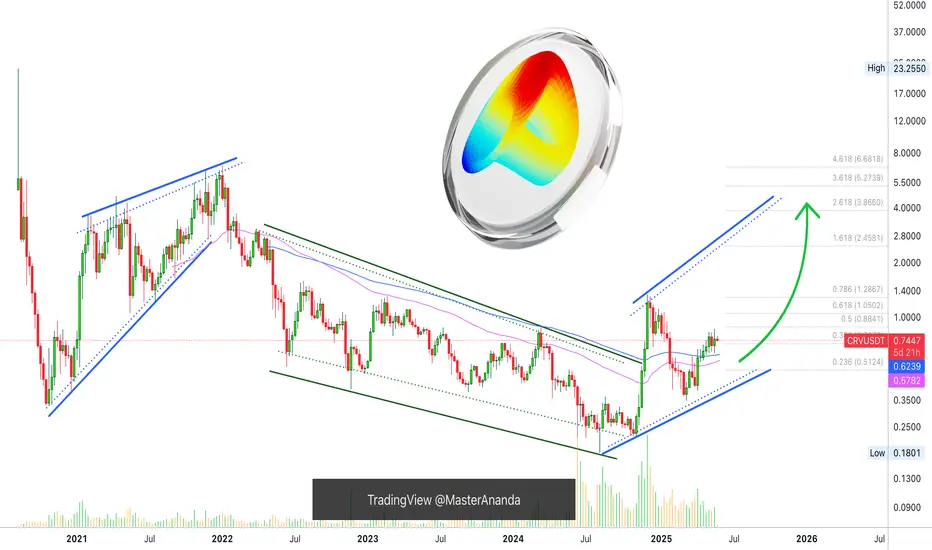
CRV is Getting Ready For a Skyrocket Move (1D)CRV has formed a Cup & Handle pattern — a well-known structure that typically signals a bullish reversal.
From a broader technical perspective, there's additional confluence suggesting a potential trend shift.
If the most recent dip holds, it may confirm that CRV has completed its bearish cycle and has now entered a new five-wave bullish structure. Based on the current price action, it's likely that wave 3 is unfolding at the moment.
Interestingly, the depth of the Cup & Handle formation aligns well with typical wave 5 targets, offering additional validation for this setup.
In this scenario, the wave 3 target sits around $0.78, which also coincides with a previously untapped order block — adding further credibility to the level.
For a longer-term outlook, wave 5 could extend above the $1.00 mark, depending on market conditions and overall momentum.
Moreover, the Ichimoku Cloud is currently reflecting a bullish bias, with price action moving above the cloud and supportive Tenkan-Kijun alignment — reinforcing the overall bullish outlook.
Achieving this target may take time — but as we all know, in crypto, time often behaves differently.
— Thanks for reading.

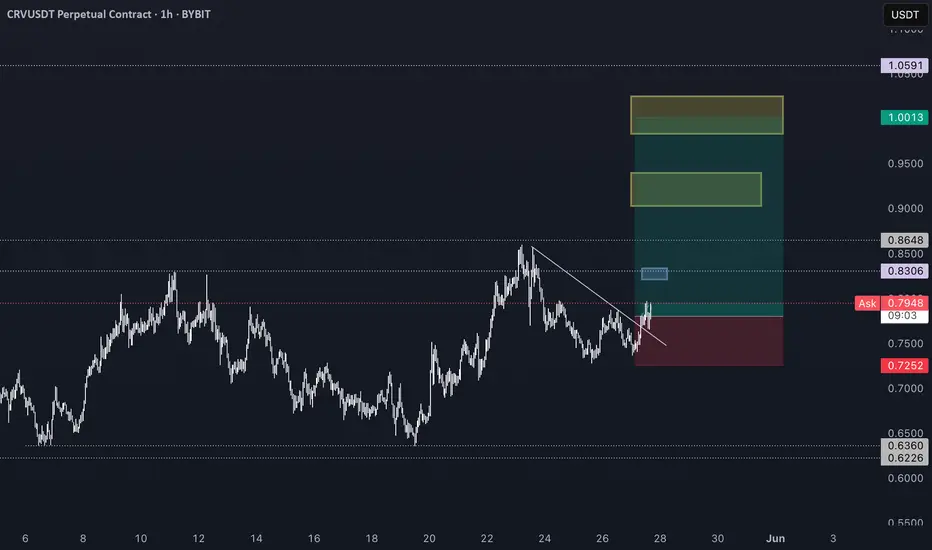
CRV long "@members
Leverage: 10x
Capital risk: <2.5%
Entry: market
Sl: 0.7252
@members
I like how CRV look, imo one of the best looking charts like VIRTUAL HYPE KAITO. Did a few small trades on it before and it pumped nicely.
Looking for yellow box macro resistance and would go short there.
Some lvls to reclaim take out before that and all depends on tweets and BTC."
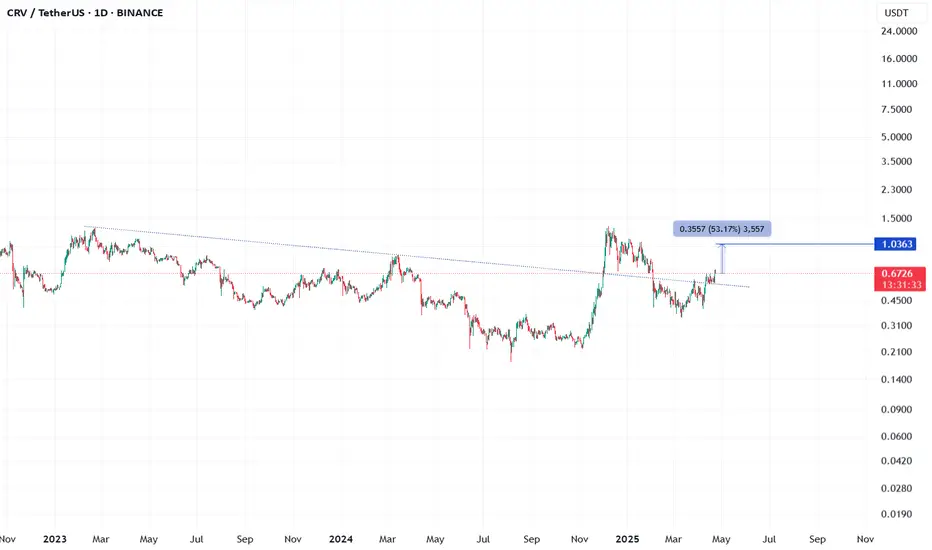
Curve Enters Bullish Trend (TAC-S7)Curve started dropping in Jan. 2022. The chart doesn't look great at a first glance but there is some positive news.
The downtrend that started in Jan. 2022 ended in August 2024. This date marked the all-time low. After August, there was a higher low in November (2024) and then again a strong higher low in March 2025. That's the good news. The good news is that the market switched from lower lows to higher lows. So, what was then a downtrend can now turn into an uptrend, the next advance and higher high will make it so.
Long-term weekly time frame CRVUSDT is trading above EMA55 and EMA89. Boom. These levels were first conquered in late 2024 then the drop and recovery above this year signals that the bulls are now in control.
So everything is clear in a way, all that is missing is the next bullish wave. This is what we are expecting and this is what is certain to happen next.
As soon as Curve-Tether moves up, producing a high higher than December 2024, this will confirm the change of trend. The first time an uptrend shows on the chart since 2021.
Namaste.
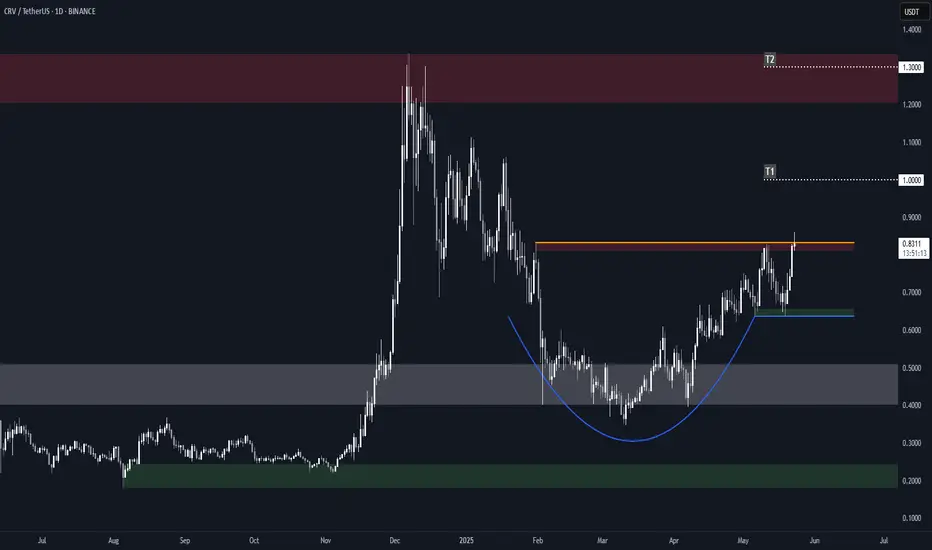
Curve (CRV) Structure Analysis (1D)BINANCE:CRVUSDT formed a rounded bottom (cup) and a minor rectangle, and it's currently attempting to break above the local $0.83 resistance.
Key Levels to Watch
• $0.64: Current support and minor rectangle lower boundary
• $0.83: Current resistance, cup and rectangle upper boundary
• $1.00: Measured target from the minor rectangle pattern
• $1.30: Measured target from the cup pattern (within a key supply zone)
Other Important Levels
• $0.20: Key demand zone, and 2024 low
• $0.40-$0.50: Key S/R dating back to November 2022, aligned with the cup bottom
• $1.20-$1.30: Main supply zone, dating back to February 2023
A daily close above $0.83 with volume would confirm the breakout and trigger the targets.
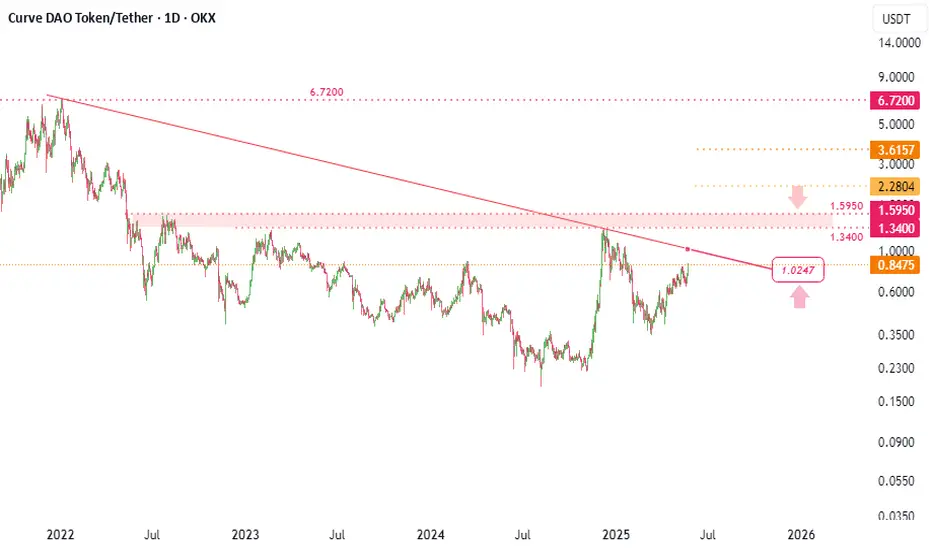
#CRVUSDT ( 2 arrows )A red resistance line (first red arrow) and
a red resistance band (second red arrow)
Breaking out of these two red arrows can throw it
CRV USDT Positive cup and handle
After a four-month bearish trend
Upward and positive after a two-day close above 0.83, entry and target 130%
Stop when the daily close is below 0.62

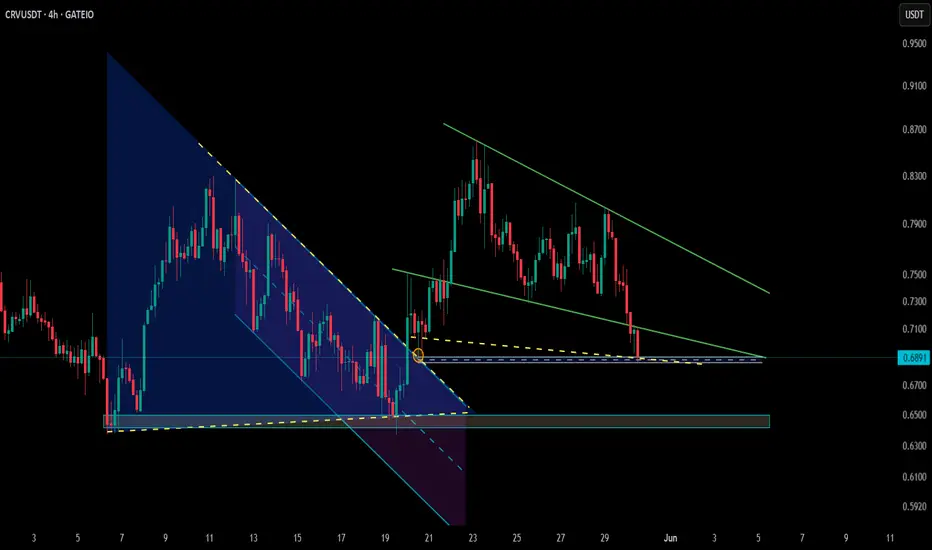
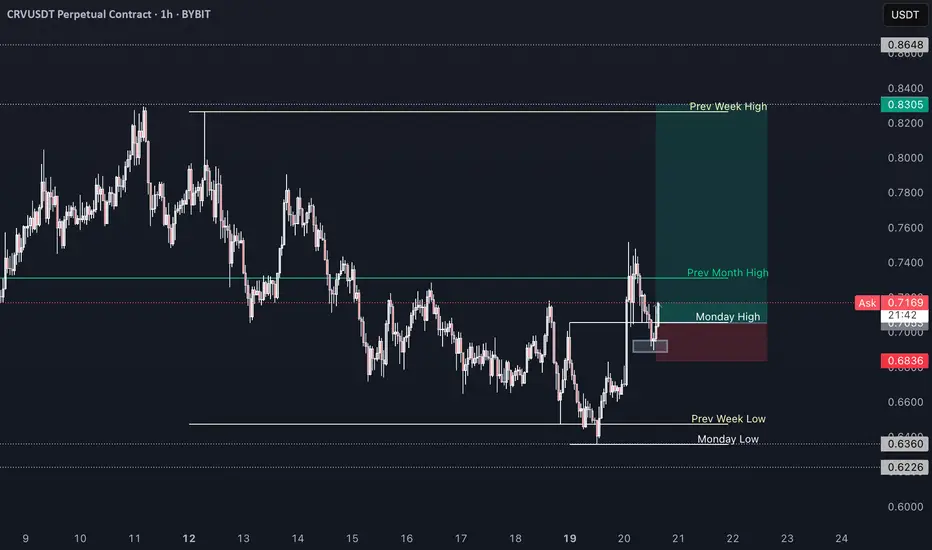
CRV longWent below MO high to ML and bounce strong, MO high reclaimed now looking for sweep of highs

CURVE DAO BREAKOUT - Short EntryLSE:CRV as seen on the 1hr timeframe chart broke downward from the box and has retested the zone. The drop should continue. Trade with caution.
Please support this idea with a LIKE👍 if you find it useful🥳
Happy Trading💰🥳🤗
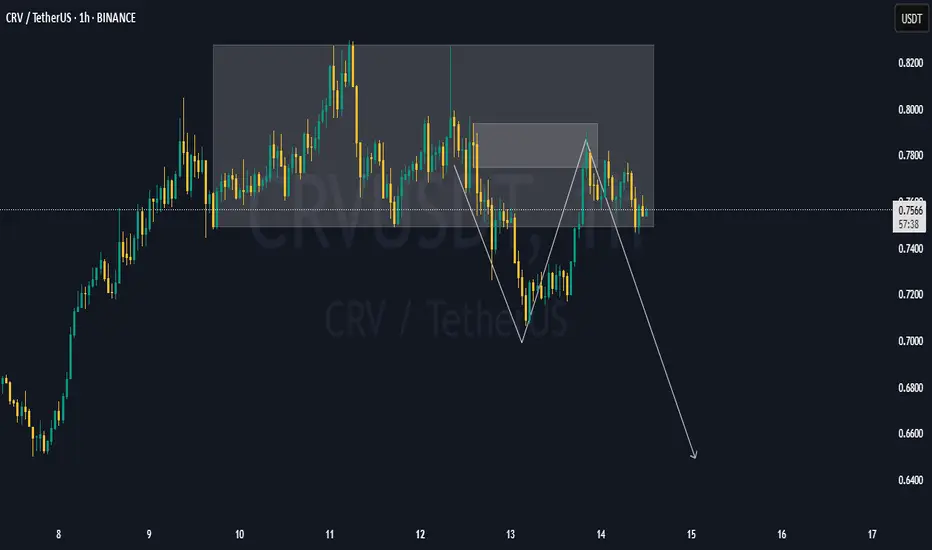
CRV Head and Shoulders Pattern Formed – Breakout Confirmed🚨 CRV Head and Shoulders Pattern Formed – Breakout Confirmed 📉
CRV has formed a head and shoulders pattern and has already broken out of the neckline. This could signal the start of a potential downtrend, with further downside ahead. 📊
Let’s monitor this downtrend together! 💼💸

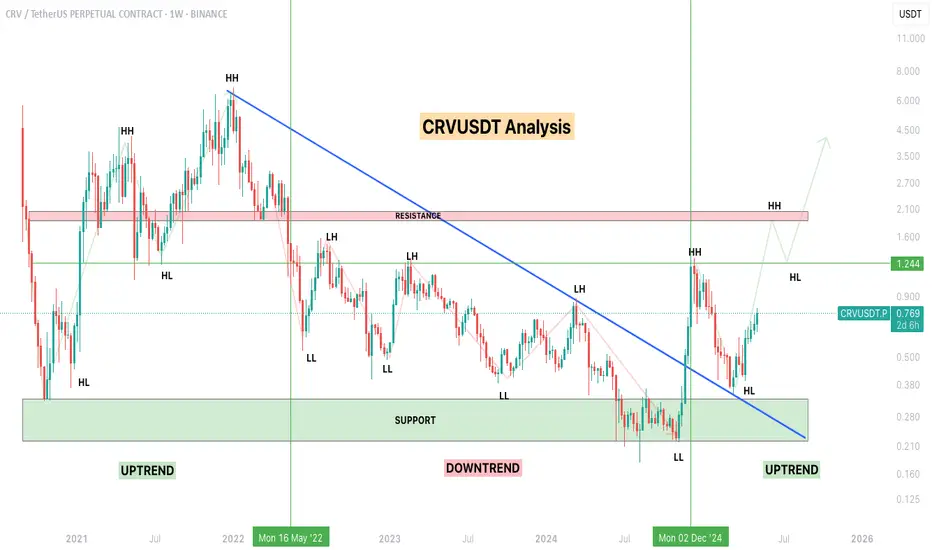
CRVUSDT Weekly Analysis – Major Trend Shift Unfolding!!Curve DAO Token (CRV):
Market Structure Overview
Uptrend Phase (2021 – mid-2022):
CRV was in a healthy bullish structure, printing consecutive Higher Highs (HH) and Higher Lows (HL). Momentum was strong and sentiment bullish.
Downtrend Phase (mid-2022 – end of 2024):
Price flipped structure and entered a long correction. We saw a series of Lower Highs (LH) and Lower Lows (LL) confirming the downtrend, following a firm rejection from the resistance zone (~$2.1).
Potential Reversal & New Uptrend (Post Dec 2024):
December 2024 marked a major structural shift. We printed a new Higher High and followed it with a Higher Low — a textbook uptrend confirmation.
Support Zone: $0.22 - $0.33
This area acted as a strong historical base — price respected this zone during accumulation and reversal attempts multiple times over the last 2 years.
Recent price action shows a bounce with volume, confirming demand interest.
Resistance Zone: $1.90 - $2.10
A heavy supply zone where price got rejected in past rallies.
A breakout and weekly close above this zone could signal the start of a strong continuation rally toward higher targets ($3.5+ range).
Break of Downtrend Line
The long-term diagonal resistance trendline has been broken decisively.
Price is consolidating above the trendline with structure favoring bulls — a strong signal of trend reversal.
Bullish Roadmap (if trend sustains)
The current rally could head toward $1.24 (mid-level key resistance).
If price holds and creates a Higher Low (HL), next upside extension could target the $2+ resistance zone.
Sustained break and hold above $2.10 will open room for a macro shift back toward bullish price discovery phases.
The macro chart of CRV is showing a clear transition from a multi-year downtrend into a potential uptrend. Confirmation through structure (HH & HL), breakout of long-term resistance, and a strong support base sets a solid technical foundation.
Keep CRV on your radar.
Patience is key. Let price confirm through weekly closes.
If you find this analysis helpful, please hit the like button to support my content! Share your thoughts in the comments, and feel free to request any specific chart analysis you’d like to see.
Happy Trading!!
CRV SWING LONG TRADE IDEACRVUSDT has done bullish BOS after Turning its trend into bullish (CHoCH). Box is a trap where we can see smaller pump but real swing entry zone is in FVG area, keep eye on that.

CRV 1H Chart SetupThis chart features CRV on a 1-hour timeframe with a 50-period SMA, RSI(14), and trend lines. Created for technical analysis and personal reference. Shared for transferring to another account.

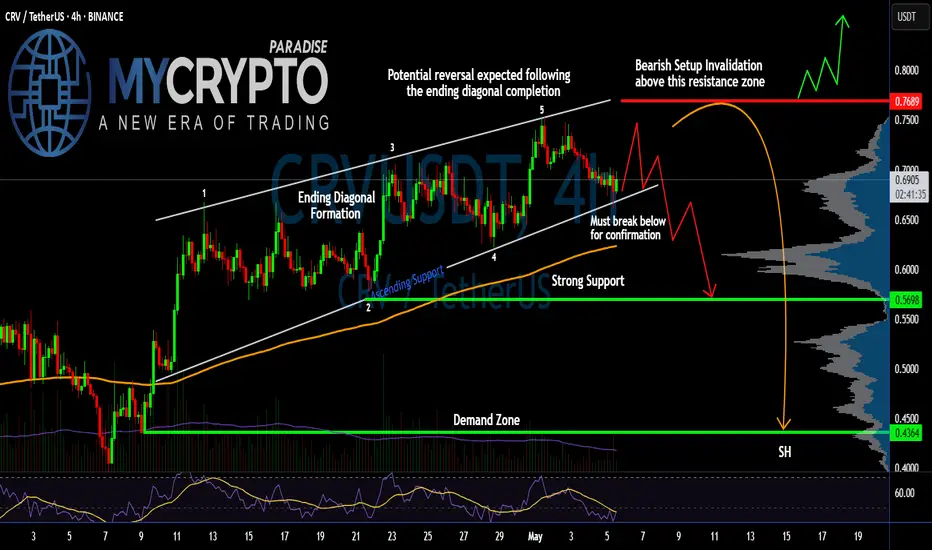
Is #CRV Ready for a Reversal or Not? Key Levels to Watch Yello Paradisers! Are we about to witness another brutal trap as #CRV finishes its final leg up and prepares to flush all late longs? Let’s break down the setup for #CurveDAOToken:
💎#CRVUSDT is currently trading around $0.6948, and what we’re seeing here is a classic Ending Diagonal Formation, a pattern well-known for luring in unsuspecting bulls before reversing violently. The structure has completed its five-wave sequence, and the price is now teetering just above key support.
💎The resistance zone near $0.7689 is where the whole game flips. This level has been clearly rejected before, and it now marks the invalidation point for any bearish outlook. A sustained move above this region with solid momentum would invalidate the diagonal and potentially send the price toward the $0.80+ mark. However, without that breakout, the bearish reversal remains the dominant scenario.
💎#CRVUSD is holding above rising trendline support, but this support is critical. A break below it confirms the end of the diagonal and should trigger a strong sell-off. The first target on a breakdown is the $0.5698 area, a zone previously respected and backed by significant volume profile interest.
💎If sellers gain traction and that level breaks down too, we’re watching for a move toward the demand zone at $0.4364, which aligns with the lower volume shelf—this is where the real pain could begin for over-leveraged traders caught on the wrong side.
Play it safe, respect the structure, and let the market come to you!
MyCryptoParadise
iFeel the success🌴
CRV Breakout Retest – Eyes on the Next Leg UpLSE:CRV has been trading within a well-defined ascending channel, showing a consistent bullish structure. Recently, the price broke above a key horizontal resistance level and is now retesting it—this is a classic breakout-retest scenario.
As long as CRV holds this support and remains within the channel, the bias stays bullish. A successful bounce from this zone could lead to a strong continuation toward the upper boundary of the channel or higher.
DYOR, NFA

Curve (CRV)Crv usdt Daily analysis
Time frame 4hours
Risk rewards ratio >2.5 👈👌
Target = 0.8$
Moving up and down in the uptrend tunnel
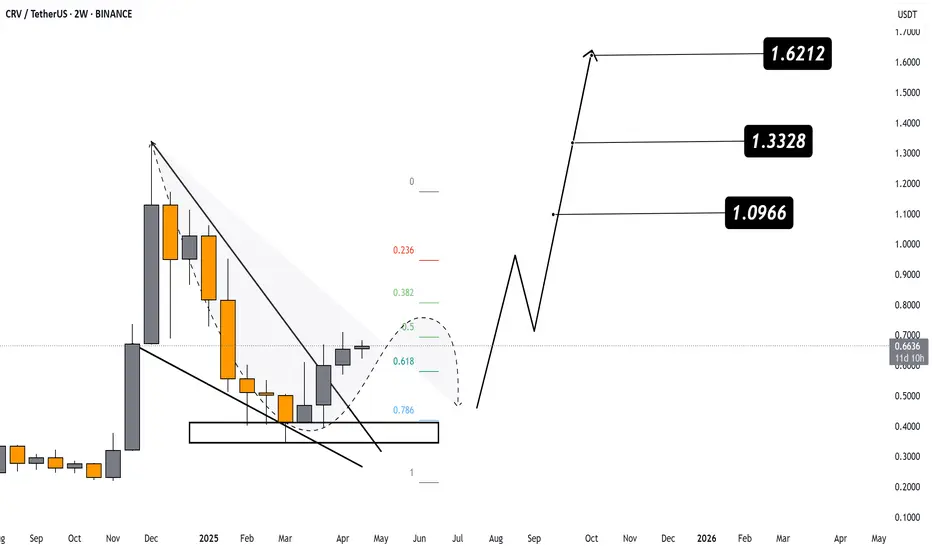
CRV/USDT – 2W Chart Overview
The price is currently consolidating after a prolonged downtrend and shows signs of a potential trend reversal.
The price has broken out of a falling wedge (bullish pattern).
Currently testing the Fibonacci retracement levels — most notably the 0.5 - 0.618 zone, which may act as a pullback entry zone.
📌 Key Buy Zone: Retest of the breakout near the 0.618 Fibonacci level (~0.55 - 0.60) could offer a strategic entry if confirmed by price action.
🎯 Upside Targets:
1st Target: 1.0966 USDT
2nd Target: 1.3328 USDT
3rd Target: 1.6212 USDT
Invalidation: Break below the support zone near 0.45 would invalidate this setup.
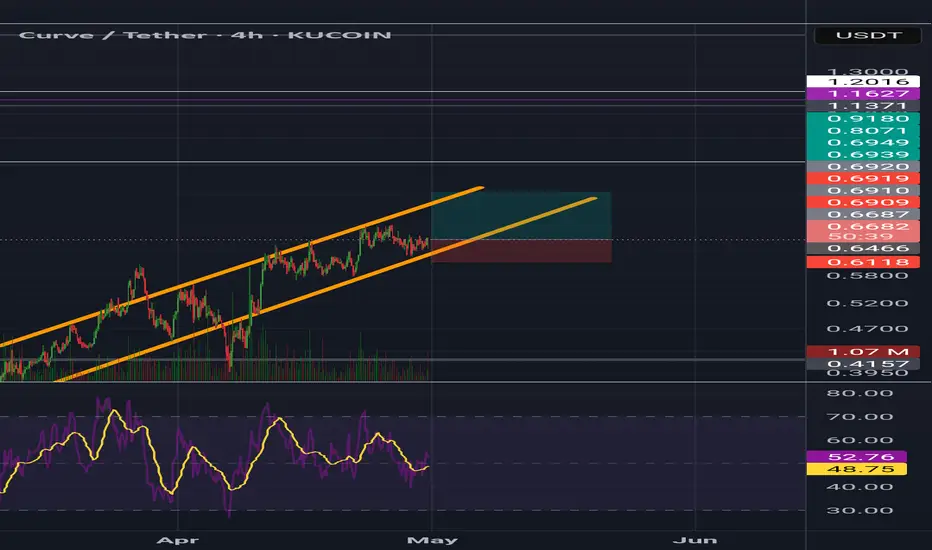
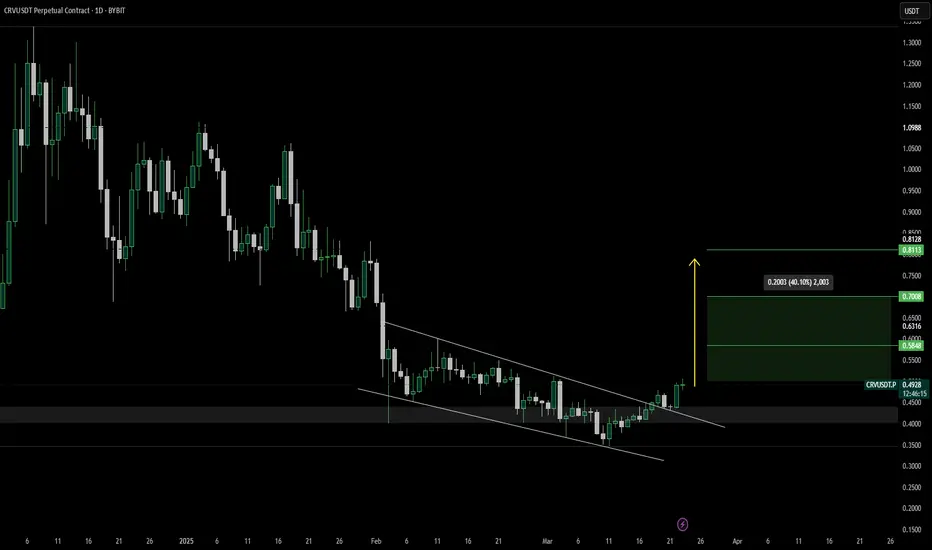
CRV/USDT LONGCRV/USDT has successfully broken out of a falling wedge, signaling a potential bullish trend. To confirm the breakout before entering a trade, an ideal long entry would be a retest of the breakout level around $0.45 - $0.48. Alternatively, if the price maintains above $0.50, a breakout continuation entry remains valid.
For profit targets, the first level of resistance stands at $0.58, marking a key psychological level. The next major resistance is at $0.70, offering a potential 40% upside, while an extended target at $0.80+ could be reached if bullish momentum persists.
Risk management is essential, with a conservative stop loss placed below $0.45, invalidating the wedge breakout, and a more aggressive stop loss set below $0.42, which aligns with a major support zone.
With an entry at $0.48, a stop loss at $0.44 (-8%), and a take-profit target at $0.70 (+45%), the trade presents a strong risk-to-reward ratio (RRR) of ~5.6:1.
To manage the trade effectively, the stop loss should be moved to break-even once the price reaches $0.58. If the price approaches $0.65 - $0.70, securing partial profits while allowing the remaining position to run is a strategic approach.
What are your thoughts?
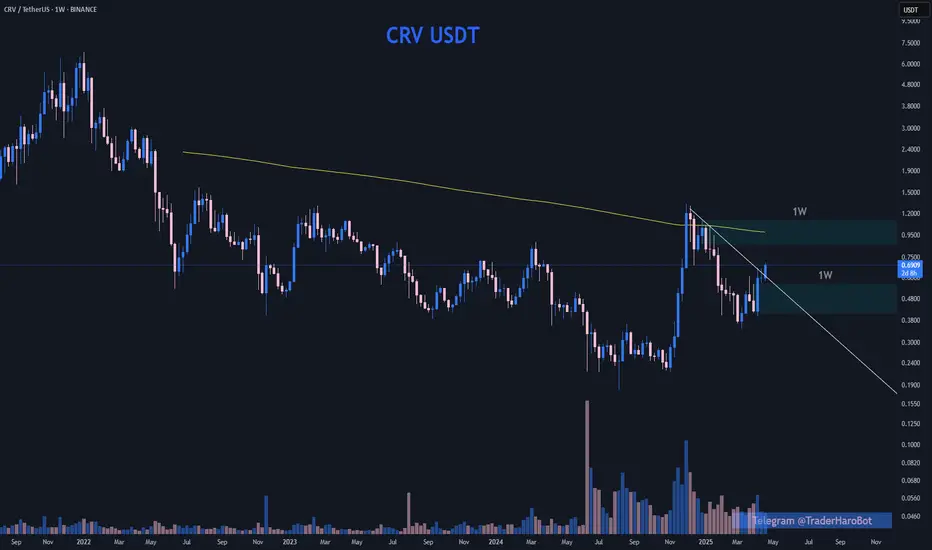
CRV is an underrated chartLSE:CRV is an underrated chart — currently in no man's land, with a weekly interest zone marked for potential trades.
Up 100% off the lows… wow.