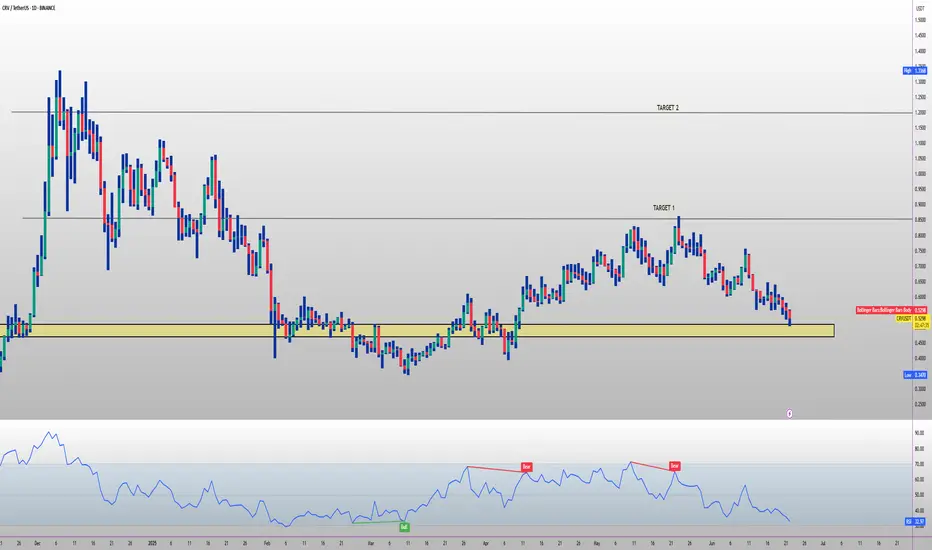
CRV TARGET FOR NEXT 3 MONTHS 🔥 LSE:CRV long setup (1 D) 🚀
✅ Entry Zone: $0.52 – $0.47 (Nov-24 launchpad demand)
🎯 Targets
• TP-1: $0.90 (Dec swing-high cluster)
• TP-2: $1.30 (#IPO wick fill)
⛔ Stop-Loss
Daily close < $0.40
📊 Thesis
• #crvUSD supply just hit a $179.8 M ATH 🏦
• #LlamaLend + Resupply loop turbo-cha
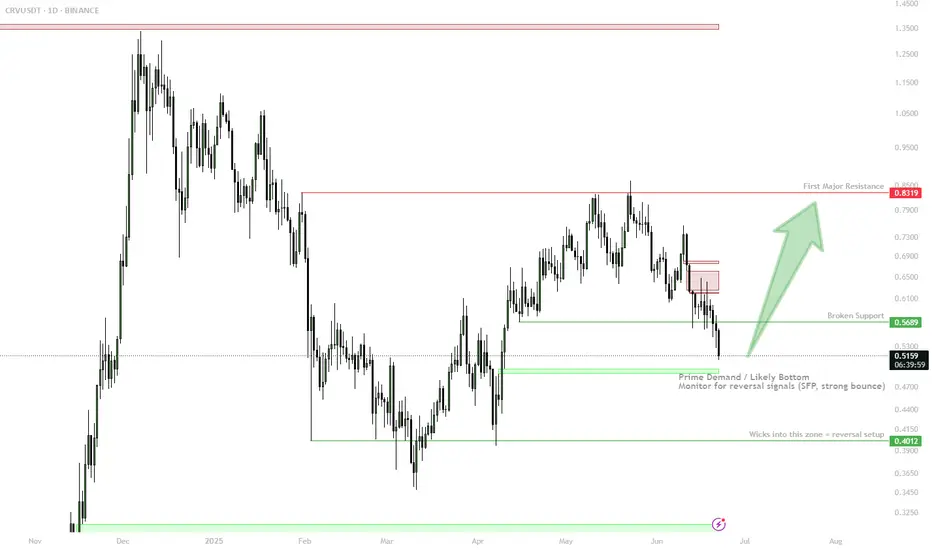
CRV Approaching Demand — Bottom Fishing in the $0.40–$0.49 Zone🎯 BINANCE:CRVUSDT Trading Plan:
Scenario 1 (Reversal from Demand):
Look for bullish SFP, engulfing, or reclaim in $0.40–$0.49 zone
If confirmed, long with first target $0.83
Tight stop below $0.39
Scenario 2 (Breakdown):
If $0.39 breaks decisively, step aside — risk of new lows
🔔 Triggers &
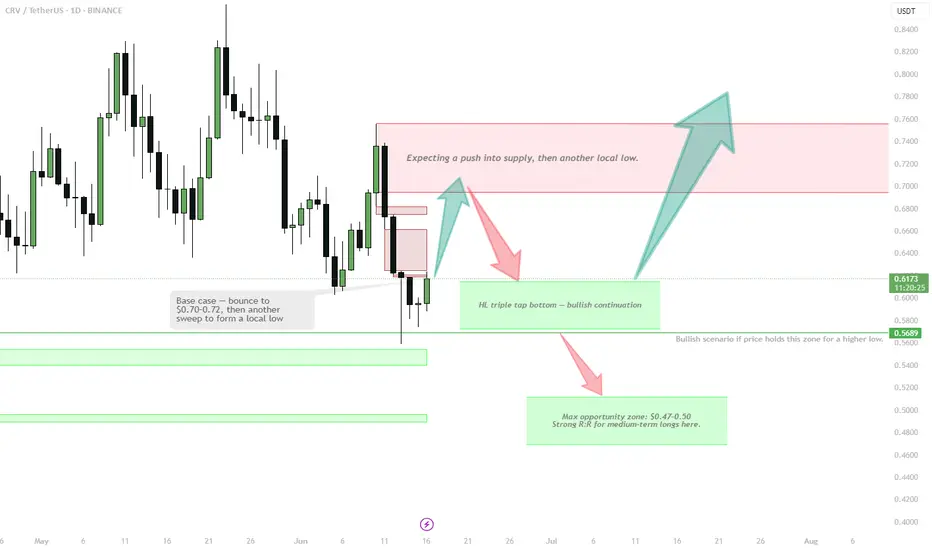
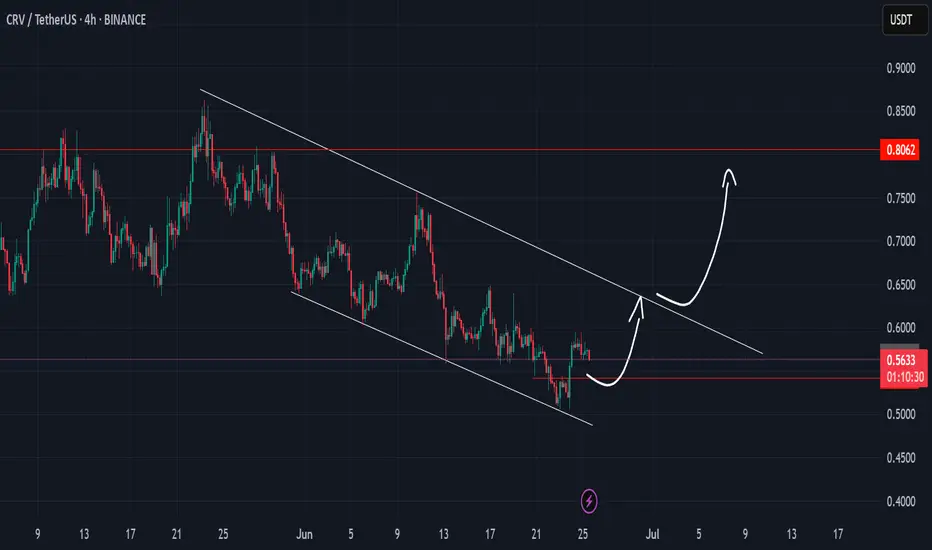
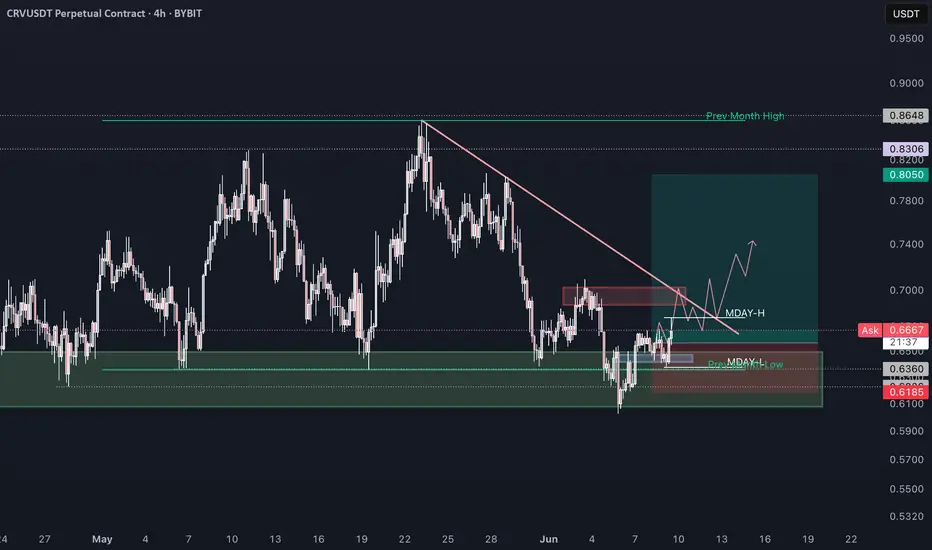
CRV | bounce then another sweep to form a local lowLiquidity taken, now eyeing push to $0.70–0.72 local supply.
Watching for another low after that move:
• HL triple tap = bullish base
• Or final drive into $0.47–0.50 = max opportunity for R:R swing longs
Breakout only confirmed above $0.75.
Patience — best setups come after the next local low.
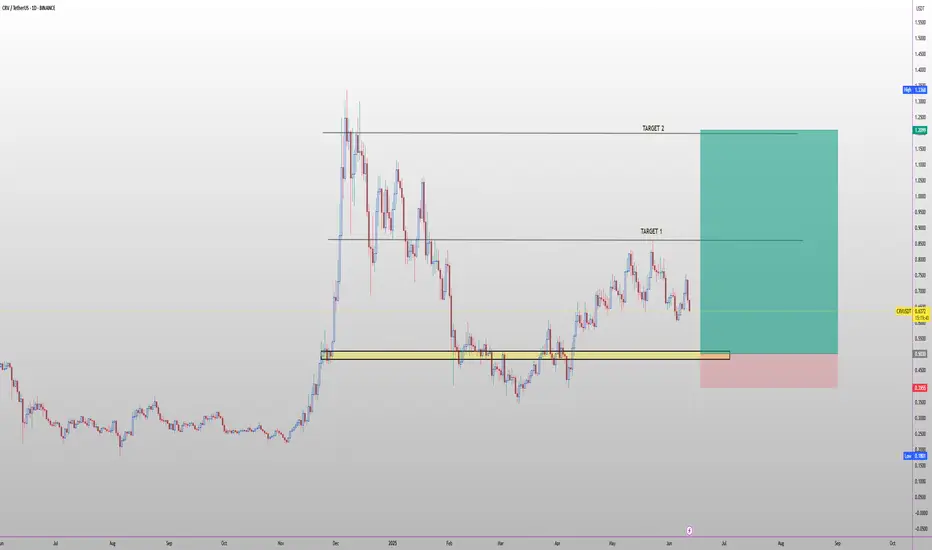
CRV BULLISH Q3 2025🔥 LSE:CRV long setup (1D) 🚀
✅ Entry Zone: $0.52 – $0.48 (re-test of Nov-24 launchpad base)
🎯 Targets
• TP-1: $0.90 (Dec swing high)
• TP-2: $1.30 (IPO wick fill)
⛔ Stop-Loss
Daily close < $0.44
📊 Thesis
crvUSD supply just hit a $179.8 M ATH 🏦, LlamaLend soft-liquidation markets are live, and
SEI Trend is FriendAfter 4th rejection, can it go higher ?
if we still keep above 0.5 we can go around 0.63 and testing trendline
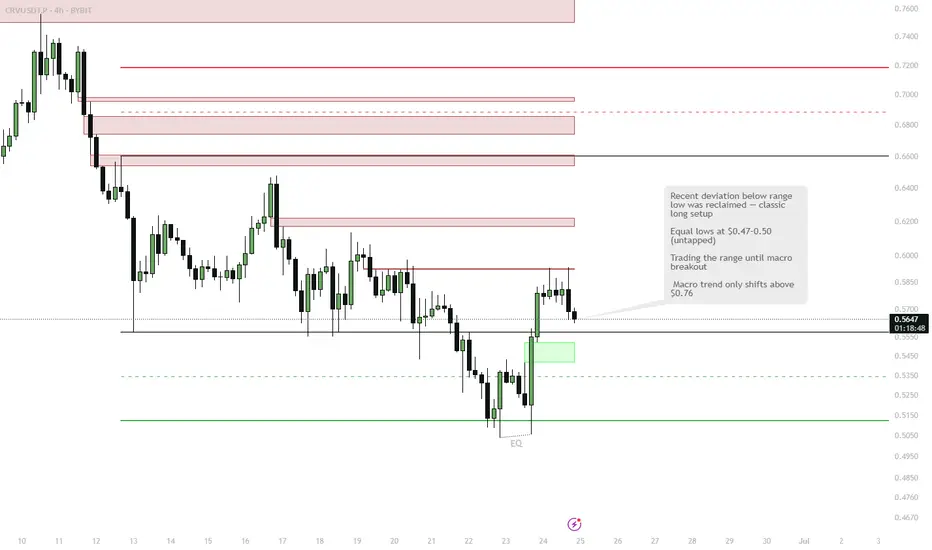
CRV Range Reclaim — Eyes on $0.70 After Classic Deviation Setup🎯 BINANCE:CRVUSDT Trading Plan:
Active Range Setup:
Long Trigger: Deviation and reclaim below $0.5585
Target: $0.70 (mid/upper range)
Stops: Below most recent deviation
Alternative:
If $0.47–$0.50 is swept, look for LTF reversal signals for a new long entry
No Macro Shift:
Stay in range-tr
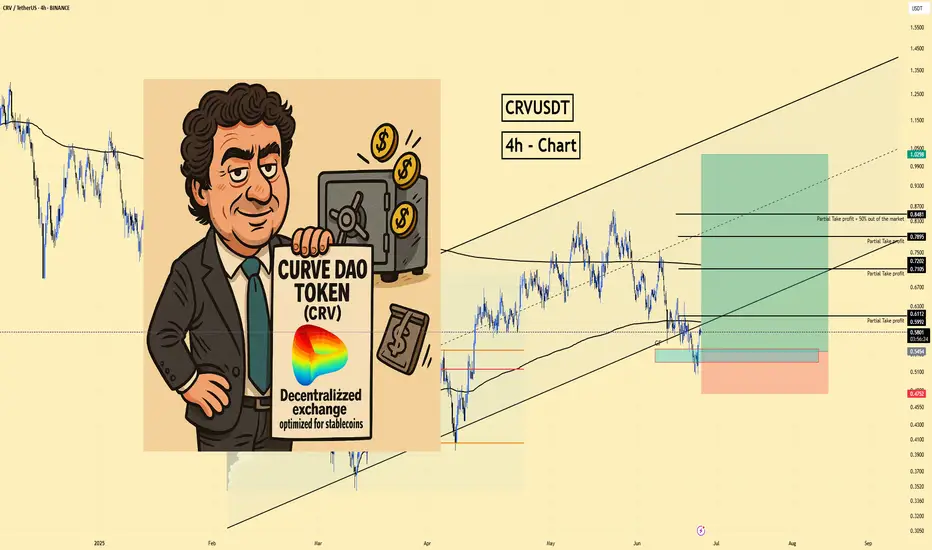
CRV/USDT | Long | DeFi Utility | (June 24, 2025)CRV/USDT | Direction: Long | Key Reason: Pattern Reversal & DeFi Utility | (June 24, 2025)
1️⃣ Insight Summary
CRV is forming a bullish “W” at the bottom of its parallel channel, supported by value area highs, point-of-control, and structural support around $0.47–$0.55. If it flips that zone into s
Crypto Signal TodayHello friends🙌
Given the buyers' support for the price and their entry, you can buy in steps in the specified areas with capital and risk management and move to the specified targets📈
Follow us for more signals😉
*Trade safely with us*
CRV long "@members CRV long would need to reclaim MO lows or BTC to looks more like it will only go higher more on the risky side"
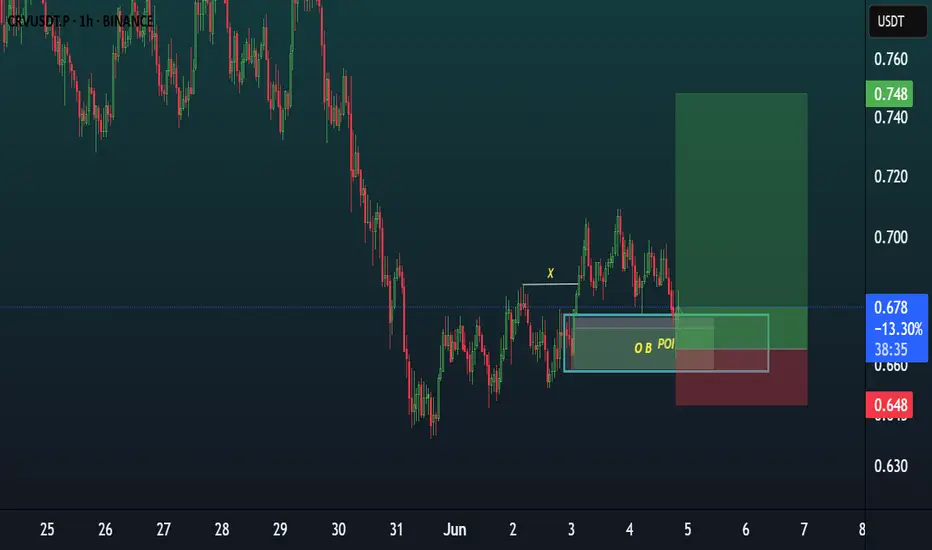
CRV BUY FROM HERECRVUSDT is looking bullish on 1H timeframe. Bullish OB+FVG area filled and green engulfing candle formation is a buy sign,
See all ideas
Summarizing what the indicators are suggesting.
Oscillators
Neutral
SellBuy
Strong sellStrong buy
Strong sellSellNeutralBuyStrong buy
Oscillators
Neutral
SellBuy
Strong sellStrong buy
Strong sellSellNeutralBuyStrong buy
Summary
Neutral
SellBuy
Strong sellStrong buy
Strong sellSellNeutralBuyStrong buy
Summary
Neutral
SellBuy
Strong sellStrong buy
Strong sellSellNeutralBuyStrong buy
Summary
Neutral
SellBuy
Strong sellStrong buy
Strong sellSellNeutralBuyStrong buy
Moving Averages
Neutral
SellBuy
Strong sellStrong buy
Strong sellSellNeutralBuyStrong buy
Moving Averages
Neutral
SellBuy
Strong sellStrong buy
Strong sellSellNeutralBuyStrong buy
Displays a symbol's price movements over previous years to identify recurring trends.