CRV BULLISH Q3 2025🔥 LSE:CRV long setup (1D) 🚀
✅ Entry Zone: $0.52 – $0.48 (re-test of Nov-24 launchpad base)
🎯 Targets
• TP-1: $0.90 (Dec swing high)
• TP-2: $1.30 (IPO wick fill)
⛔ Stop-Loss
Daily close < $0.44
📊 Thesis
crvUSD supply just hit a $179.8 M ATH 🏦, LlamaLend soft-liquidation markets are live, and
Crypto Signal TodayHello friends🙌
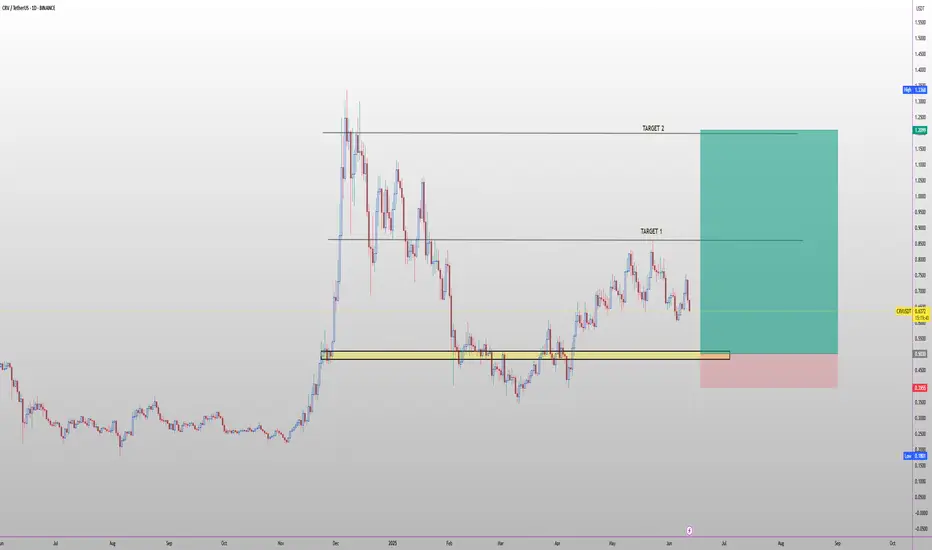
Given the buyers' support for the price and their entry, you can buy in steps in the specified areas with capital and risk management and move to the specified targets📈
Follow us for more signals😉
*Trade safely with us*
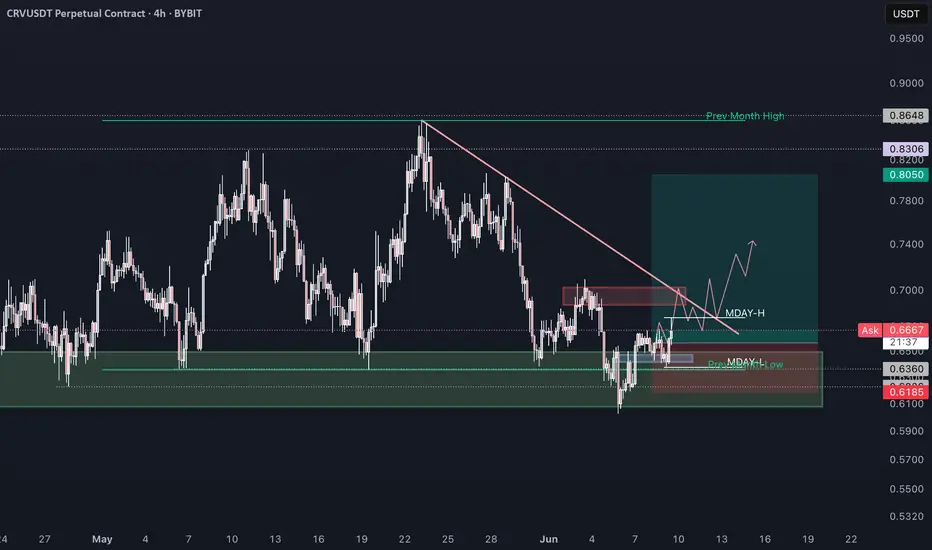
CRV long "@members CRV long would need to reclaim MO lows or BTC to looks more like it will only go higher more on the risky side"
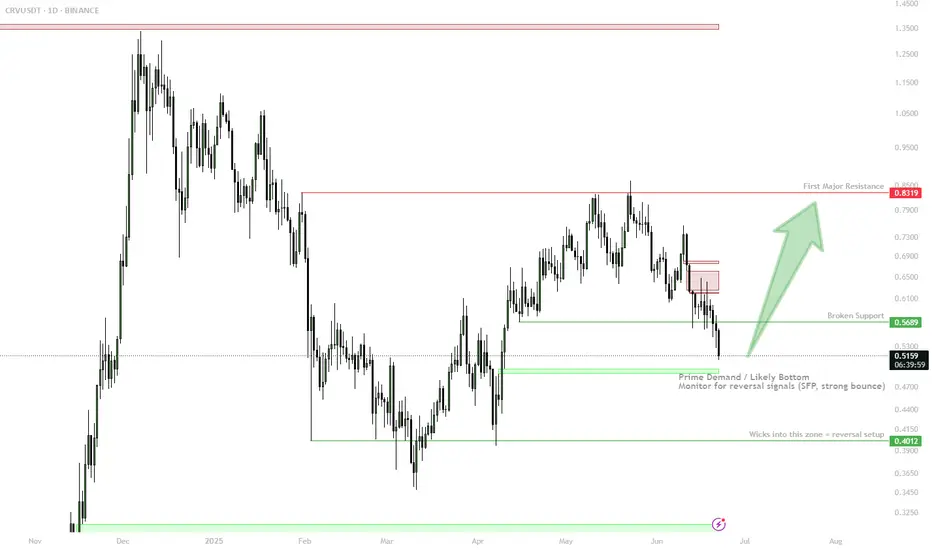
CRV Approaching Demand — Bottom Fishing in the $0.40–$0.49 Zone🎯 BINANCE:CRVUSDT Trading Plan:
Scenario 1 (Reversal from Demand):
Look for bullish SFP, engulfing, or reclaim in $0.40–$0.49 zone
If confirmed, long with first target $0.83
Tight stop below $0.39
Scenario 2 (Breakdown):
If $0.39 breaks decisively, step aside — risk of new lows
🔔 Triggers &
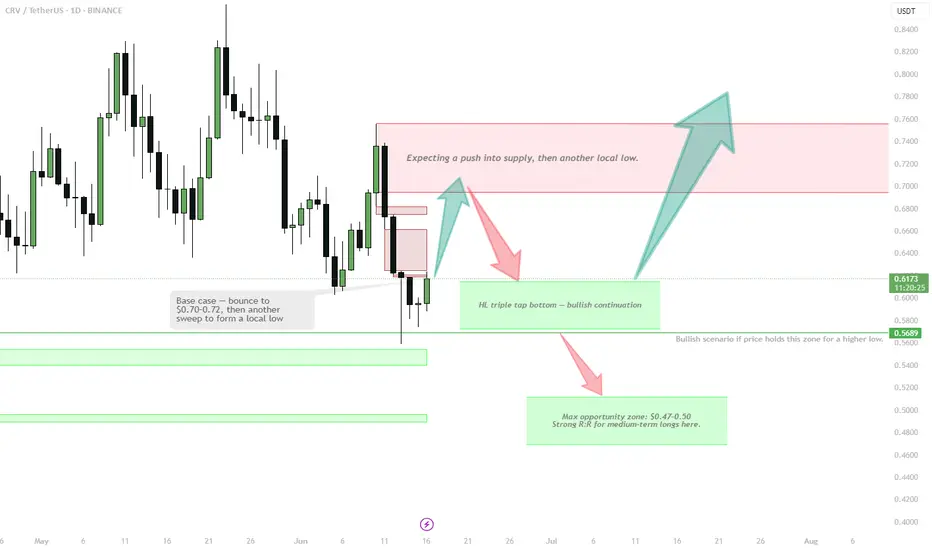
CRV | bounce then another sweep to form a local lowLiquidity taken, now eyeing push to $0.70–0.72 local supply.
Watching for another low after that move:
• HL triple tap = bullish base
• Or final drive into $0.47–0.50 = max opportunity for R:R swing longs
Breakout only confirmed above $0.75.
Patience — best setups come after the next local low.
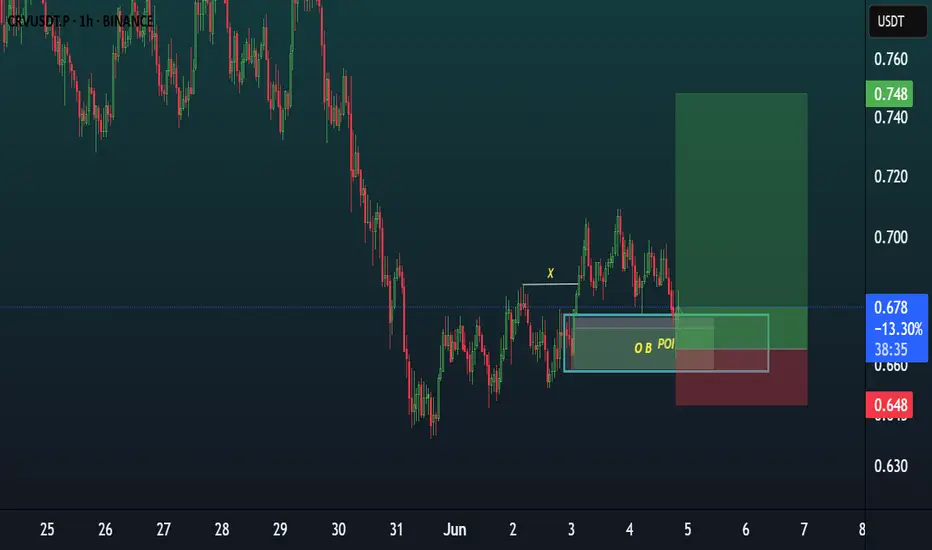
CRV BUY FROM HERECRVUSDT is looking bullish on 1H timeframe. Bullish OB+FVG area filled and green engulfing candle formation is a buy sign,
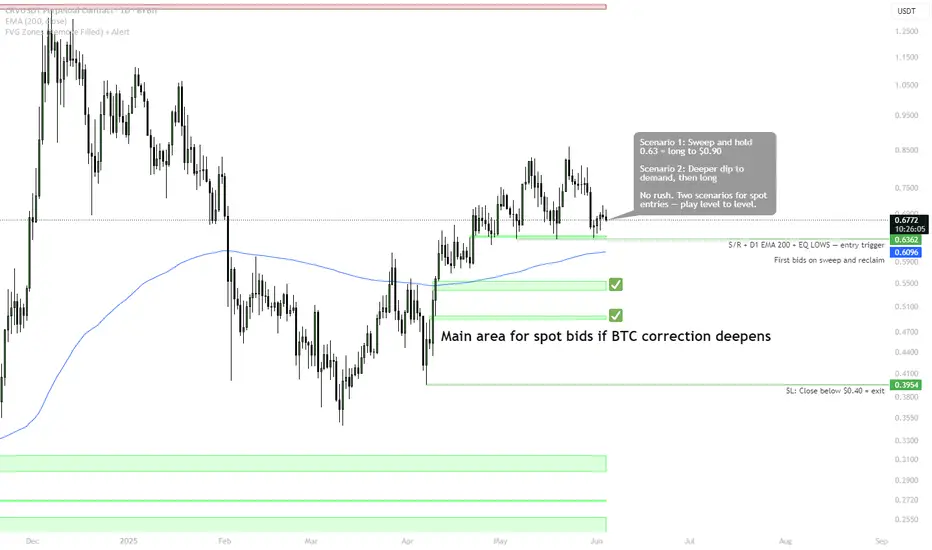
CRV - Two Scenarios for Strategic Spot BidsBINANCE:CRVUSDT
No FOMO, two clean entries.
Sweep S/R and reclaim EMA 200 — first trigger for spot longs. Equal lows at $0.61 — magnet for liquidity.
Deeper flush to demand = main buy zone ($0.40–0.56).
Stops under main demand.
Plan simple: let the market pick the entry for you.
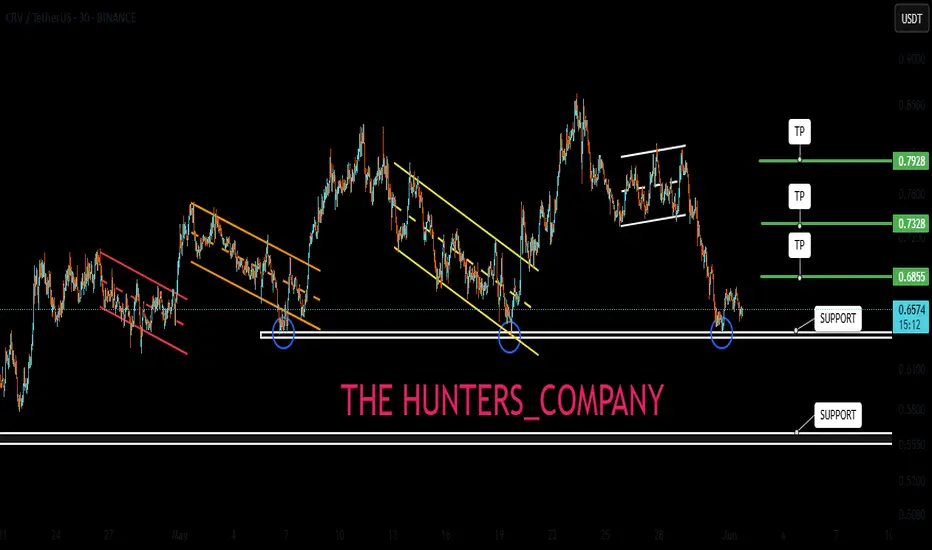
Fiery support was revealed...Hello friends
According to our technical analysis and research on this currency, we were able to find important supports for you so that you can buy on those supports in stages and with capital management.
The targets are also specified...
*Trade safely with us*
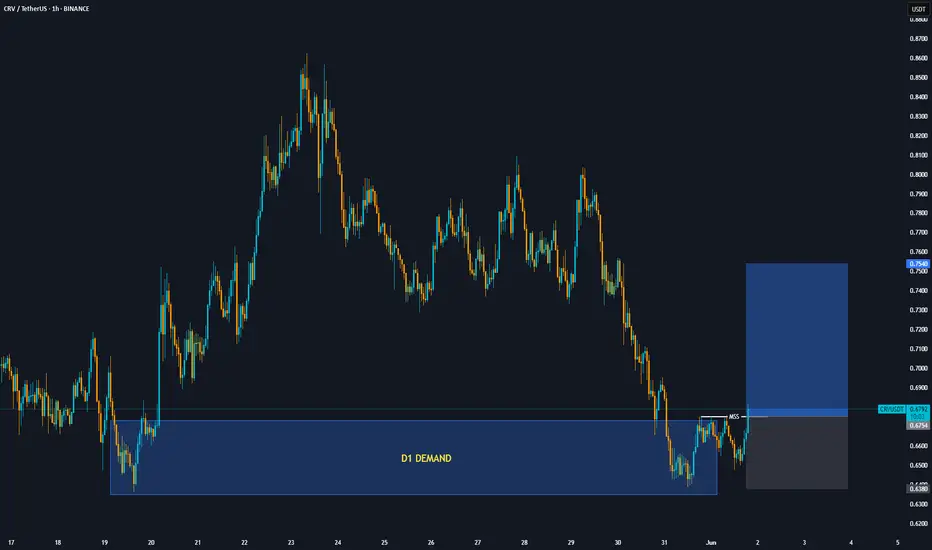
CRV D1 DEMAND LONG POSITIONThe currency is currently being rejected from the daily demand zone and has also confirmed a trend change on the 1-hour time frame. You can enter a long position with a stop loss below the last low and a take profit of twice as much.
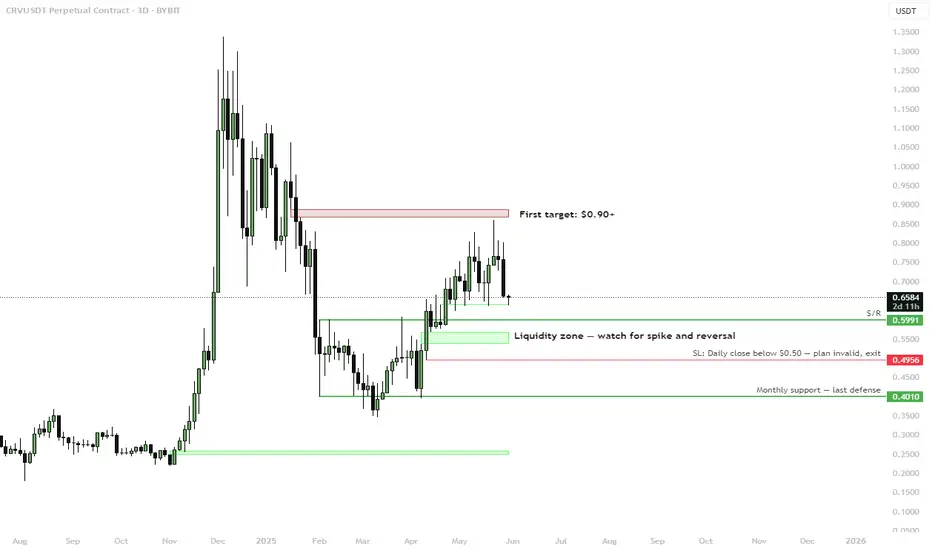
CRV (swing setup) — Watching Liquidity Zone ReactionBINANCE:CRVUSDT is pulling back into a key liquidity zone around $0.60–$0.55. This area acted as prior resistance and is now being retested as support. A spike into this zone with a bullish reaction could offer a strong swing entry.
Setup:
🟩 Liquidity Zone: $0.60–$0.55
Look for liquidity sweep and
See all ideas
Summarizing what the indicators are suggesting.
Oscillators
Neutral
SellBuy
Strong sellStrong buy
Strong sellSellNeutralBuyStrong buy
Oscillators
Neutral
SellBuy
Strong sellStrong buy
Strong sellSellNeutralBuyStrong buy
Summary
Neutral
SellBuy
Strong sellStrong buy
Strong sellSellNeutralBuyStrong buy
Summary
Neutral
SellBuy
Strong sellStrong buy
Strong sellSellNeutralBuyStrong buy
Summary
Neutral
SellBuy
Strong sellStrong buy
Strong sellSellNeutralBuyStrong buy
Moving Averages
Neutral
SellBuy
Strong sellStrong buy
Strong sellSellNeutralBuyStrong buy
Moving Averages
Neutral
SellBuy
Strong sellStrong buy
Strong sellSellNeutralBuyStrong buy
Displays a symbol's price movements over previous years to identify recurring trends.