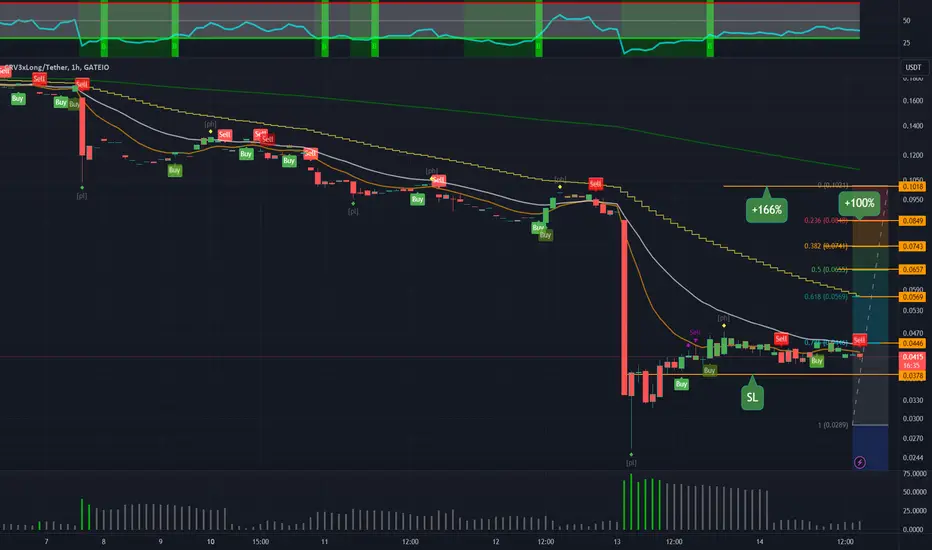
CRV 3X LONG - VERY RISKYIf anybody has an appetite for risk - leveraged tokens are a way to get into that.
You may know the official story behind the CRV drop out
There are always some bullish cases for a reversal to the previous highs.
I wouldn't bet more than my lunch money on this ..but this is me.
CRVUST trade ideas
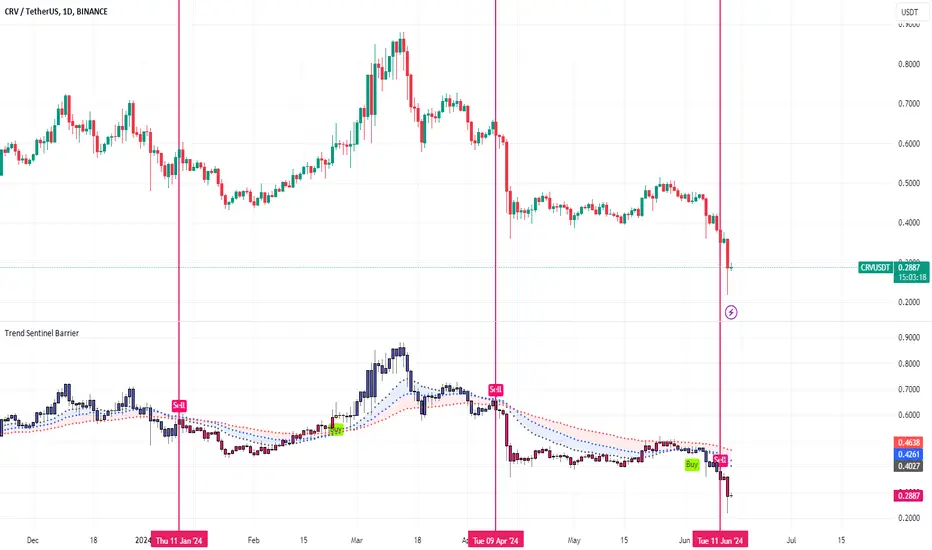
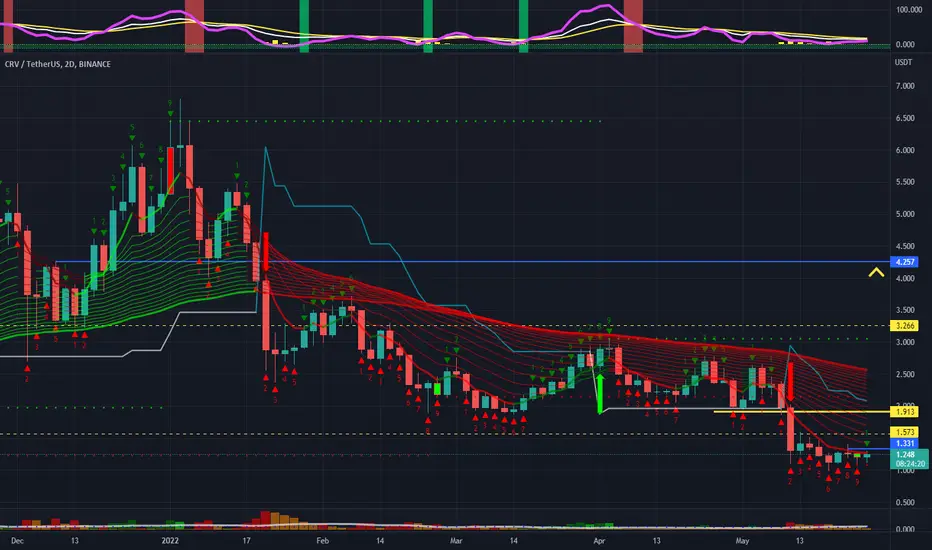
Lack of Trust ---- CRVOn June 13, the drop of CRV led to the liquidation of nearly $34 million lending positions of its founder Michale Egorov. In 2023, Michale Egorov’s position will also face liquidation risk. It ultimately conducts CRV OTC transactions with institutions and whales to obtain liquidity and reduce the healthy rate to avoid liquidation. But it happened again.
The community suspects that Michale Egorov actually cashed out a large amount of CRV through borrowing and squandered the in the real world. Curve has become one of the DeFi protocols with the highest TVL due to the introduction of the ve mechanism. Curve pools have also become a swap method that traders like to use. However, a good project is controversial because of the founder's behavior.
So far, Michale Egorov has brought the healthy rate of the position back to above 1 through OTC or active liquidation. But the price of CRV has not repaired the drop caused by liquidation. And in the Curve community, there is a voice that hopes that all Michale's positions can be liquidated. Lack of trust is CRV’s biggest resistance.
From an indicator perspective, we can see that the TSB indicator can always prompt opportunities before CRV pumping. And the most recent one happened on June 11, and again shortly after that the liquidation happened. We believe that based on Michale Egorov’s behavior and the mechanism of veCRV, CRV will continue to maintain a downward trend in the long term. You can use the TSB indicator to capture short gains.
Introduction to indicators:
Trend Sentinel Barrier (TSB) is a trend indicator, using AI algorithm to calculate the cumulative trading volume of bulls and bears, identify trend direction and opportunities, and calculate short-term average cost in combination with changes of turnover ratio in multi-period trends, so as to grasp the profit from the trend more effectively without being cheated.
KDMM (KD Momentum Matrix) is not only a momentum indicator, but also a short-term indicator. It divides the movement of the candle into long and short term trends, as well as bullish and bearish momentum. It identifies the points where the bullish and bearish momentum increases and weakens, and effectively capture profits.
Disclaimer: Nothing in the script constitutes investment advice. The script objectively expounded the market situation and should not be construed as an offer to sell or an invitation to buy any cryptocurrencies.
Any decisions made based on the information contained in the script are your sole responsibility. Any investments made or to be made shall be with your independent analyses based on your financial situation and objectives.
long on crv.ok guys the plan is simple buy CRV and stake via convex for that sweet sweet 20% apy. that ways while waiting for the trade to play out ur staking and increasing ur gains while mitigating ur losses (apy gives u crv and convex tokens). any ways heres some pattern analysis.
as most channels go you have a top res and a bottom support. Trading channels are quite useful in graphically depicting support and resistance levels. Most traders often rely on them in identifying optimal levels to buy or sell a specified security. Technical analysts can also follow any of a number of patterns that may occur within a channel to discern short term directional changes in market prices. Trading channels, however, provide one of the most important overlays that a technical analyst will use for long-term analysis and trading decisions. pretty simple stuff.
so using the long term out look to give a bit of time for that sweet sweet apy to cook we should at minimum make a 25% gain or at best case scenario a staggering 800% gain. gl bois.
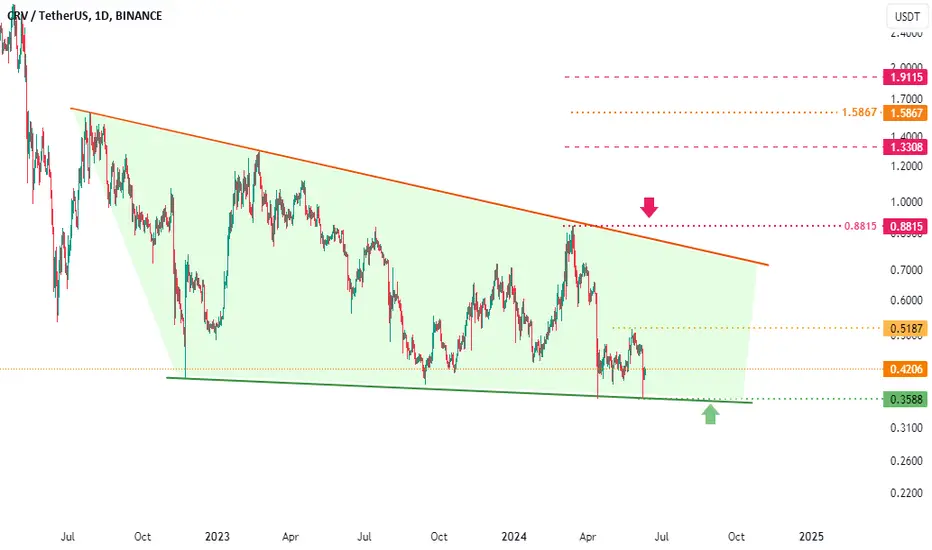
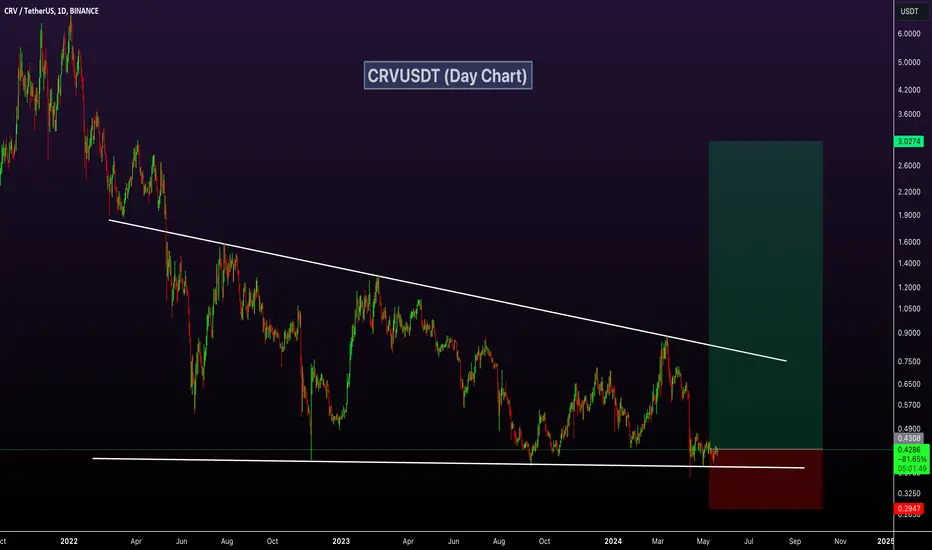
Curve Finance CRV - Recovery TargetsHere are my targets for CRV
This is a very BTC corelated coin...and this is good.
Look also for CRV/ETH pair (may pump again)
1.9 resistance may be hard to get by
after that CRV =free to rise
CRVUSDT Don't PanicLast night's drop is being blamed on stop hunting; this is likely the catalyst but the move was coming based on the wave analysis. This chart is now very similar to the ALGO chart, with an ABC off the launch high completing with this final HTF (yellow) wave 5 of the C wave down; first target was the 0.618 log Fib extension - could go lower but I count five waves for the HTF (yellow) wave 5, so I think the move is likely over. The blue wave count is the expected wave 1 of the next impulse but please take this with a grain of salt - it is pure speculation! Also bear in mind that the move will probably take six months or more...
CRVUSDT Don't PanicLast night's drop is being blamed on stop hunting; this is likely the catalyst but the move was coming based on the wave analysis. This chart is now very similar to the ALGO chart, with an ABC off the launch high completing with this final HTF (yellow) wave 5 of the C wave down; first target was the 0.618 log Fib extension - could go lower but I count five waves for the HTF (yellow) wave 5, so I think the move is likely over. The blue wave count is the expected wave 1 of the next impulse but please take this with a grain of salt - it is pure speculation! Also bear in mind that the move will probably take six months or more...

CRVUSDTPair : CRVUSDT ( CRV / Tether )
Description :
Completed " 12345 " Impulsive Waves
Resistance Level
Break of Structure and Retracement
Fibonacci Level - 23.80%
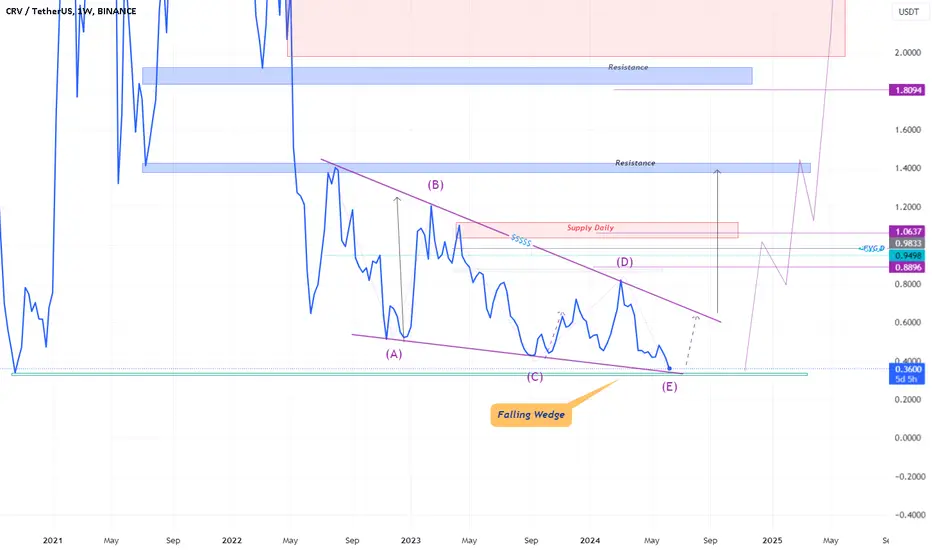
Falling Wedge as an Corrective Pattern in Short Time Frame

crvusdtHello friends
CRV is in a falling wedge pattern, I expect it to go back up from these areas
And the chart is in regular scale and is in line form
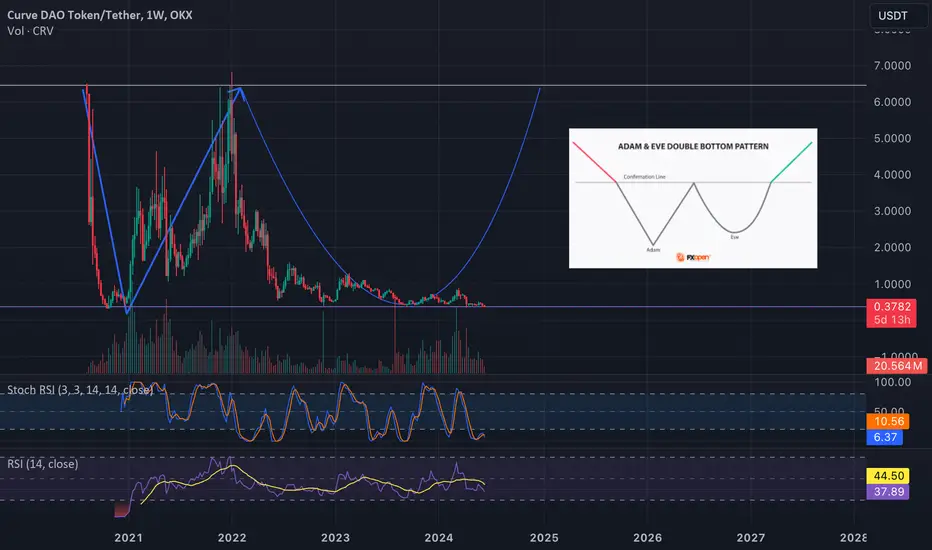
CRV forming adam and eve patternAs we all know altcoins move in cycles and as btc has reached its all time high again now is the time for bitcoin dominance to fall and money will rotate into altcoins.
CRV has made some record revenues from fees even during this long bear market for alts. Now it's all about patience.
CRV is currently trading around its all time lows ie. $0.378 and I expect this to break its previous all time high during this bull run.
Note: This is not a recommendation to buy and just a personal analysis.
CRVUSDT | Small Move Higher on the Horizon?Market Context
We’ve got an intriguing setup on CRVUSDT! A bullish engulfing candle on the 1H chart, coupled with a trendline break, could be signaling a move higher today.
Strategy
While the market might be quiet today, this calm could allow smaller tokens like CRVUSDT to make some interesting moves. This setup suggests we could see a nice pop!
Let’s keep an eye on this—small tokens often bring big surprises!
#CRVUSDT a good pattern )It has made a beautiful green pattern.
If it can maintain its green bottom, it can grow even up to the ceiling.
So stop loss is the green floor
We are waiting for a good move and watch it
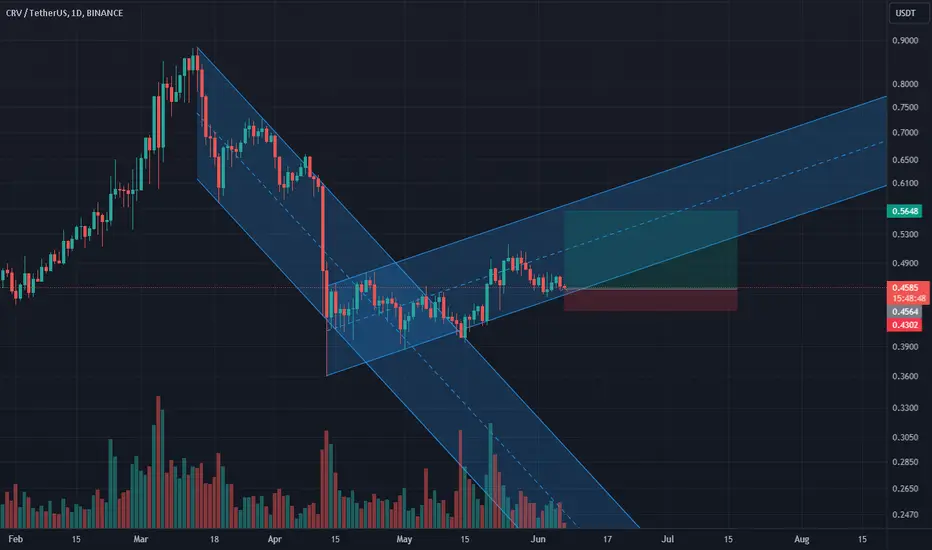
Long signal for CRV/USDTThis technical analysis is based on the daily chart of CRV/USDT on the Binance exchange. This analysis draws two price channels and evaluates support and resistance levels.
Price Channel Analysis:
The previous bearish channel is broken out, and a bullish channel is formed.
The suggested entry point is around 0.4564 USDT.
Entry and Exit Points:
Entry: 0.4564 USDT
Take Profit: 0.5648 USDT (23.77%)
Stop Loss: 0.4302 USDT (5.74%)
R/R Ratio: 4.14
Conclusion:
This analysis suggests that by adhering to the specified take profit and stop loss levels, a successful trade can be achieved. The Reward/Risk Ratio for this trade is approximately 4.14, indicating a highly favorable risk-to-reward scenario. To manage risk effectively, it is recommended to strictly follow the stop loss level.
CRVUSDTPair : CRVUSDT ( CRV / Tether )
Description :
Consolidation Phase in Short Time Frame
Break of Structure
RSI - Divergence
Completed " 12345 " Impulsive Waves
Demand Zone
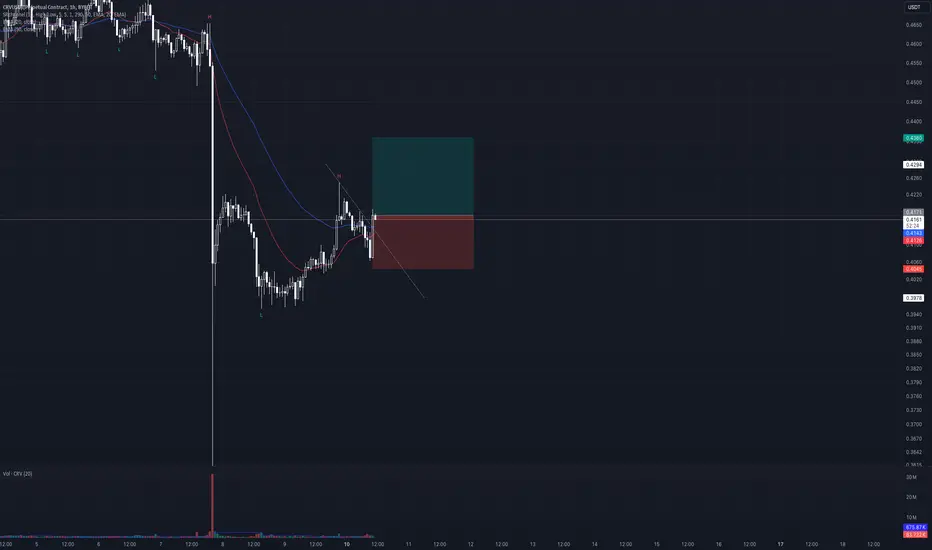
Alikze »» CRV | Congestion exit and dynamic trigger failureIn the weekly time, after a complex correction, now after exiting the concentration, it can take two paths in the face of the resistance ahead, of course,
🔰in the lower time, a shadow has been cast on the green box area. Therefore, after breaking the red bar, it will have the ability to grow up to the first supply zone, and if it continues, it can touch the second supply zone. If the behavior and structure of the post changes, it will be updated.
»»»«««»»»«««»»»«««
Please support this idea with a LIKE and COMMENT if you find it useful and Click "Follow" on our profile if you'd like these trade ideas delivered straight to your email in the future.
Thanks for your continued support.
Sincerely.❤️

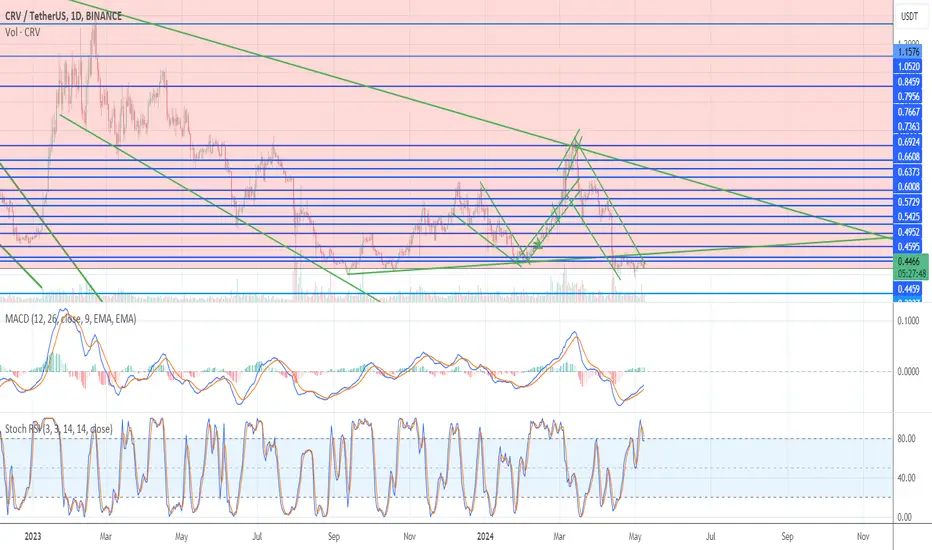
CRVUSDT 600% PotentialCRVUSDT Technical analysis update
CRV price is consolidating at its major support. We can expect a good bounce from the current level. In the current bull run, CRV could potentially move up by at least 600%.
Buy zone : Below $0.45
Stop loss : $0.30
Regards
hexa
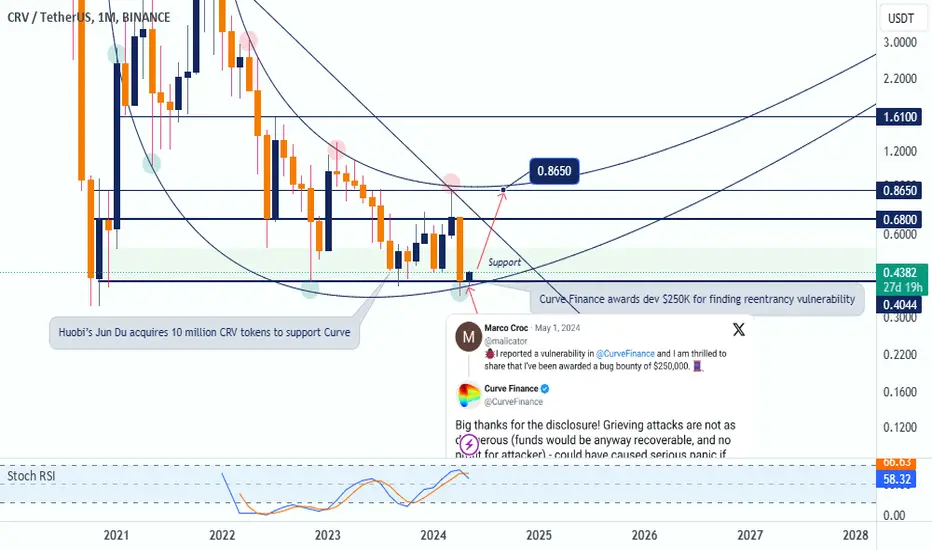
CRV Set for Liftoff as Monthly Support Solidifies at $0.40Curve DAO Token (CRV), anticipating a significant upswing in the coming weeks. CRV has found support at a crucial monthly low of $0.40 , potentially signaling a reversal of its recent downtrend.
This monthly previously support has instilled confidence in the token's ability to climb towards higher price targets. I am cautiously optimistic, projecting a potential surge towards $0.70 and even $0.86.
The coming weeks will be crucial for CRV. If the token can maintain its momentum and surpass the $0.40 support level, a surge towards the projected targets becomes a more realistic possibility.
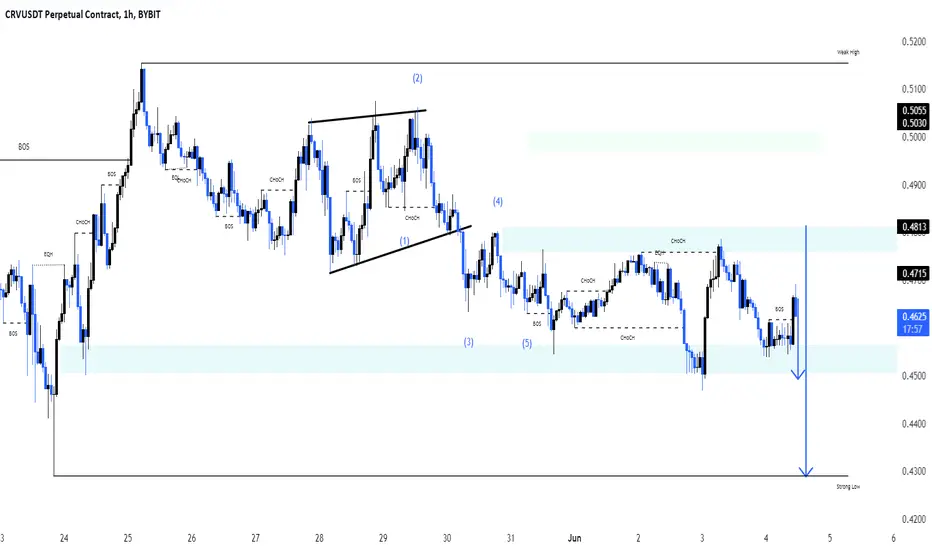
CRV - on its lows at 3DThis 0.50$ pirice level is very important to watch. If we will not be able to bounce up above this level and stay there I think CRV didnt bottomed yet and we might test 0.20-030$ price level which would be my second buy zone. Indicators are laying on the ground and CRV is sleeping for a very very long time now. A lot of people are longing and expecting strong push to above 1 - 1.5$ range. I would be careful here because coin is laying on its lows now and people might sell because they will not have strong hands here for this pretty long time of slow moves. Anyway Im longing from 0.40$ but as I mentioned we must go above EMA's and change the direction at 3D time frame. Now everything looks really bad.

CRV offers an exceptional Risk Reward Ratio hereCRV/USDT (Curve DAO)
Sector: Decentralized Exchange
Market Cap: $520M
The CRV token is currently on its lower support level, the one that had held its price before the 2021 run and which has held its price during the last two years of Bear Market.
The risk appears limited at this entry point by placing a Stop Loss below the support. The risk-reward ratio is exceptional if we manage to hold the support.
Another wise entry point would be to wait for confirmation of the underlying uptrend by making a new point higher than the previous one on the 3 Days timeframe, with a close above the downtrend line which has been acting as a resistance since summer 2022.
If we have indeed already found our bottom level, we will need to take profits all the way up, because selling all our tokens at the market's highest point is simply unhoped-for and the probability of getting there is close to 0, so secure a maximum of profit if you get the chance and don't let slip it away!

Crypto - CRVPair : CRVUSDT ( CRV / TETHER )
Description :
Completed " 12345 " and " A " Corrective Waves
Break of Structure
Support Level
Consolidation Phase in Short Time Frame and Rejection from Lower Trend Line
RSI - Divergence

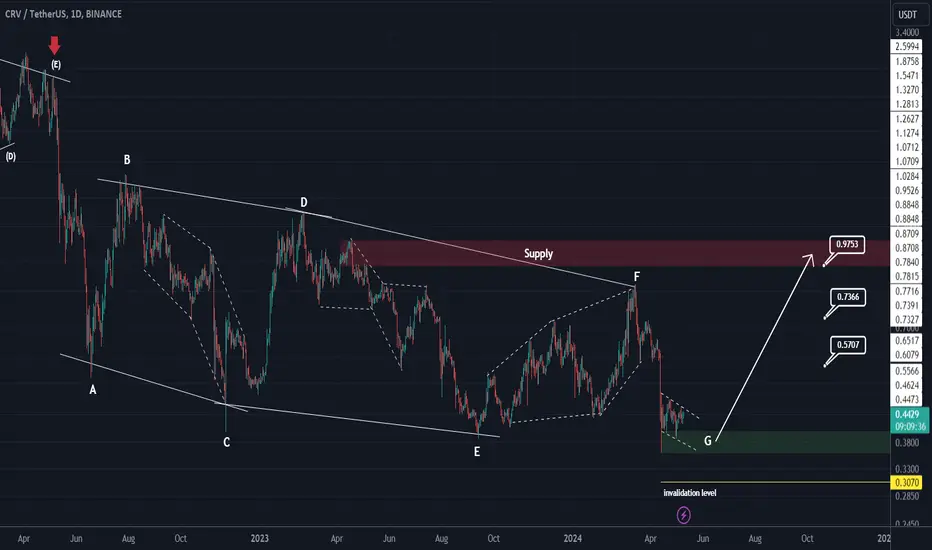
CRV looks very bullishCRV seems to be at the end of a big correction. This correction on the chart started from where we placed a red arrow.
It seems that this modification was a diametric one. Now the last wave of this diametric, the G wave is ending.
By maintaining the green range, it is expected to move towards the targets.
Closing a daily candle below the invalidation level will violate the analysis.
For risk management, please don't forget stop loss and capital management
When we reach the first target, save some profit and then change the stop to entry
Comment if you have any questions
Thank You
CRV now or never Now or never :) We have been on bottom for a while so we should go up in some point, right? Fundament is strong so finger crossed :) DYOR
Ditch These ALTCOINS that are UNDER PERFORMING💀Some altcoins have stayed behind during the most recent BTC surge. These include :
👎 DOT
👎 XRP
👎 ADA
👎 UNI
👎 HBAR
👎 CRV
👎 ALGO
Overlay any of these with the BTC chart, and you get something similar to this.
Now compare it to the PREVIOUS BTC all time high.
I'm not saying these coins are done for, or that they do not have a future. But my focus is on coins that can be tradable and profitable in fairly short periods of time. Holding on to an alt that doesn't move for months (only to increase 15%) is a bad strategy.
It would have been more profitable to take the loss and trade another coin with 50%+ increase, such as ETH, SOL, DOGE, NEAR etc. to name a few examples.
Ditch them and focus instead on coins with more volatility - You can't be holding through an entire new BTC high and the alt has barely broken out of accumulation - this simply won't do, because there are many other trading opportunities where you can make bigger gains and better profits just because they actually move.
_______________________
BINANCE:BTCUSDT BINANCE:XRPUSDT BINANCE:ADAUSDT BINANCE:DOTUSDT BINANCE:CRVUSDT

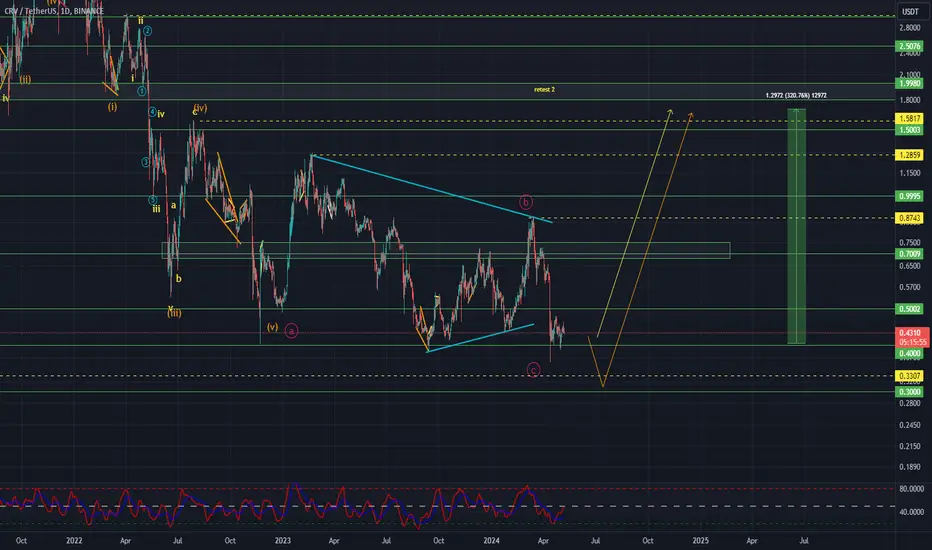
CRVUSDT Elliott Waves AnalysisHello friends.
Please support my work by clicking the LIKE button👍(If you liked). Also i will appreciate for ur activity.
Everything on the chart.
Im waiting for growth from current price or through one more decline in 0.33 - 0.3$ zone.
Entry: Market and lower
Targets: 0.73 - 1 - 1.3 - 1.6
Main target zone: 1.6 - 2$
Stop: (depending of ur risk).
ALWAYS follow ur RM.
risk is justified
It's not financial advice.
DYOR!