buy positionHello guys
This currency has managed to break its resistance due to its good growth.
Now, when the Pullback moves, it goes under the Pullback with a stop loss and enters a long position.
Capital management should be observed.
This analysis is only reviewed from a technical point of view.
Be successful and profitable.
CRVUST trade ideas
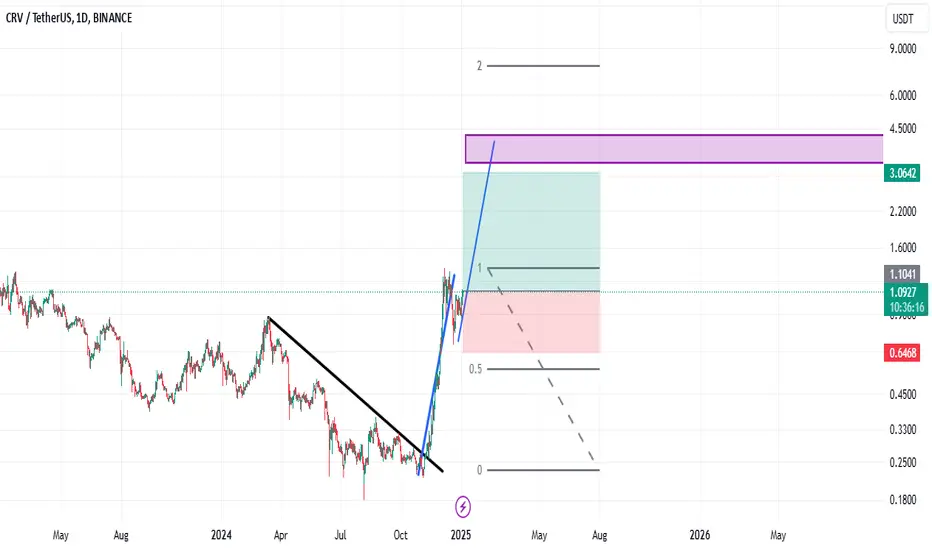
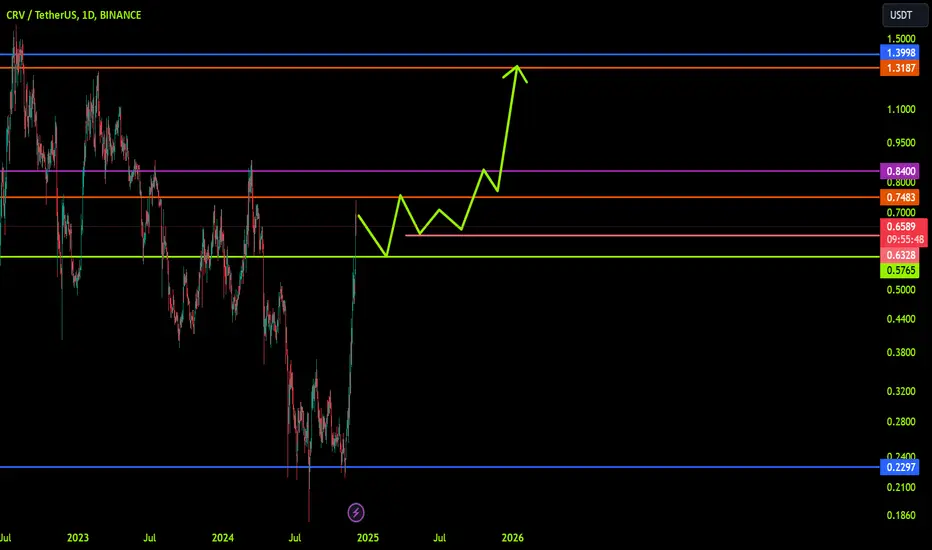
Prepare to BUY Spot CRVUSDT on the New D1 Cycle
🌟 Position Yourself for the Next Move with CRVUSDT! 🌟
🌍 Market Overview:
CRVUSDT is setting up for a strong bullish cycle on the D1 timeframe, making it an excellent opportunity to achieve a significant short-term gain.
📊 Trade Plan:
📌 Entry: Around $0.944 – An optimal entry point for the new cycle.
🎯 Target: x1 (100% gain) – Doubling your investment with a well-defined target.
⏳ Hold Time: 1 week – Strategic short-term hold aligned with the D1 cycle.
🔍 Strategy Insights:
My custom tool RainBow MG3 highlights CRVUSDT as a high-potential setup for this cycle.
Volume trends and technical indicators suggest a strong chance of reaching the target within the specified timeframe.
🚀 Next Steps:
💬 Contact me for personalized guidance or more detailed strategies.
💡 Note: This is not financial advice. Always DYOR before trading.
🔥 CRVUSDT is ready for a breakout – Position yourself and ride the wave! 🔥
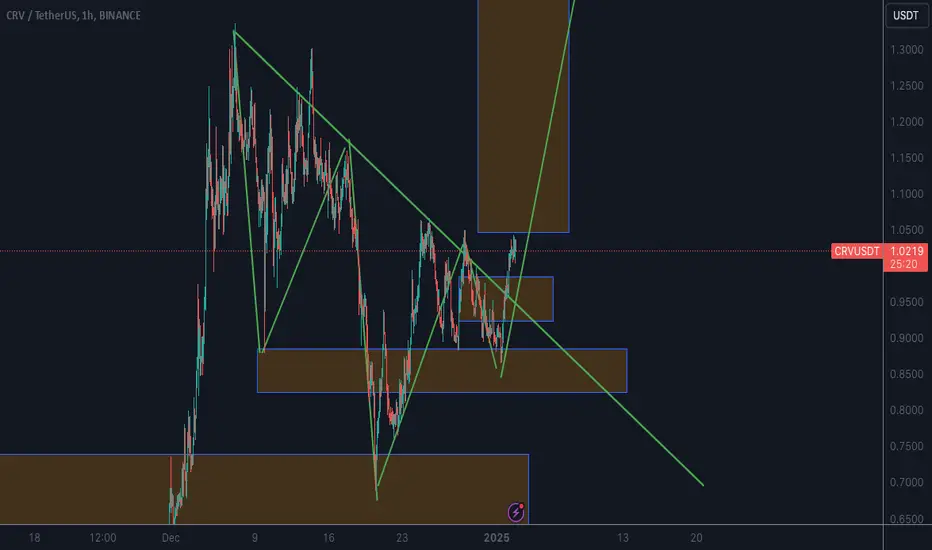
CRV - Clear BreakoutFollowing on from the last idea, we can see the follow through and breakout on CRV
The first target is the prior highs near 1.3, then alt season likely kicks off in full steam with the Trump inauguration in 3 weeks.
Could the inauguration be a sell the news event? Maybe - We'll have to assess the price action closer to the time.
The reality is that R/R is skewed positively right now for CRV
- Daily MACD cross-over
- RSI MA Crossover and now moving up
- Resistance breakout on a Bull flag pattern.
CRV Long : Inverse H & S PatternInverse head an shoulders pattern spotted on CRV 1 hr chart .
Left shoulder bottom coincides with strong demand zone between 0.82 and 0.88.
Primed for explosive upward move to 1.9 resistance
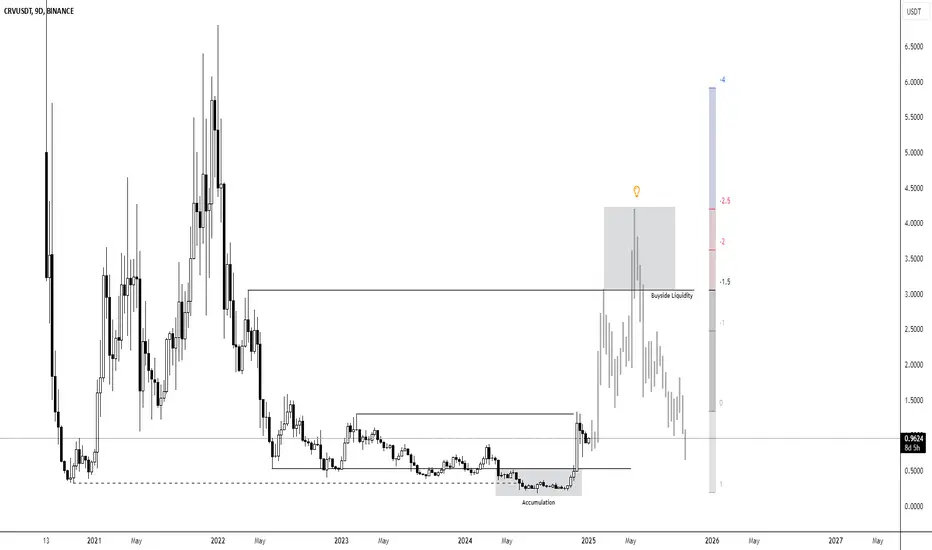
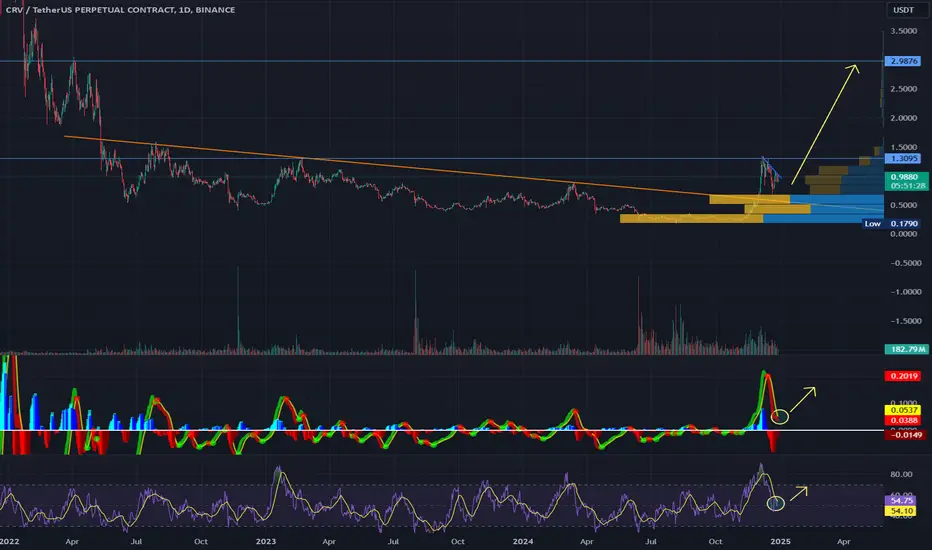
CRV LongThis chart displays the price movement of CRV/USDT on a 9-day candlestick chart.
The chart illustrates a significant accumulation phase followed by a sharp price rise, with an emphasis on the liquidity levels at key points.
The initial drop in price leads into a period of consolidation, marked by an "Accumulation" phase.
After the accumulation phase, we observe a surge in price, targeting the "Buyside Liquidity" area.
The price is currently at a lower level, indicating potential opportunities or challenges in the price movement based on liquidity zones.
The liquidity zones, particularly the "Buyside Liquidity" marked on the chart, could play an important role in price dynamics moving forward.
The chart suggests that future price movements may depend heavily on the dynamics of the liquidity zones and the market's ability to maintain higher price levels after the recent surge.
TradeCityPro | CRV: Daily & 4H Correction Patterns👋 Welcome to TradeCityPro!
In this analysis, I will examine the CRV coin, which belongs to the Curve project, a DEX platform in the DeFi space. The analysis is conducted on both daily and 4-hour timeframes.
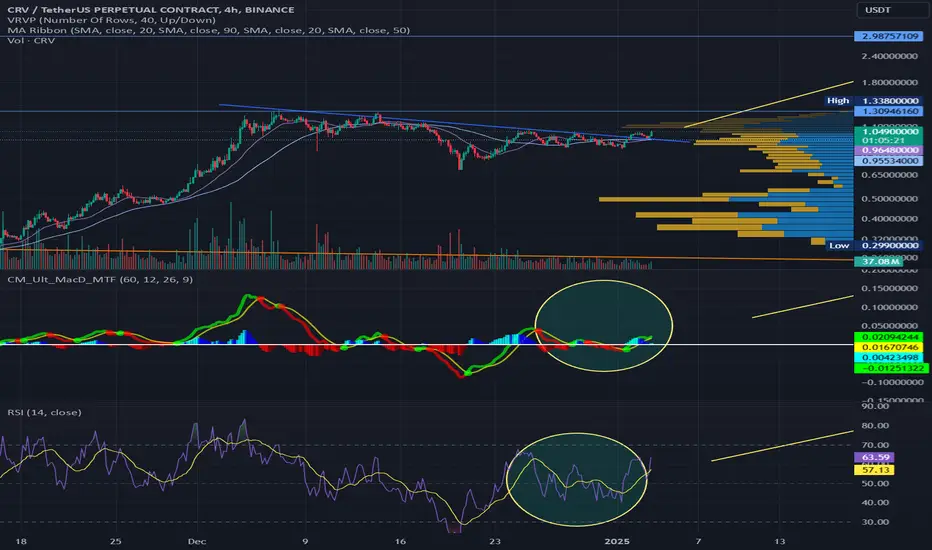
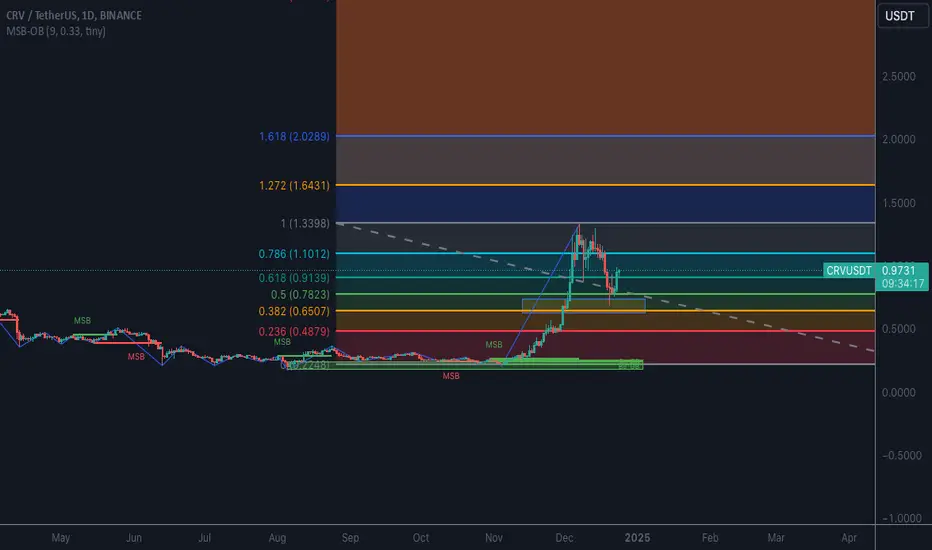
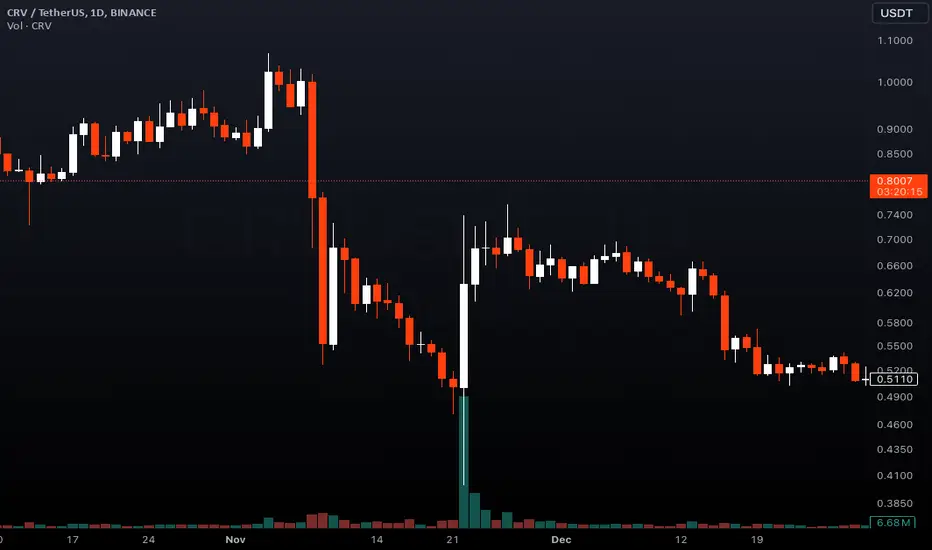
📅 Daily Timeframe: Beginning of Correction In this timeframe, after negative news for CRV, the price reached the support level at $0.2309, forming its main bottom there and starting its upward movement after accumulating.
📊 With the influx of buying volume, resistances at $0.3425 and $0.4070 were easily broken, and the price reached the resistance at $1.2630 with high momentum. The buying volume peaked and, with a Blowoff candle, the price correction began.
✨ The RSI exiting the Overbuy zone triggered the start of the price correction down to $0.382. Currently, the bottom of the correction is forming at $0.7890, and breaking this area could reach the $0.5 and $0.618 Fibonacci levels, which I have marked as limited areas for you. If these areas break, the next supports will be at $0.4070 and $0.3425.
🔍 If the price wants to continue in the same cycle with the next upward wave, it should not lose the range between $0.5 to $0.618 Fibonacci. Breaking this range would reset the market momentum, and the chart would need to create a new structure.
📈 For going long, the best trigger is breaking $1.2630 targeting $1.9116. If this area breaks, the volume and RSI should converge with the price. A divergence in volume greatly increases the likelihood of a fake break. For riskier triggers, it's better to look into the 4-hour timeframe.
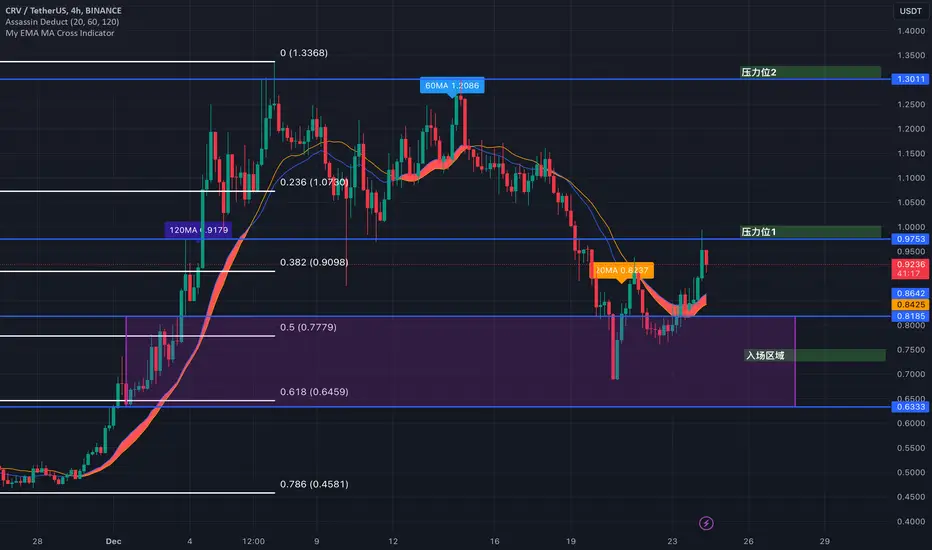
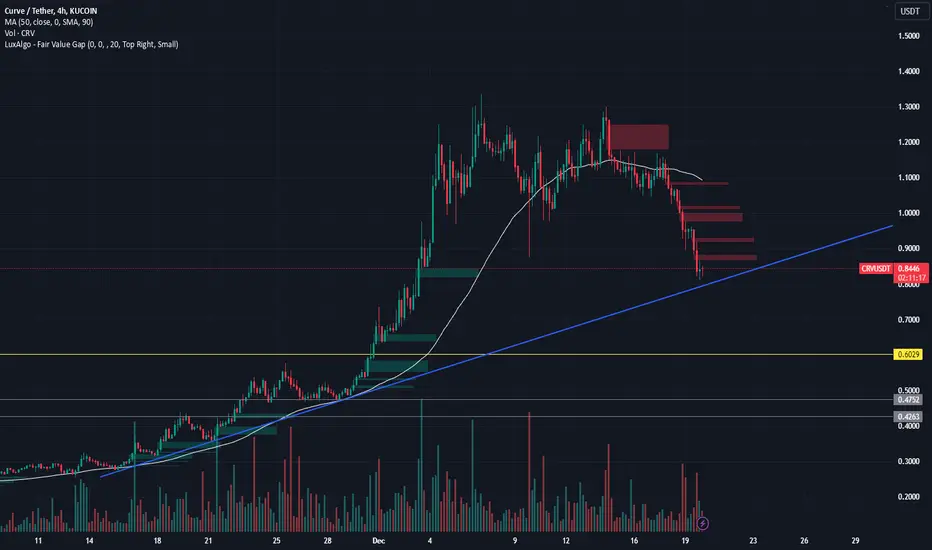
⏳ 4-Hour Timeframe: New Price Structure in the Correction Phase
In the 4-hour timeframe, we can see the last upward leg in more detail and apply a new Fibonacci Retracement.
🧩 Currently, the price has corrected to the $0.5 Fibonacci zone, which overlaps with $0.7890, forming the primary bottom of the correction.
🔼 For an early and risky long position, breaking the resistance at $1.0451 is suitable. However, as mentioned in the daily timeframe analysis, the main resistance and trigger for going long is $1.2630.
🔽 For a short position, breaking the $0.382 Fibonacci, which overlaps with $0.9069, is suitable, but be cautious as you are shorting in a correction of an upward trend. Engage minimal risk so that if the upward trend continues, you do not incur significant losses.
🔑 The market volume has been decreasing since the peak at $1.2630 and is now at its lowest. The RSI is also ranging between 39.82 to 59.27, with a break of either area potentially introducing new momentum into the market.
📉 If further correction occurs, the next supports are the $0.618 Fibonacci at $0.69, and the areas at $0.5553 and $0.4661.
📝 Final Thoughts
This analysis reflects our opinions and is not financial advice.
Share your thoughts in the comments, and don’t forget to share this analysis with your friends! ❤️

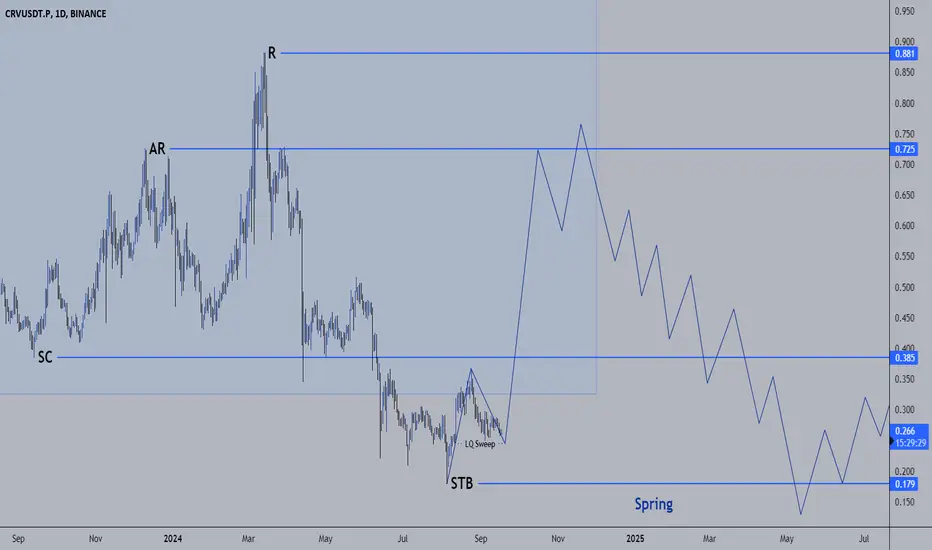
CRVUSDT Accumulation Phase for Long RunAfter manipulation major Lows and Swept Liquidity and recent price action I anticipate have a Run to higher levels.
IT'S NOT A FINANCIAL ADVICE.
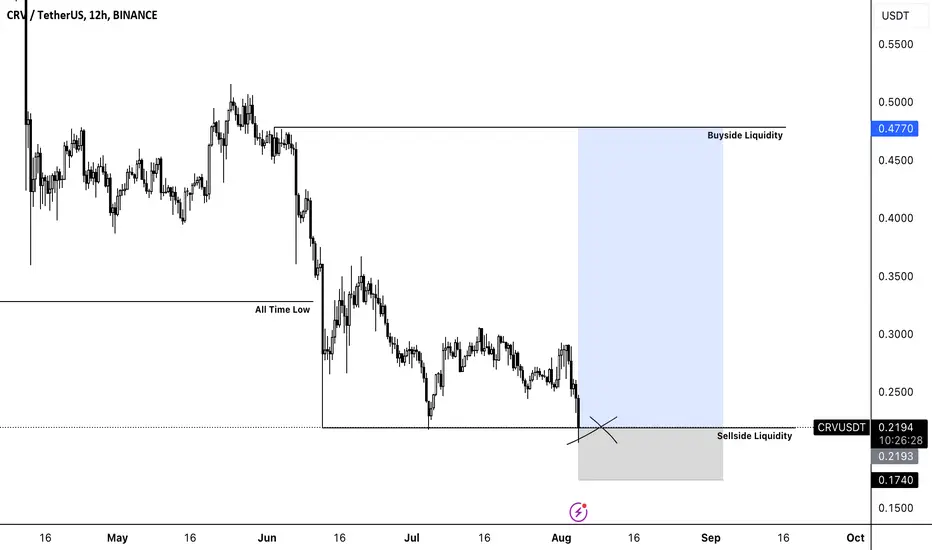
CRV Long- It has hit our HTF Sellside Liquidity Target and an all time low.
- Market is in fear mode right now
- Bitcoin dumping
- CRV Stops have been ran.
- We are trading below the Monthly opening which is great for buying if we are bullish
CRV - Ready for the next leg higherBINANCE:CRVUSDT Stalled at horizontal resistance. Indicators cooled off, and now ready for the next leg higher.
CRV Long Mad volume on CRV right now. After revisiting demand zone between 0.618 and 0.5 fib levels bulls have taken over with no visible resistance in sight.
Analysis of CRV/USDT Market DynamicsThis analysis centers around the CRV/USDT trading pair. By comprehensively considering multiple factors such as historical price movements, trading volume changes, technical indicators and the macro market environment, it delves deeply into the underlying logic of price trend formation, dissects the driving forces behind the volatility, and attempts to discover the potential investment opportunities therein. The aim is to provide cryptocurrency traders and investors with a comprehensive and in-depth interpretation of the CRV/USDT market and a reference for decision-making
Massive CRV pump coming....Go Long!!The DeFi sector is regaining momentum, and Curve's dominance in stablecoin liquidity remains unmatched. A long entry here.....Target - 5x-10x hold it till march
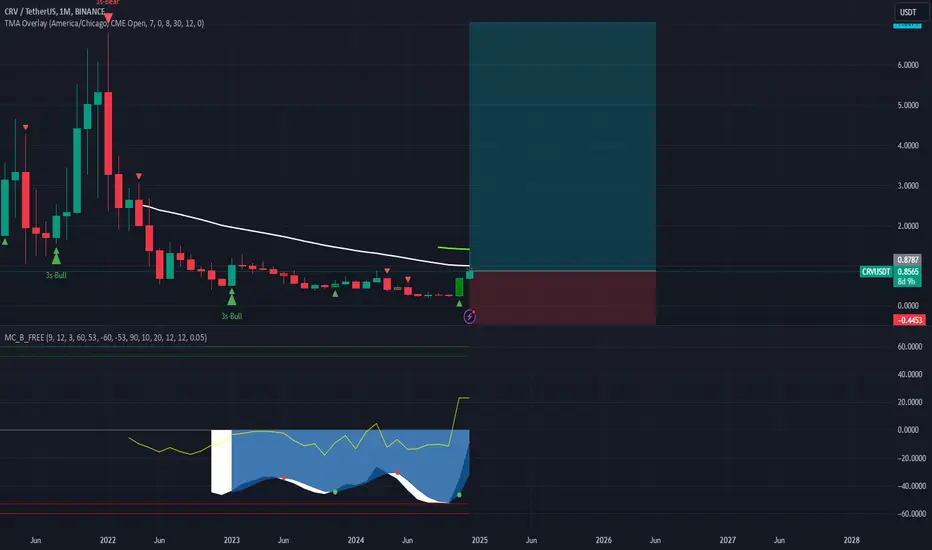
CRVUSDT Potential Long Term Accumulation-DistributionAs On 01June 2024
In this analysis, we focus on a long-term accumulation strategy for CRVUSDT.
Accumulation Zones:
$0.4720: Identified as an accumulation entry point for 10-20% of your position. Potential price movement of approximately 10-15%.
$0.4300: Stronger accumulation zone for an additional 5-10%. Potential price movement of 20-25%.
$0.3750-0.3300: Critical demand zone, optimal for accumulating 10-20% of the position. Potential price movement of 35-45%.
Distribution Zones:
$0.7000: First major distribution zone for partial distribution of accumulated assets (1-5%). Potential price movement of 50%.
$1.1410: Next distribution zone for further distribution (5-10%). Potential price movement of 145%.
$2.0974: Higher distribution zone, ideal for 10-20% distribution. Potential price movement of 305%.
Volume Analysis: Increased volume at support levels indicates strong buying interest and validates accumulation zones.
Current market sentiment shows a mix of consolidation with potential bullish reversal signals, supported by the harmonic pattern and volume spikes at lower levels.
This long-term accumulation strategy for CRVUSDT focuses on systematically entering positions at identified accumulation zones and distributing at key distribution zones. This methodical approach aims to capitalize on both the technical patterns and market sentiment, ensuring a balanced risk-reward ratio.
Additional Details about Curve DAO Token (CRV):
Market Cap: Approximately $400 million
Fundamentals: Curve DAO Token is a decentralized exchange optimized for stablecoin trading. It provides low slippage and low fee swaps between stablecoins, making it an essential component of the DeFi ecosystem.
Potential: Increasing adoption of DeFi and the need for efficient stablecoin trading solutions.
Previous Idea:

Unveiling Liquidity Siphons: How Crypto Whales Manipulate MarketIn the fast-paced and often opaque world of cryptocurrency trading, decentralized finance (DeFi) platforms have become the playground for some of the market’s most sophisticated players—crypto whales. These entities, armed with millions in capital, employ advanced strategies to influence liquidity pools, drain unsuspecting traders, and shape market sentiment in their favor. One such tactic, often referred to as a "liquidity siphon," is a masterclass in subtle manipulation.
Here’s how it works: Whales deposit significant amounts of liquidity into decentralized exchanges (DEXs) like Uniswap or SushiSwap, inflating the appearance of stability for a token. This lures in retail traders and smaller investors seeking a piece of what looks like a strong opportunity. Then, as volume builds, whales initiate rapid, large-scale transactions to create artificial price movements. By exploiting slippage and impermanent loss dynamics, they simultaneously profit from price arbitrage across other exchanges.
But it doesn’t stop there. These whales often plant false signals, leveraging on-chain data visible to the public to create a narrative that fuels FOMO (fear of missing out) or panic selling. They can even amplify their strategies with flash loans, borrowing millions in assets within seconds to further disrupt market equilibrium—all while remaining nearly anonymous.
The question for retail traders is: How do you spot this before you’re caught in the current? Key indicators include sudden spikes in liquidity, unusual trading volumes on low-cap tokens, and discrepancies in pricing across DEXs and centralized exchanges. Tools like Nansen or Dune Analytics can help uncover patterns in whale wallet movements, offering a chance to stay one step ahead.
Understanding the mechanics behind these moves isn’t just about protecting your portfolio; it’s about leveling the playing field. The decentralized ethos of crypto should empower traders, but staying informed and vigilant is the only way to truly capitalize on this volatile and ever-evolving market.
Do you think the rise of on-chain transparency will curb such manipulative tactics, or will whales always find new ways to dominate? Let’s discuss
#CRVUSDT ( prision break ? )All we can do now is
wait for
the main red resistance line to break through from the red arrow.
so watch it carefully

TradeCityPro | CRVUSDT Favorite Among Ethereum Whales👋 Welcome to TradeCityPro Channel!
Let’s analyze CRV, one of the older and more popular coins in the DeFi space, previously a staple in many crypto whales' wallets.
🌟 Bitcoin Overview
Before diving into CRV, let’s take a quick look at Bitcoin. It recently hit a new ATH but faced a heavy rejection on the 1-hour timeframe, triggering significant selling pressure in the market.
Remember, these kinds of candles are typical during bull runs. They may appear bearish on higher timeframes, but they often induce FOMO and panic selling, leading to potential buying opportunities.
📅 Weekly Timeframe Analysis
After losing its critical support at 0.4107, CRV dropped to 0.2219. Following a decrease in selling pressure, the coin consolidated for several weeks in a box range.
With renewed whale interest, significant buying volume pushed the price up by 350%, breaking the box and daily resistance. The rally was capped at 1.2060, where CRV has been trading below for the past two weeks.
If you entered the market after the box breakout, you should already have a reasonable profit. You can either take partial profits or withdraw your initial investment, holding the remaining position as "free tokens."
If you missed the rally, it’s currently not an ideal entry point due to the large stop loss required. Wait for either a time-based correction (range-bound movement) or a price correction to 0.8065, which serves as the next major support level.
🌞 Daily Timeframe
On the daily chart, CRV moved upward after breaking out of the 0.2219 – 0.3169 range and is now trading below the 1.251 resistance.
Support: 1.0522 (lower timeframe), 0.7985, and 0.6217 for potential price corrections.
Resistance: A break above 1.251 could lead to higher price targets, with the first at 1.9109.
breakout above 1.2510 may provide a momentum-based entry, but it’s riskier than the earlier entry at 0.3169. Wait for confirmation, such as volume increase and RSI movement, before entering.
⏰ 4-Hour Timeframe
On the 4-hour chart, CRV has tested the 1.2693 resistance twice. This level could act as a key trigger for future positions.
📈 Long Position Trigger
Open a long position after breaking 1.2693, with confirmation through increased volume and RSI entering the overbought zone. This is a weekly resistance, so a fake breakout is likely if volume is low.
📉 Short Position Trigger
No short positions are being considered for now, as they go against the current trend. Instead, focus on finding setups in other coins or monitoring CRV for better opportunities.
💡 BTC Pair Insight
Against Bitcoin, CRV has been in a prolonged downtrend but recently started to recover after breaking 0.00000528. However, the real bullish movement will begin only after breaking 0.00001223, forming higher lows, and continuing its upward trend.
Avoid FOMO. If you miss CRV, there are plenty of other opportunities in the market.
📝 Final Thoughts
Stay calm, trade wisely, and let's capture the market's best opportunities!
This analysis reflects our opinions and is not financial advice.
Share your thoughts in the comments, and don’t forget to share this analysis with your friends! ❤️

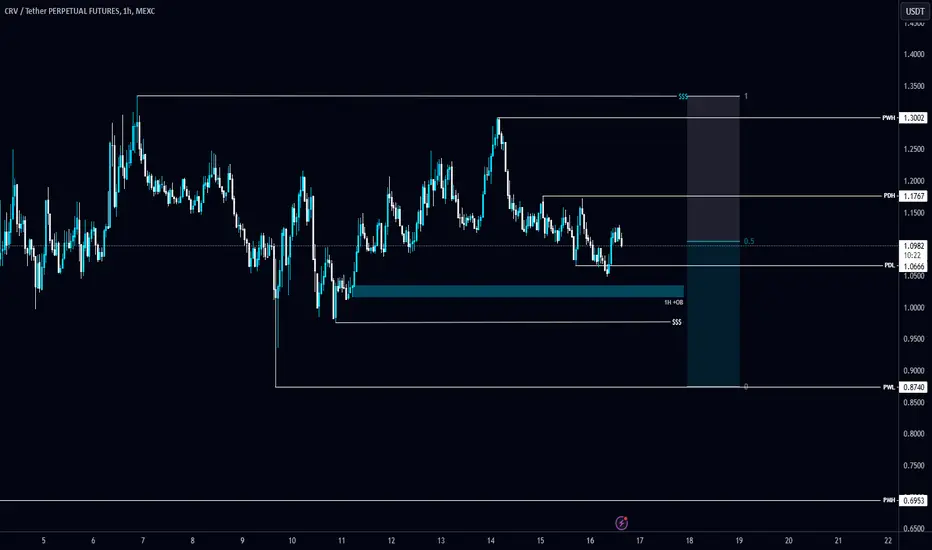
#CRV/USDT AnalysisLSE:CRV is ranging on the 1H timeframe.
:bulb: Plan: Watch for a tap into the 1H +OB to gauge the reaction.
:warning: If it fails to hold, sell-side liquidity might be swept.
:chart_with_downwards_trend: Key resistance: PWH $1.3
How are you approaching #CRVUSDT? Share your thoughts below! :point_down:
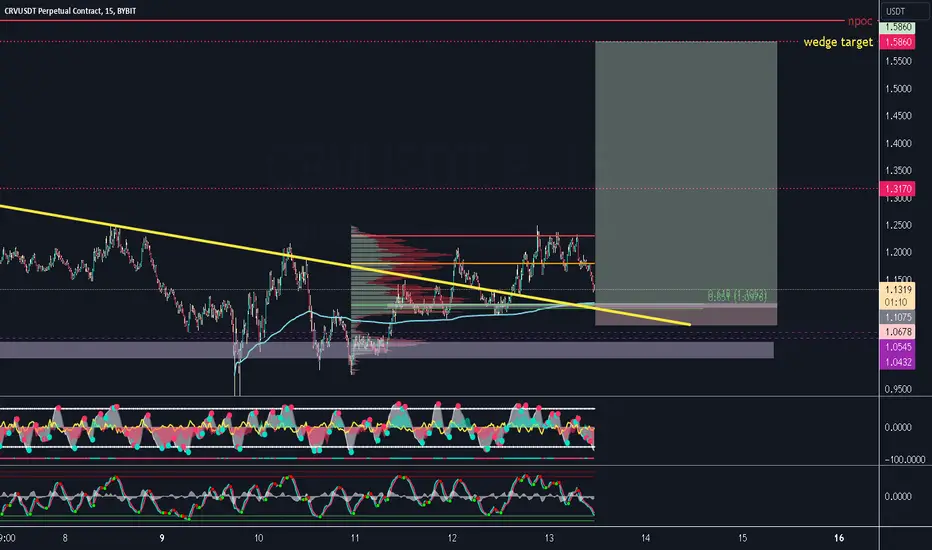
[CRV] CURVE DAO setup for possible (12rr)The entry is between anchored vwap from the last december lows with fibonacci retracement levels and value area low from tuesday lows. The target is the descending wedge pattern from the monthly timeframe.
Entry: $1,1075
Stop loss: $1,0678
Take Profit: $1,5860
Supply and demand strategy If this demand zone holds, the price may rebound toward the next supply zone.
The supply area above 1.207–1.248 represents where sellers previously stepped in and pushed prices downward.

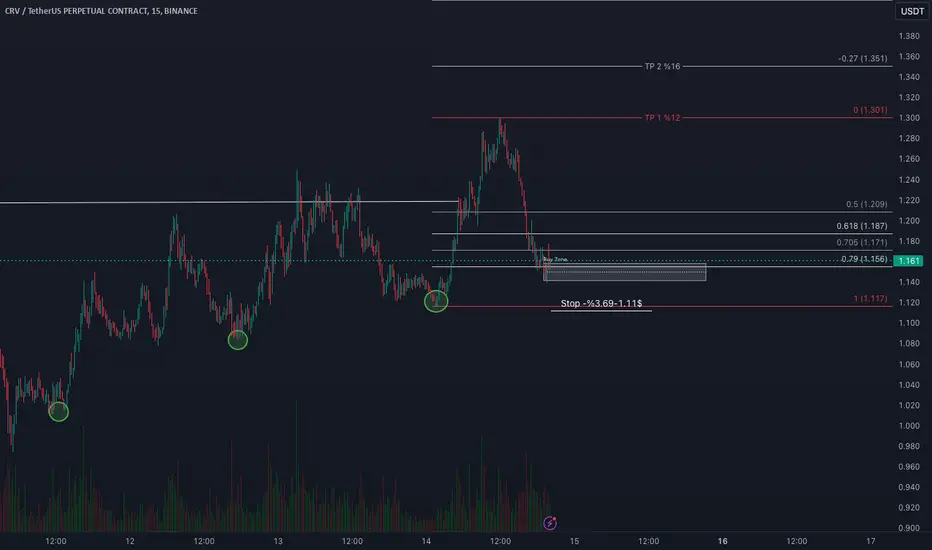
CRV/USDT Long (15mChart)
📊 **CRV/USDT Technical Analysis**
⏳ Timeframe:15-Minute Chart
📉 Outlook: Potential Long (Bullish Scenario)
🔍 Analysis Details:
1️⃣ Buy Zone: $1.156
2️⃣ Targets (TP - Take Profit):**
- TP1: $1.301 (+12% Gain)
- TP2: $1.351 (+16% Gain)
3️⃣ **Stop-Loss:** $1.117 (Risk -3.69%)
📈 **Key Fibonacci Levels:**
- 0.618:$1.187
- 0.705: $1.171
- 0.79: $1.156
🛑 Strategy:
- Entry Point: Around $1.156 (Buy Zone)
- Risk Management: Exit below $1.117 (Stop-Loss).
- Goal:** Gradual profit-taking at resistance levels.
✅ Bullish Expectation: Rebound from support + holding above Fibonacci levels.
⚠️ Note: This is not financial advice. Always manage your risk and do your own research!
---
#CRV #CRVUSDT #TechnicalAnalysis #Crypto #Fibonacci #Trading
CRVUSDT: Trend in daily time frameThe color levels are very accurate levels of support and resistance in different time frames, and we have to wait for their reaction in these areas.
So, Please pay special attention to the very accurate trend, colored levels, and you must know that SETUP is very sensitive.
BEST,
MT
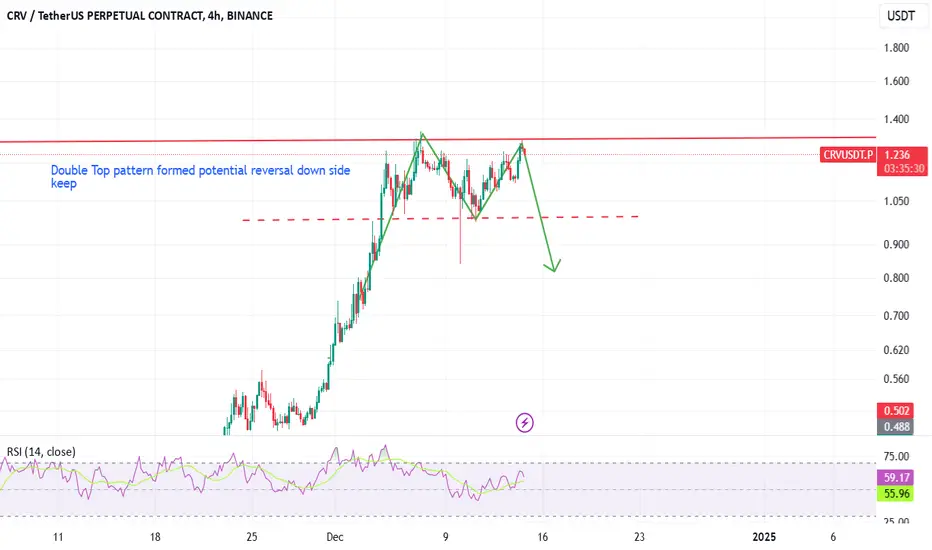
Reversal M or double top or equal highEqual high formed on same time see divergence on RSI. potential reversal pattern toward down side.