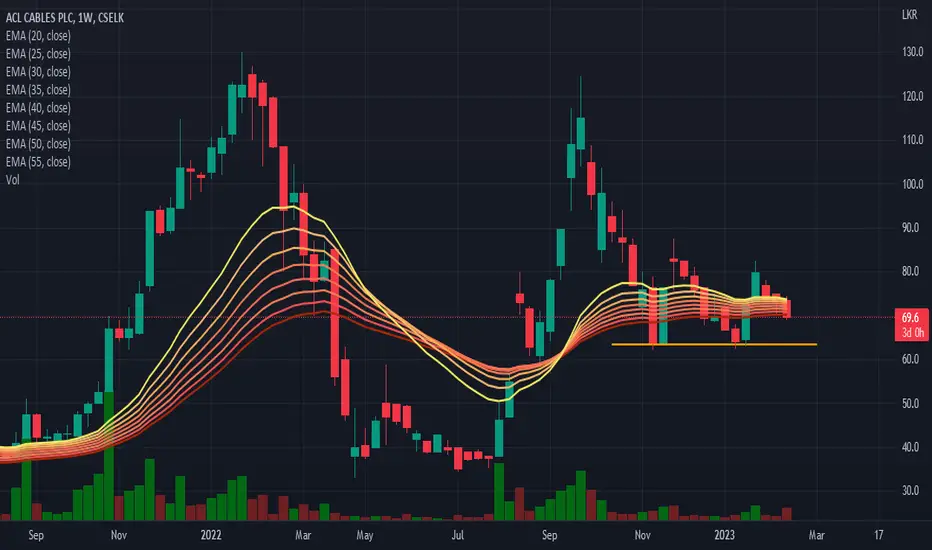
#CSEACL Bear trap possibly!The share has been consolidating since last october between 75-65 levels. The Co has been able to improve its export business in great strides over the last few years. This ensures steady flow of export revenue that can be utilised for import of raw material required for production.
ACL.N0000 trade ideas

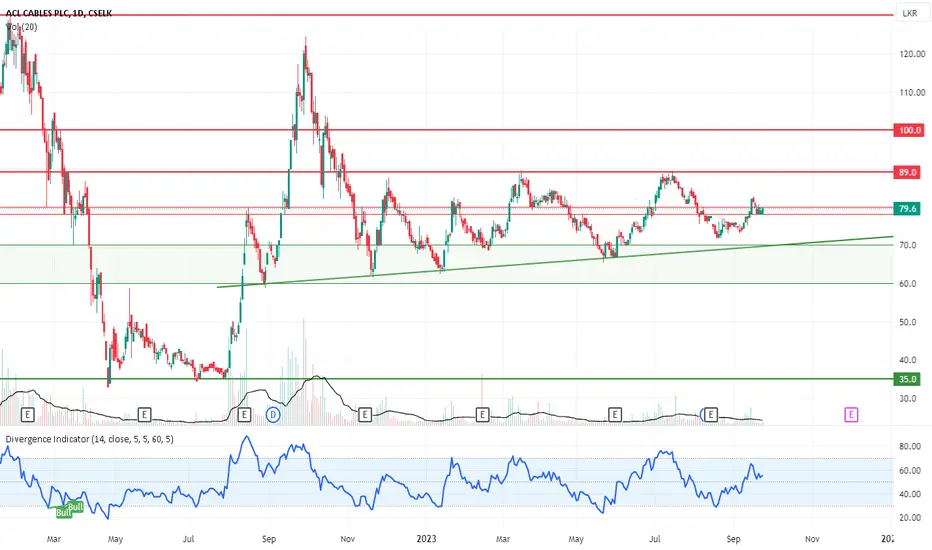
ACL BuyBetter to buy a chunk of ACL around 78.00 - 80.00 LKR price range. If you're buying new, better to buy 30% of the planned share amount, thinking of DCA if the price gets dropped. DCA buying plan is as follows.
78.00 - 80.00 LKR (30%)
60.00 - 70.00 LKR (33%)
Around 35.00 LKR (37%)
ACL.N0000Buy Zone - 65 to 71
Disclaimer: The information and analysis provided in this publication are for educational purposes only and should not be construed as financial advice or recommendations to buy, sell, or hold any securities. The author and TradingView are not responsible for any investment decisions made based on the content presented herein. Always consult a financial professional before making any investment decisions.

ACL on My ViewSeems moving on side ways, for the last impulse retest happened at fib 38% , need to break shaded resistance zone for a good run.

ACL.N0000Wait for pullback to 65 - 70
Disclaimer: The information and analysis provided in this publication are for educational purposes only and should not be construed as financial advice or recommendations to buy, sell, or hold any securities. The author and TradingView are not responsible for any investment decisions made based on the content presented herein. Always consult a financial professional before making any investment decisions.

ACL.N - ACL CABLES PLCCSELK:ACL.N0000
Disclaimer: This chart and analysis are not meant to be, and do not constitute, financial, investment, trading, or other types of advice or recommendations. Do your own due diligence before trading or investing in any stock exchanges, Indices, Stocks, Forex, Crypto etc.
ACL.N - ACL CABLES PLCDisclaimer: This chart and analysis are not meant to be, and do not constitute, financial, investment, trading, or other types of advice or recommendations. Do your own due diligence before trading or investing in this stock.
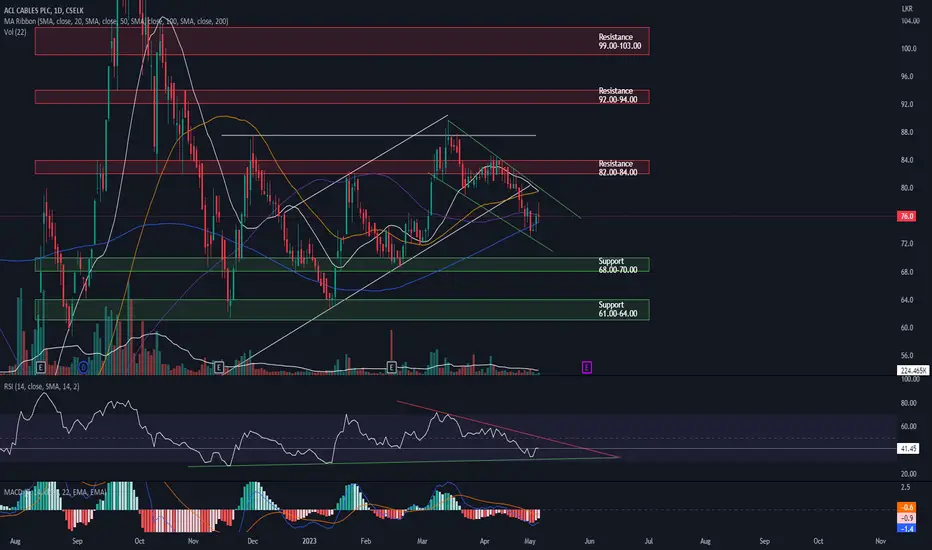
Share price is struggling to break the resistance zone.
The dotted ascending triangle pattern is intact. We need to watch how this line will be held.
Bollinger Bands are starting to squeeze too.
ACL - Cable guyACL has nicely broken and retested, and prepping to confirm with a BOS. However RSI has come near its trendline. Tomorrow closing above it will be vital for price to appreciate to further!
ACL.N - ACL CABLES PLCDisclaimer: This chart and analysis are not meant to be, and do not constitute, financial, investment, trading, or other types of advice or recommendations. Do your own due diligence before trading or investing in this stock.
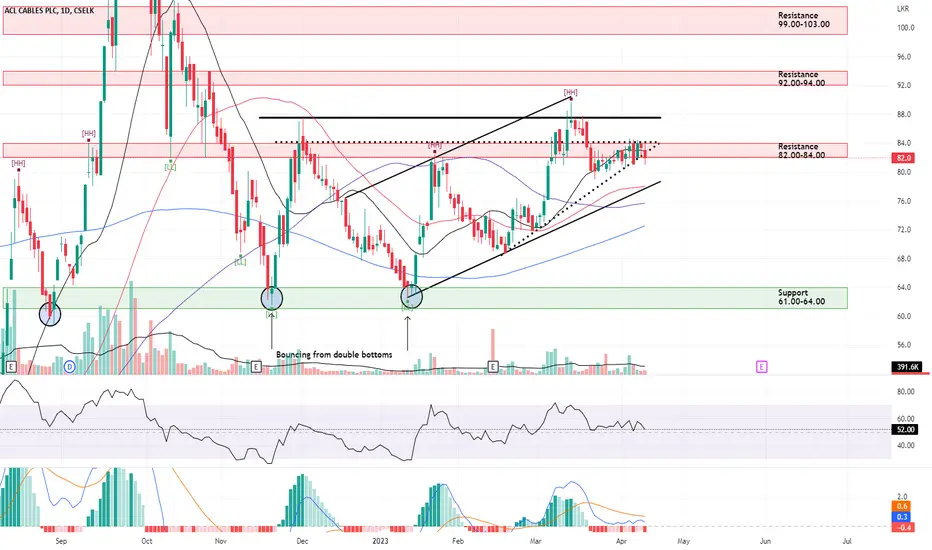
The stock is trading at the resistance zone 82.00-84.00 and trying to break it above. There is a supporting trend line (marked with the dotted line) which is also acting as near-term support.
The share is showing bullish behaviour. It is not beaten down because of the weak movements of the market.
The MAs are also looking fine and aligned correctly.

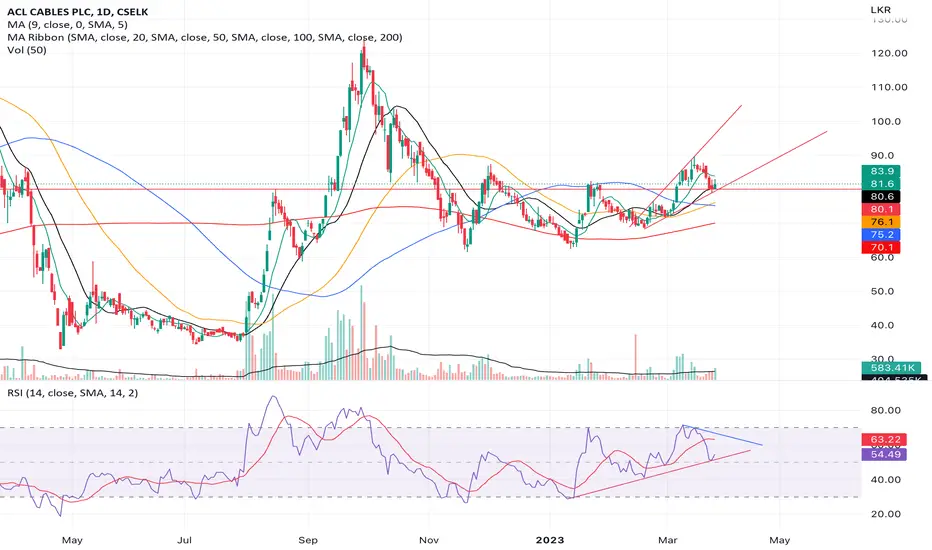
ACLHas taken support 79-80 levels together with MA 20.
Volume picking and RSI has taken support.
All MA's aligned with the 50,100 crossing.
at CSELK:ACL.N0000
ACLShould move towards the next Resistance of 94 - 96 where fib 0.5 also is.
MA's aligned except 50,100 which is also nearing cross.
Keep an eye on the dashed blue trend line. Each time the counter crossed it, it made an upward movement of 50%, 100% and 50%
Volumes are high on green days and low on red days.

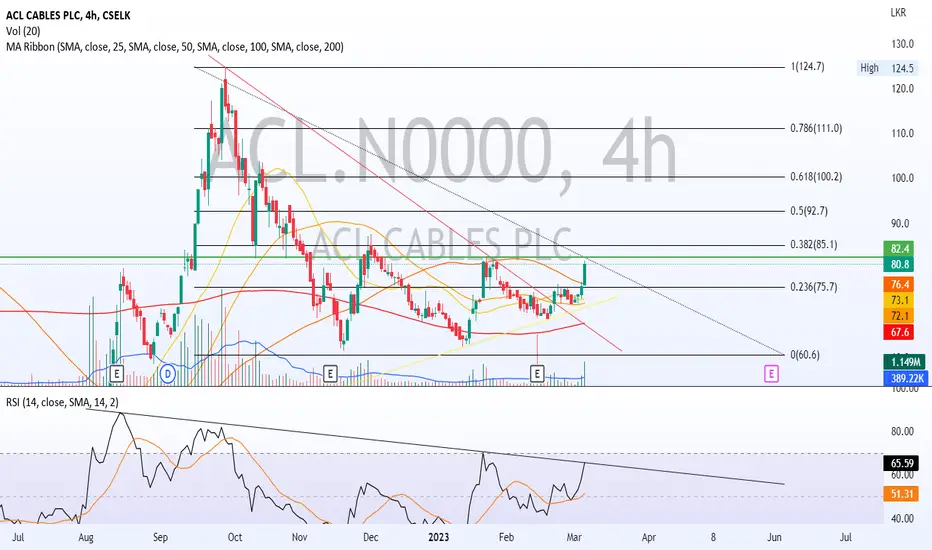
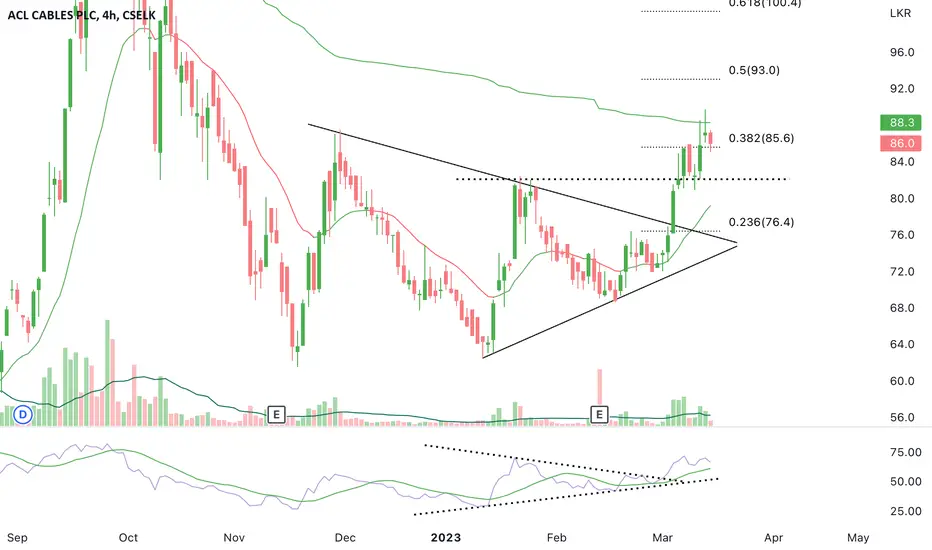
ACLACL had strong resistance from the AVWAP level at the 88.3 and is currently testing the fib support 0.382. It has nicely bounced back from the fib support and within next few days may move towards fib 0.5 level.
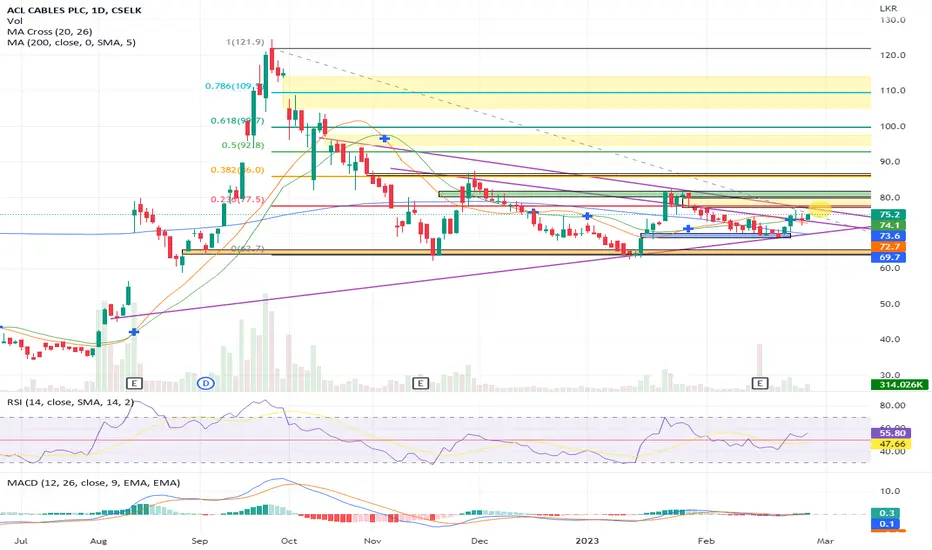
ACL.N #CSELKNext few days for ACL will be crucial.
77.5-80 is resistance. Trend line will also act as resistance.
MA 200 is on a downward slope.
If the above resistance area and trend line is broken, it will be good. Lets watchout our for the next few days
ACLCounter got rejected at the 85 Resistance. Possible to retest the 79.5 BO if failed, 76.
RSI BO and should remain above. possible retest with the price.
Double bottom visible.
MA's aligned. 100 will turn upwards once it is settled below 50
Price needs to settle within the channel to appreciate further.

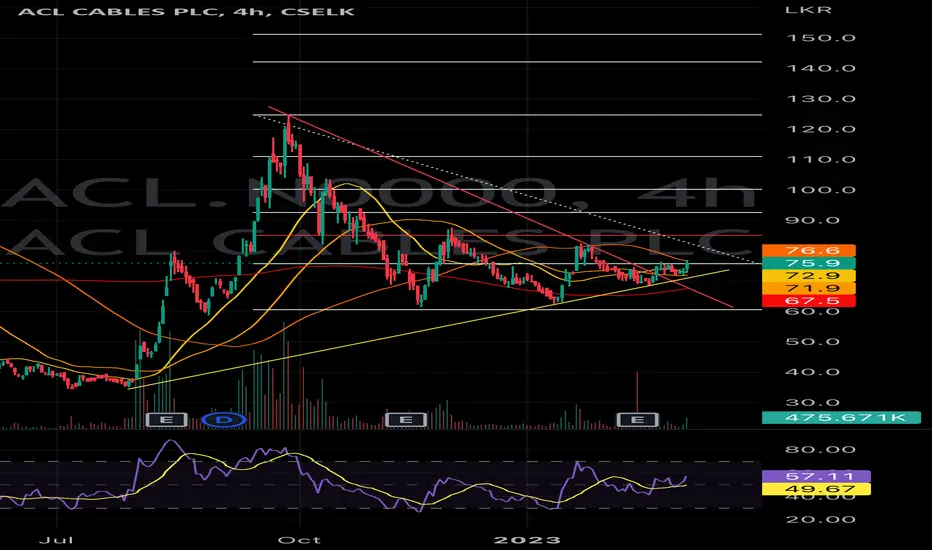
ACLThe stock has formed an Inverted Head and Shoulders pattern within a Descending Triangle. Traders could consider placing their stop loss at the previous higher low of 72. If the neckline around the 77 range is broken, it's possible that the stock may break out of the triangle pattern and move higher.


CSEACLResults for the 6 Months ending is 18Rs EPS. Upcoming earnings for the year to have a bearing on the future direction of the share price. PE wise the share is attractive under 70rs. The company is exposed to Export markets, and thus an automatic hedge. Support is expected to come below 70rs. Technically share price declined today on heavy selling pressure. This could be due to anticipated earnings release in this week.
ACL 1H - 09.02.2023This is not a Buy, Sell, Hold recommendation. It's published for reference to see how the prices move forward.
Watching ACL price movements. 71.70 to 73.50 had interest.
