AEL Prediction (2024 Dec 11) - Retracement Not a BHS recommendation. Just Sharing my idea.
CSELK:AEL.N0000 - The overall trend is uptrend.
TimeFrame - Daily
Higher High is formed @31.80 and Retracement is already happening
Possible reversal @29.80 (From the highlighted green box)
Confirmations for the reversal -
Fibonacci levels (0.66 and 0.618)
The Previous Up-Trend Resistance has now become a Resistance
Hidden Regular Divergence is possible which is a Trend Continuation Divergence
Expecting Reach the Price to 35 which is a Weekly Resistance
AEL.N0000 trade ideas

AEL.N Prediction (2024 Dec 04)Not a BHS recommendation. Just Sharing my idea.
CSELK:AEL.N0000 - The overall trend is uptrend.
TimeFrame - Daily
Confirmations for a pullback:
The Up Trend Resistance Line is touching the wick. In previous instances, when the trendline touched the wicks, the price respected and reacted to the line.
There is a daily resistance at 29
Possibility of forming a Regular Bearish Divergence, Hence price drop.
What could be the next level to be bounced back? There are a few confirmations.
There is an RBR Demand Zone between 27.1 and 27.4
When using the Fibonacci Retracement tool assuming the new HH is on 29, the 0.5 level aligned with the 27.4 price level.
There is a daily resistance at 27.5
Therefore, I expect the price to come down to 27.4 and bounce back to make a new Higher-High (HH) continuing the uptrend. The P/B value is below 1 which means still it is an undervalued counter.
StopLoss would be just below the demand zone (26.90)
Let's see to what extent this prediction works.

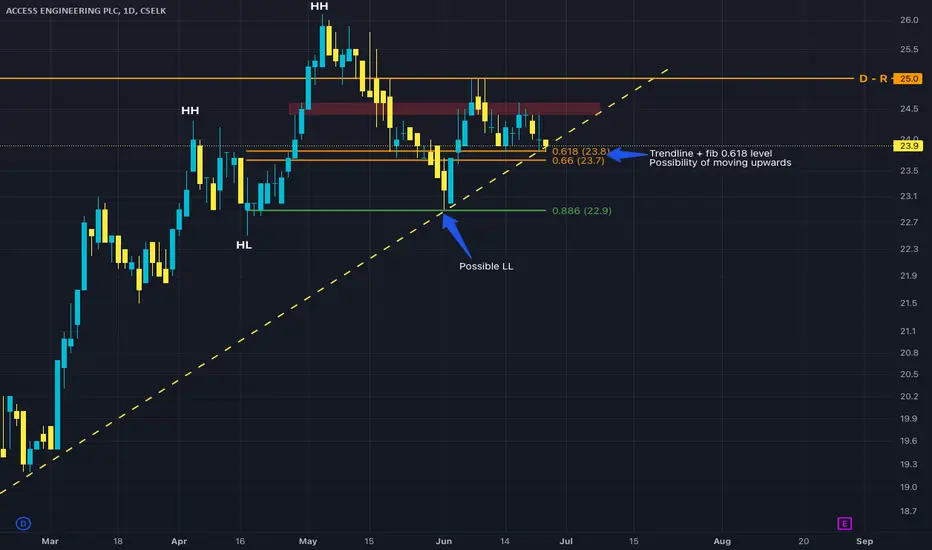
AEL.N Prediction (2024 June 27)**Not a BHS recommendation. Just sharing my idea.
AEL.N - The overall trend is uptrend .
In the daily chart, it is creating a correction wave and as indicated in the chart a possible higher low (in the chart it should be corrected as Possible HL) has already been made at 22.9. This is confirmed by both the trendline and Fibonacci retracement tool (0.886 level).
Currently, the market is at 23.9. There is a possibility of moving upwards with the support of the trendline and fib level (0.618) which becomes a support level.
There is weekly resistance as indicated in the red rectangle and daily resistance at 25. If both resistances are broken in the next few days, there is a possibility of creating a new higher high at 29.1 which is confirmed using the Fibonacci Extension Tool.
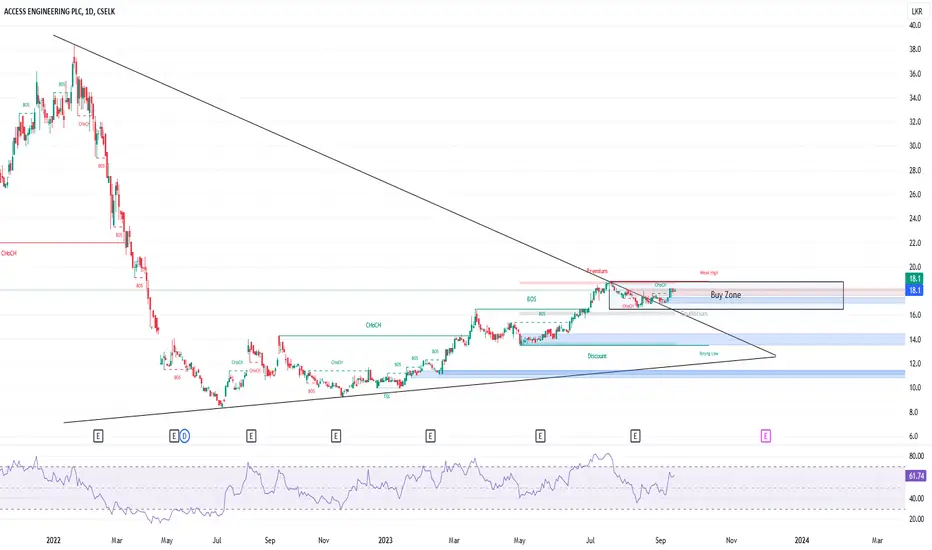
AEL.N0000AEL consolidating in Buy Zone
Disclaimer: The information and analysis provided in this publication are for educational purposes only and should not be construed as financial advice or recommendations to buy, sell, or hold any securities. The author and TradingView are not responsible for any investment decisions made based on the content presented herein. Always consult a financial professional before making any investment decisions.
AELGot supported at marked zone while making a hidden bullish divergence.
Short term fib target 15.8
mid term 21
zoom out to see more details
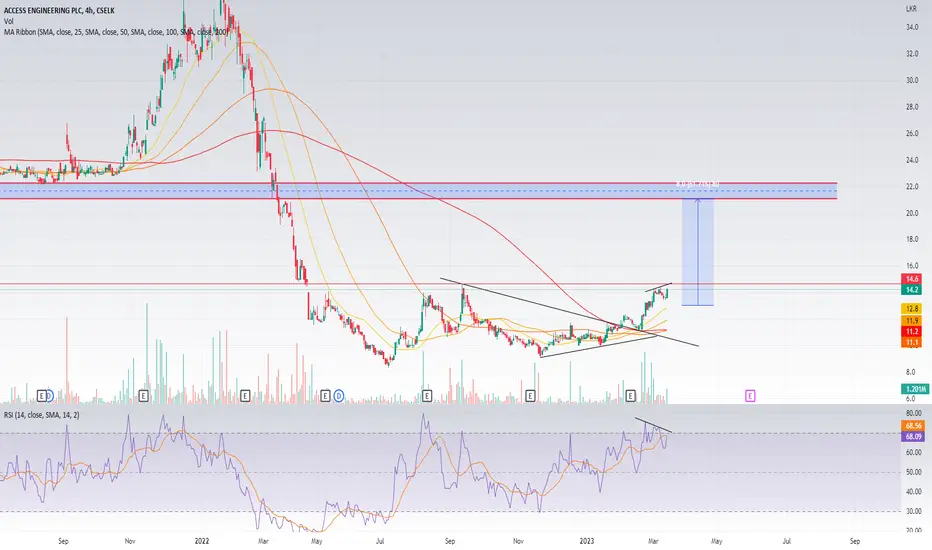
AELAEL has broken out from the Triangle and has achieved its short term target.
RSI might make a slight bearish divergence at 14.8 level. Keep a close eye
AELAEL has nicely breakout the cup and handle pattern with convincing volumes. Next we have resistance at the 17.7 17.9 area where we have AVWAP and fib resistances.

AELWith the breakout of the Cup and Handle pattern with proper volume, traders may expect the stock to reach 14.50 levels. To manage risk, consider placing your stop loss at the previous higher low of 12.60.

CSEAEL - Access Engineering PLCThe share has been consolidation for some time around 10-12 range. Now the share has broke out and trading near 14. There is a possibility in the ST to test 15+
