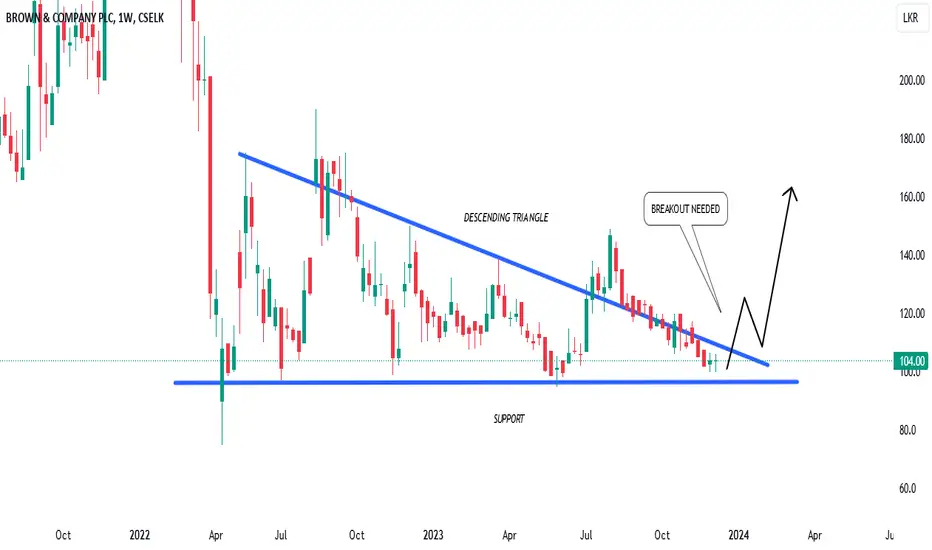
BRWN LONG PROJECTIONBRWN has pinpointed a significant support level on the daily timeframe, coinciding with the formation of a descending triangle. Should the price successfully validate a bullish breakout in line with our analysis, a promising upward rally appears imminent. Anticipating a substantial bullish momentum, with the potential to reach levels close to the most recent swing high post-confirmation.
BRWN.N0000 trade ideas
BRWN.N - BROWN & COMPANY PLCCSELK:BRWN.N0000
Disclaimer: This chart and analysis are not meant to be, and do not constitute, financial, investment, trading, or other types of advice or recommendations. Do your own due diligence before trading or investing in any stock exchanges, Indices, Stocks, Forex, Crypto etc.
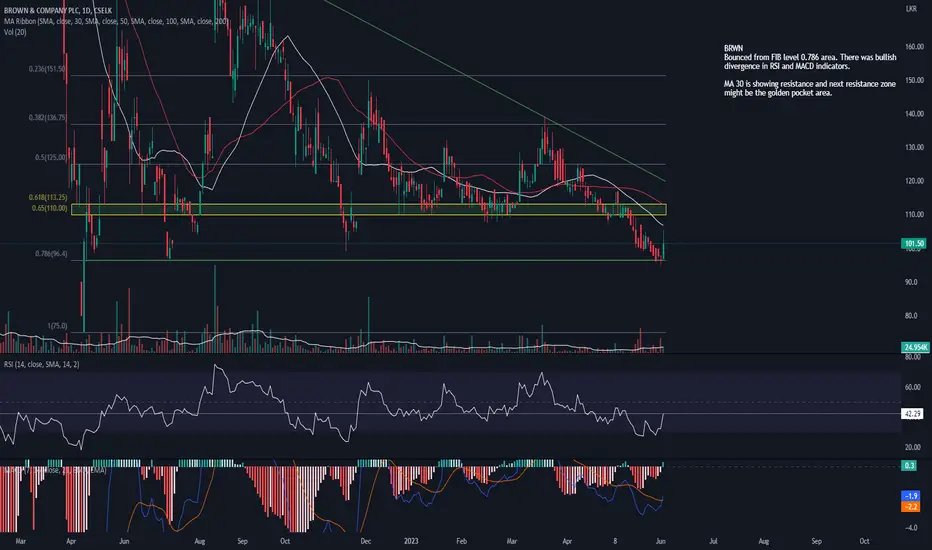
BRWN
Bounced from FIB level 0.786 area. There was bullish divergence in RSI and MACD indicators.
MA 30 is showing resistance and next resistance zone might be the golden pocket area.
BRWN.N - BROWN & COMPANY PLCCSELK:BRWN.N0000
Disclaimer: This chart and analysis are not meant to be, and do not constitute, financial, investment, trading, or other types of advice or recommendations. Do your own due diligence before trading or investing in any stock exchanges, Indices, Stocks, Forex, Crypto etc.
BRWN.N on 08/05/2023
01. Share price settled above the trend line of falling wedge.

BRWNThe stock has broken out of the descending triangle pattern to the upside, indicating potential bullish momentum. If the buyers continue to push the price upwards, the stock may reach the target price of Rs. 155 obtained from the descending triangle pattern height, which aligns with the Fibonacci retracement level of 0.618.
Disclaimer: This chart and analysis are not meant to be, and do not constitute, financial, investment, trading, or other types of advice or recommendations. Do your own due diligence before trading or investing in this stock.
