hSenid Business Solutions PLC : HBS.N0000 : CSEOverview
HBS is an application software development company mainly catering to HR segment.
Strategy
A trade based on technical analysis.
Technical Analysis (Chart Patterns)
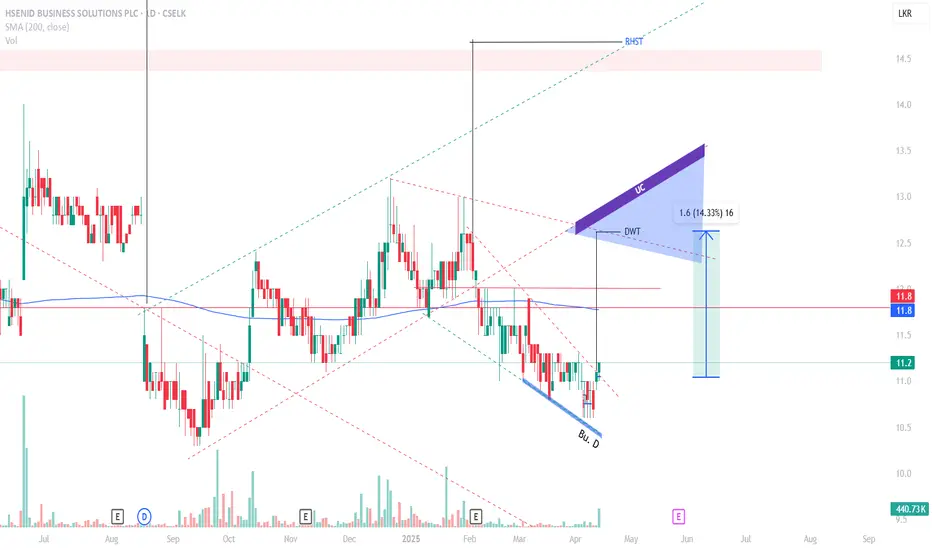
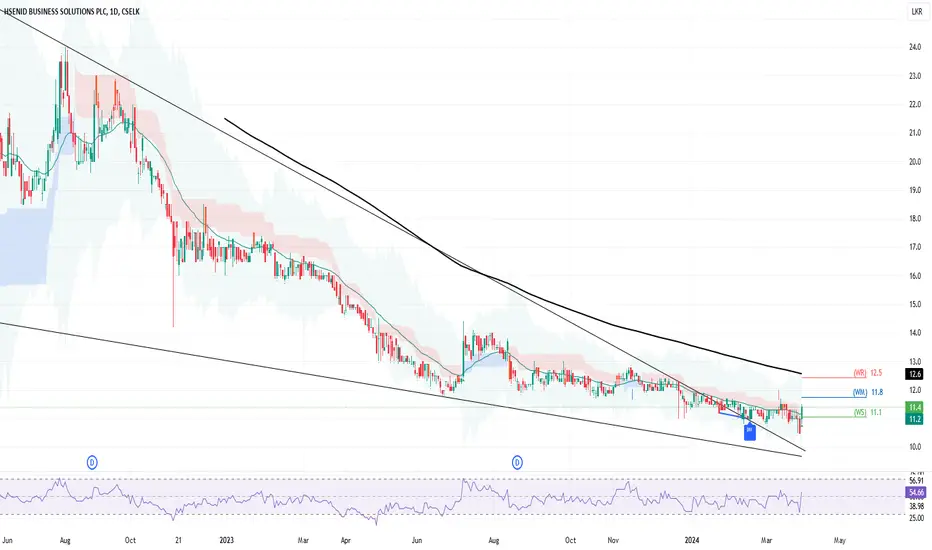
* HBS had created a bottom with a triple divergence.
* Friday 11th April HBS broke out from the Descending Wedge formation with good volume.
Potential Pattern Targets
* Pattern Target : LKR 12.60 (> 14% upside)
* If price sustained above UC line we can aim for higher targets towards LKR 16/17 area.
Invalidation
* Daily close below the broken pattern resistance line.
HBS.N0000 trade ideas
hSenid Business Solutions PLC / HBS.N0000 / CSEStrategy
1. Portfolio alignment to the sectors that will benefit from the rapid economic recovery of Sri Lanka.
2. Benefit from the expected price recovery/breaking out from the 1-year consolidation range (bottoming out) after post IPO selloff.
Most of the selling came from the account: Mr. O.E.H. Kalvo which had 19,800,000 shares as at 31st Dec. 2021 and are expected to be over by now.
Fundamentals
* Continuous top line growth during last 4 quarters
* As Sri Lanka's economy is on a growth phase exceeding forecasts HBS will benefit from
increased IT budget allocations of other companies and new ventures.
* Business exposure to high growth areas of the world (South Asia, Southeast Asia, Middle East and East Africa)
* Most of the major shareholders opted the dividend in the script form (reinvesting the dividend in the company) instead cash which shows the strong confidence of the company's growth trajectory.
No of shareholders requested for 100% script dividend: 12%
No of shareholders requested for 50% cash & 50% script dividend: 45%
Q1 2024 earnings
Revenue up 30.5% YoY & 7.6% QoQ
New deal closures up 44% YoY
Dividend Yield
Last Dividend LKR 1.25 (Cash/Scrip or both 50/50)
DY : 10.4% (Market DY 4.4% / 1 Year FD rate 8%)
IPO
Opened: 3rd Dec 2021
IPO Price : LKR 12.50
CSE debut Price LKR 28.50
52 Week Price Range
High : LKR 14.00
Low : LKR 10.50
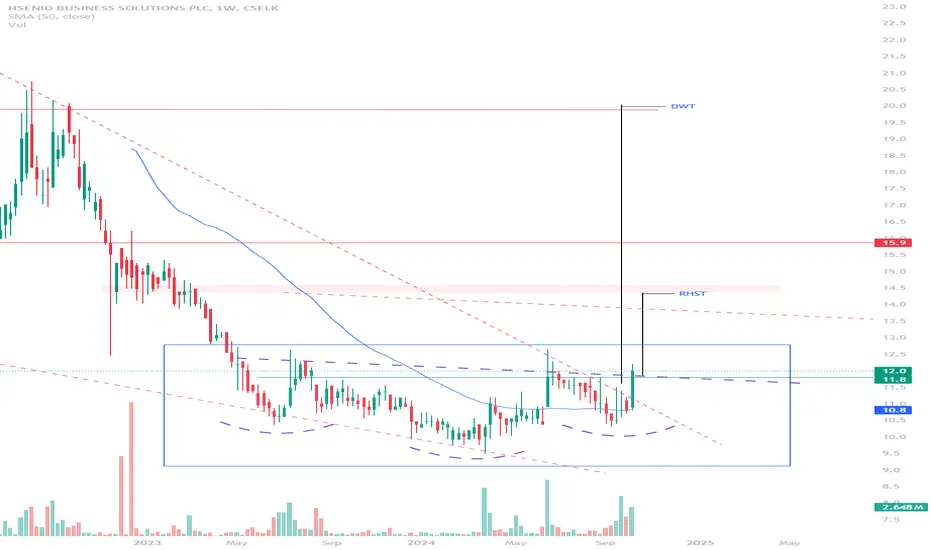
Technical Analysis (Chart Patterns)
* HBS had created a Descending Wedge pattern during the post IPO selloff and a Reverse Head & Shoulder pattern during the 1 yearlong price consolidation (Dividend adjusted chart).
* Both these patterns recorded breakouts during last week.
Potential Pattern Targets
* Multi week descending wedge target LKR 20.00
* Reverse head & shoulder target LKR 14.30
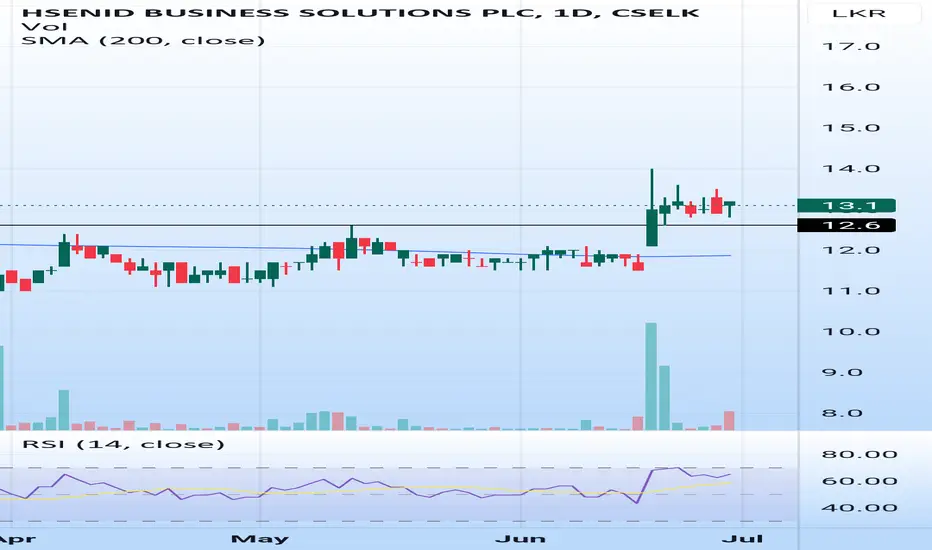
HBS.N0000Next Resistance Level - 12.5
Support Level - 11
Disclaimer: The information and analysis provided in this publication are for educational purposes only and should not be construed as financial advice or recommendations to buy, sell, or hold any securities. The author and TradingView are not responsible for any investment decisions made based on the content presented herein. Always consult a financial professional before making any investment decisions.
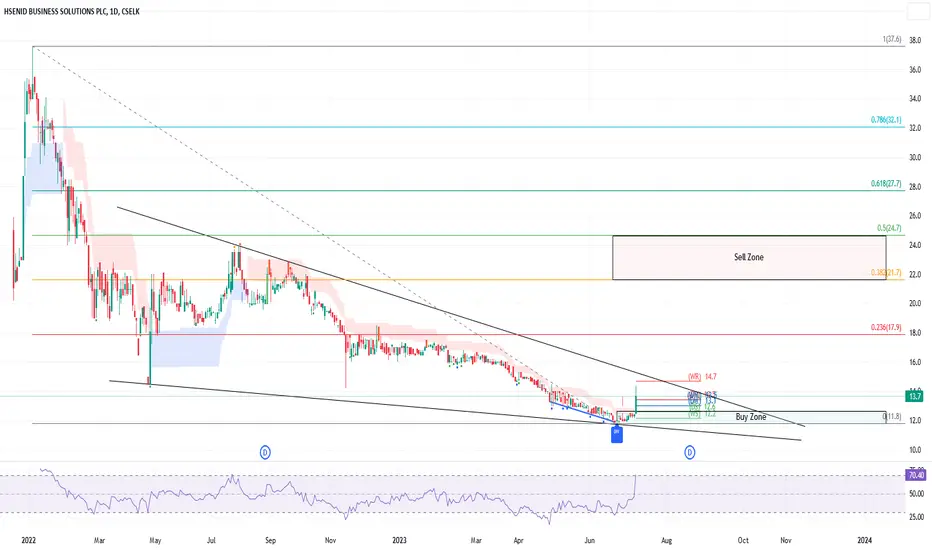
HBS.N0000 - Falling wedge patternFalling wedge pattern and bullish divergence in daily chart. Wait for a pullback and target around 20-25.
Disclaimer: The information and analysis provided in this publication are for educational purposes only and should not be construed as financial advice or recommendations to buy, sell, or hold any securities. The author and TradingView are not responsible for any investment decisions made based on the content presented herein. Always consult a financial professional before making any investment decisions.