MARA.N WeeklyThis chart and analysis are not financial advice. Do your own research before trading or investing.
CSELK:MARA.N0000
MARA.N0000 trade ideas

MARA.N WeeklyThis chart and analysis are not financial advice. Do your own research before trading or investing.
$CSELK: MARA.N0000
Pattern Analysis - Cup and Handle Formation:
The chart displays a well-formed cup and handle pattern with a neckline at 4.70. This bullish pattern often signals a strong move upward after the breakout.
Height of the Cup:
Approximately 3.7 LKR, suggesting a potential upside target near 8.40 (4.70 + 3.7) if the breakout sustains.
Current Position:
The price appears to be testing the neckline after a breakout, a key level to watch for confirmation.
Moving Averages
30 MA (Yellow): The price trades well above the 30-week moving average, indicating strong bullish momentum.
50 MA (Purple): The 50-week moving average also slows upwards, showing long-term support for the trend.
Volume Analysis - Volume Spike:
A clear increase in volume during the right side of the cup, especially near the breakout level, supports the pattern's validity. Declining volume during a potential pullback (if any) would further confirm a bullish breakout.
Support and Resistance Levels
Support:
4.70 (Neckline): This level now acts as immediate support. A retest here would be healthy as long as the price holds.
4.20 – 4.30: Recent price action and Fibonacci retracement levels provide a minor support zone.
Resistance:
Minor resistance is seen near 5.00 – 5.20 from previous highs.
The major target can be around 8.40 based on the cup and handle breakout projection.
Bull Case Scenario:
A sustained breakout above 4.70 with strong volume could trigger a rally towards 5.50–5.80 in the short term and potentially towards the 8.00–8.40 zone based on the pattern target.
Continued support above the 30 MA reinforces bullish sentiment.
Bear Case Scenario:
Failure to hold above 4.70 could lead to a retest of lower support levels at 4.30 or even 3.80.
A break below the 50 MA (~3.80) would invalidate the bullish thesis and signal a possible reversal or deeper correction.

MARA.NThis chart and analysis are not financial advice. Do your own research before trading or investing.
Disclaimer: This is just an idea, not financial advice.
Here's why some people might be interested in MARA.N:
Trading activity is high: There were a lot of shares traded recently, which can signal interest from investors.
Industry is hot: Tourism is picking up, and hotel stocks might benefit.
Why some investors might be bullish on MARA.N (optimistic about the price going up):
Support levels: The stock price has recently held steady around $2.90-$3.00. This is a good sign because it suggests there are buyers willing to step in at that price.
Past resistance turned support: The stock price used to have trouble going above a certain level, but now that level might actually act as a floor instead.
Technical indicator: A technical measure called the 50-day moving average is also trending upwards, which some traders use as a sign of potential future growth.
Breakout pattern: The stock price might be about to overcome a recent obstacle, which could lead to a price increase. There could be a gain of around 25%, but the price might fluctuate some before going up.
Potential roadblock:
Resistance level: There could be difficulty for the price to break above $3.50-$3.60 in the near term.
Remember: This is not financial advice. It's always a good idea to do your own research before investing in any stock.

MARA.N0000Buy Zone - 2 to 2.3
Disclaimer: The information and analysis provided in this publication are for educational purposes only and should not be construed as financial advice or recommendations to buy, sell, or hold any securities. The author and TradingView are not responsible for any investment decisions made based on the content presented herein. Always consult a financial professional before making any investment decisions.
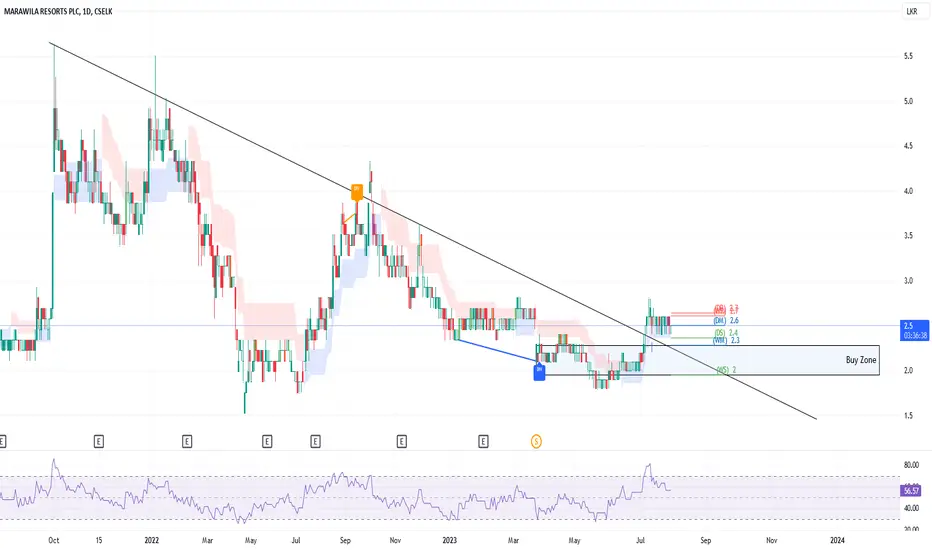
MARA - Ready for Run?Increased volumes signals renewed Interest on MARA post its rights issue at LKR 2.00. The Hotel was ranked the best "All Inclusive Hotel" in Sri Lanka by Trip Advisor and 11th in Asia. The company reported a positive EPS of 0.33 in Q4 FY23.Historically, LKR 2.00 has appeared to be a price of support. Yet trading below 100 / 50 EMA, a break-out from LKR 2.4 would likely see it reach LKR 3.0 - LKR 3.4.
