SCAP.N - SOFTLOGIC CAPITAL PLCDisclaimer: This chart and analysis are not meant to be, and do not constitute, financial, investment, trading, or other types of advice or recommendations. Do your own due diligence before trading or investing in any stock exchanges, Indices, Stocks, Forex, Crypto etc.
CSELK:SCAP.N0000
SCAP.N0000 trade ideas

SCAP.N - SOFTLOGIC CAPITAL PLCDisclaimer: This chart and analysis are not meant to be, and do not constitute, financial, investment, trading, or other types of advice or recommendations. Do your own due diligence before trading or investing in any stock exchanges, Indices, Stocks, Forex, Crypto etc.
CSELK:SCAP.N0000

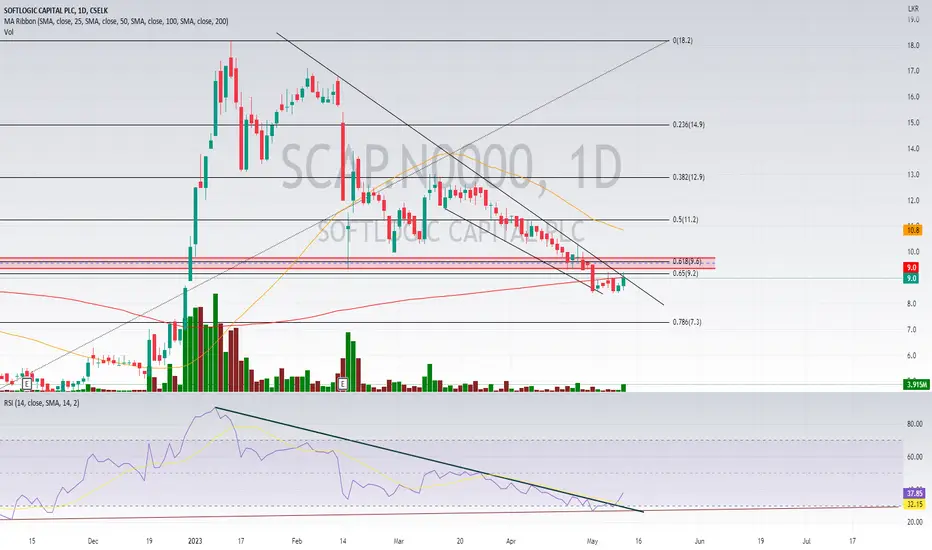
SCAPtoo much resistance at 9.6-9.2 range. Also 200dma overhanging
However RSI has given an early signal.
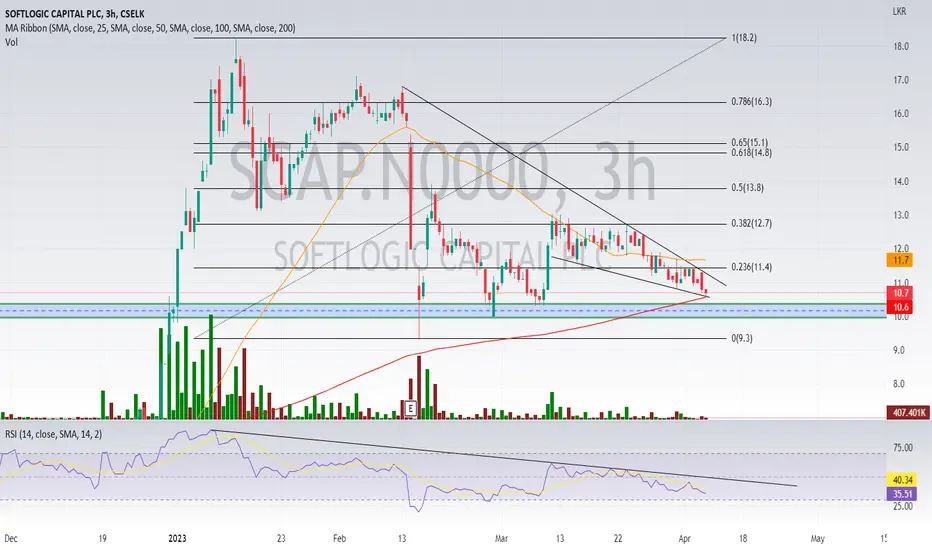
SCAPOnce again counter has come down to a support level while making a falling wedge pattern. Closing above 11 will turn the counter Much bullish. Do note that 200DMA (on 3hrly and 2hrly tfs) are one support. Also there is a massive cup and handle being made at weekly chart.
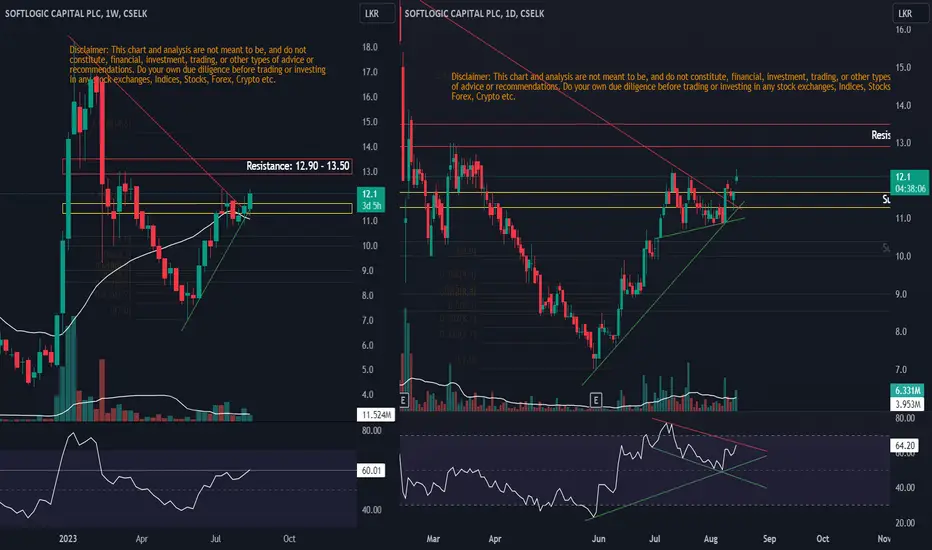
SCAP | AnalysisAnalysis: The stock has formed a symmetrical triangle pattern and is currently trading within the range of the 10 and 30-day moving averages. A bullish signal for the stock would be a breakout above both the symmetrical triangle pattern and the 30-day moving average. Such a breakout could potentially indicate further upward momentum for the stock.
Stop-Loss: 11.50
Disclaimer: This chart and analysis are not meant to be, and do not constitute, financial, investment, trading, or other types of advice or recommendations. Do your own due diligence before trading or investing in this stock.

SCAPhas broken out stronger than AAIC after getting support from the zone i have marked previous. RSI shows better strength as well...14.8-15.2 area shows great resistance for now. (remember that it is high risk and high gain.)

Lets Cap the SCAPSCAP shows strength in both in MACD as well as RSI in 1hourly format (taken due to short term fluctuations)
trendline resistance also has been broken.. 12.7-12.5 will be the next resistance zone for Bulls to be cautious of

SCAP | Unworthy RiskBy breaking the previous higher low to the downside, the stock has the potential to fill the long wick and reach the 9.30 level. If those levels are also broken, it may try to find support around the he 200-day moving average.
Without the creation of a higher high, the stock may carry risk for traders who are uncertain where to set their stop-loss.
