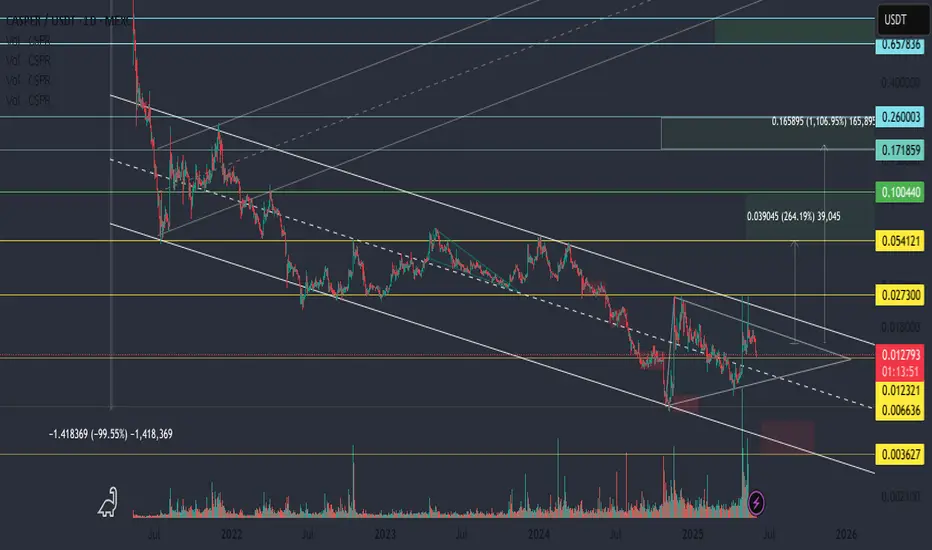
CSPR — Triangle Formation in Descending Channel with Low LiquidiCSPR has been trading inside a descending channel since 2022. Currently, a triangle pattern is forming — price action inside is choppy, with lots of wicks and noise caused by low liquidity. This may indicate spot buying pressure building up.
🔸 Why it's interesting: Due to low liquidity, CSPR can ex
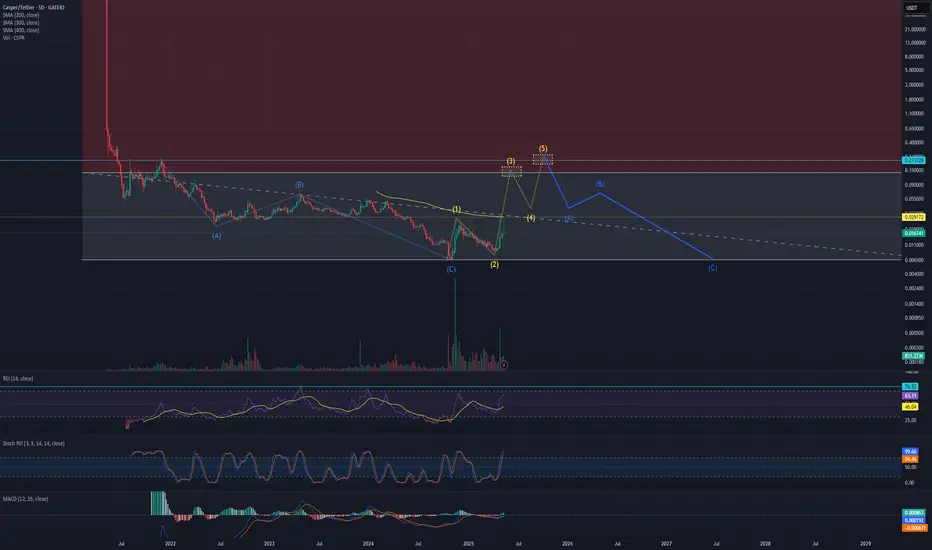
Realistic CSPR prediction CSPR is showing strength after completing a long brutal ABC correction.
CSPR has now completed its wave (1) and (2) and is about to make its parabolic wave (3) move.
Let's see if it reaches back to its former glory. I can't personally see CSPR making a new ATH this cycle.
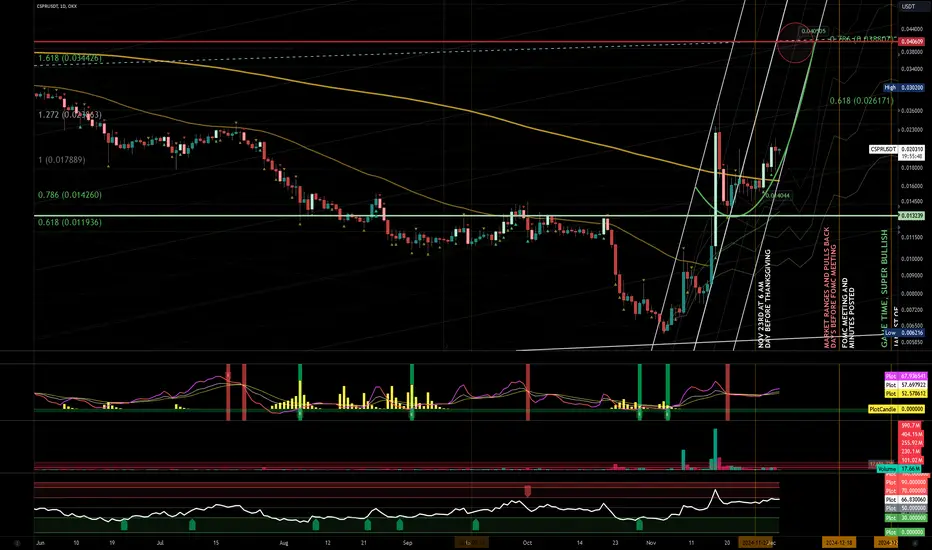
Buying opportunity in CSPR (1D)We have a strong move origin and a fresh, unmitigated support trading range on the chart.
Previously, there was also a bullish CH, and a good time correction has formed. If the price reaches the Demand zone, we will look for buy/long positions.
Targets are marked on the chart.
A daily candle clos

CasperLabs: Your Altcoins Choice (S5)This pair is looking really, really good right now with both, a bottom formation and also a higher low.
Good afternoon my fellow Cryptocurrency trader, thanks a lot for your continued support.
The low for CSPRUSDT happened in November 2024. The more recent low, April 2025, is a higher low. This

Is Casper finally on a clean slate?CASPER looks like its setting itself up for a bullish move after a horrendous ABC correction which required a new management team and engagement to the community.
It finally looks like the worst is over and there is light at the end of the tunnel for CSPR holders.

$CSPR is warming upSEED_ALEXDRAYM_SHORTINTEREST1:CSPR is getting warmed up
10x
....
....
....
....
....

CASPER LABS update + This post will be updated if neededThe departure of Casper Labs' former CEO and the sharing of Prove AI with Hedera Hashgraph has undoubtedly impacted CSPR's unique advantage. After reading the new CTO's article and watching some interview clips discussing their strategy to get back on track, there might be hope. However, I need to s

CSPR is going to $1.26 with easeWith the bull run in motion. There is suffice evidence for this to reach 1.26 dollars. By end of Q1 2025.

CASPER - Not looking goodI'm not going to lie, CASPR has one of the worst looking charts of any crypto that is still active.
This is likely due to them launching in the worst part of the bear market.
This is would be a sell/short for me but shorting any crypto in a bull market is rarely a good idea.
Fundamentals
Blockc

CSPRUSDT | Mapping Out Possibilities | Mid Term (1D)CSPRUSDT | Mapping Out Possibilities | Mid Term (1D)
As part of my profit taking strategy, I like to go through and map out potential levels of interest based on semi-bullish to very bullish mock up price action using fractals and fibs.
Based on concept of money flow... BTC, then ETH, then Larg
See all ideas
Summarizing what the indicators are suggesting.
Oscillators
Neutral
SellBuy
Strong sellStrong buy
Strong sellSellNeutralBuyStrong buy
Oscillators
Neutral
SellBuy
Strong sellStrong buy
Strong sellSellNeutralBuyStrong buy
Summary
Neutral
SellBuy
Strong sellStrong buy
Strong sellSellNeutralBuyStrong buy
Summary
Neutral
SellBuy
Strong sellStrong buy
Strong sellSellNeutralBuyStrong buy
Summary
Neutral
SellBuy
Strong sellStrong buy
Strong sellSellNeutralBuyStrong buy
Moving Averages
Neutral
SellBuy
Strong sellStrong buy
Strong sellSellNeutralBuyStrong buy
Moving Averages
Neutral
SellBuy
Strong sellStrong buy
Strong sellSellNeutralBuyStrong buy
Displays a symbol's price movements over previous years to identify recurring trends.